. 2025 Aug;644(8075):185-196.
doi: 10.1038/s41586-025-09114-8. Epub 2025 Jul 30.

Mouse lemur cell atlas informs primate genes, physiology and disease

Collaborators, Affiliations

Mouse lemur cell atlas informs primate genes, physiology and disease

Camille Ezran et al. Nature. 2025 Aug.

Abstract

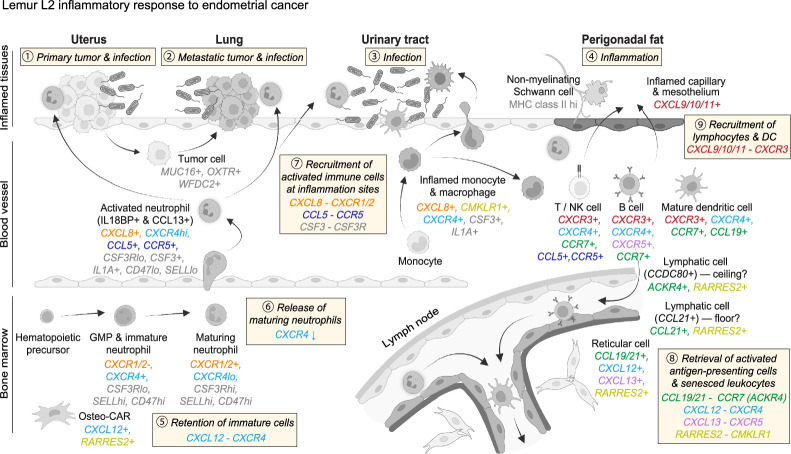
Mouse lemurs (Microcebus spp.) are an emerging primate model organism, but their genetics, cellular and molecular biology remain largely unexplored. In an accompanying paper1, we performed large-scale single-cell RNA sequencing of 27 organs from mouse lemurs. We identified more than 750 molecular cell types, characterized their transcriptomic profiles and provided insight into primate evolution of cell types. Here we use the generated atlas to characterize mouse lemur genes, physiology, disease and mutations. We uncover thousands of previously unidentified lemur genes and hundreds of thousands of new splice junctions including over 85,000 primate splice junctions missing in mice. We systematically explore the lemur immune system by comparing global expression profiles of key immune genes in health and disease, and by mapping immune cell development, trafficking and activation. We characterize primate-specific and lemur-specific physiology and disease, including molecular features of the immune program, lemur adipocytes and metastatic endometrial cancer that resembles the human malignancy. We present expression patterns of more than 400 primate genes missing in mice, many with similar expression patterns to humans and some implicated in human disease. Finally, we provide an experimental framework for reverse genetic analysis by identifying naturally occurring nonsense mutations in three primate immune genes missing in mice and by analysing their transcriptional phenotypes. This work establishes a foundation for molecular and genetic analyses of mouse lemurs and prioritizes primate genes, isoforms, physiology and disease for future study.


Conflict of interest statement

Competing interests: The authors declare no competing interests.

Figures

Fig. 1
Fig. 1. Organism-wide scRNA-seq uncovers new genes, splice forms and orthologues.
a–d, Discovery of new genes (transcriptionally active regions, TARs). f–j, Discovery of new splice forms. k–m, Enhancement of gene annotation. a, Scheme for finding uTARs in the genome. b, Fraction of the genome (base pairs) that comprise uTARs and aTARs. c, Stacked bar plot showing the median percentage (transcript reads) of differentially expressed uTARs (DE uTARs), non-DE uTARs and aTARs for each atlas cell type. Example cell types enriched for DE uTARs are indicated by their designation number. 13, sweat gland; 35, enterocyte; H2, enterocyte/goblet; 130, pericyte; 179, basophil; 233, corticotroph; 235, lactotroph; 244, ependymal; 248, myelinating Schwann. d, Dot plot of mean expression (based on unique molecular identifier (UMI) counts: ln[UMIgene/UMItotal ×104 + 1], abbreviated as ln[UP10K + 1] in dot heatmaps) and the percentage of cells (dot size) expressing the indicated DE uTARs during spermatogenesis. Gene names were assigned using a BLAST sequence homology search. e, Current (Mmur 3.0, top) and revised (using the scRNA-seq cell atlas, bottom) annotation of lemur immunoglobulin (Ig) loci. Numbers above gene clusters indicate the estimated number of functional genes and those in parentheses pseudogenes, lacking transcripts. f, Scheme for characterizing lemur splice junctions. Bars, exons; lines, introns. g, Splice junction categories. A, previously annotated; B–E, not annotated, including novel junctions between two annotated exon boundaries (for example, novel exon skipping, B), between annotated exon boundary and unannotated location in the gene (C), between two unannotated locations in the gene (D), and outside annotated genes (E). h, Percentage of total splice junction counts and reads and mean reads per junction for each category. i, Percentage of lemur splice junctions in each category that are conserved in both human and mouse genomes (All), only in human (H&L), only in mouse (L&M) or neither (L). j, Examples of genes (MYL6, CAST and FAM92A) with cell-specific and tissue-selective alternative splicing. Plots show the percentage of each isoform (coloured as in the diagram above) expressed in indicated cell types or compartments. k, Stacked bar plot showing the percentage of named (white), unnamed (grey) and uncharacterized (black) genes in lemur, human and mouse genomes, separated by protein-coding genes (PCGs), non-protein-coding (nPCGs) and all genes (All). l, Top, three types of human–lemur–mouse expression homologue triads. Left and middle, triads of sequence homologues with similar expression profiles that are assigned (NCBI and Ensembl) as orthologues (solid line) in all three species, and the lemur orthologue is named accordingly (left) or unnamed (middle). Right, triads of sequence homologues with similar expression profiles but not currently assigned as orthologues (dashed line) for at least one species. Bottom, number of each type when comparing lung or skeletal muscle cell-expression profiles. m, Dot plot comparison of the mean expression of selected expression homologue triads of each type across human, lemur and mouse lung and skeletal muscle cell types. Two lemur unnamed loci (LOC105862649 and LOC105862489) are assigned (NCBI) as orthologues of mouse and human CD14, but only LOC105862649 (arrowhead) is an expression homologue, which suggests that it is the true orthologue. LOC105874770 is assigned as an orthologue of human ALDH1A1 but not of mouse Aldh1a1 (missed). For the three RAMP genes in each species, note that lemur RAMP1 and human RAMP3 are evolutionary outliers (asterisks), with both resembling the conserved RAMP2 expression pattern. See also Extended Data Figs. 1–3 and Supplementary Fig. 2. Adv, adventitial; Alv, alveolar; AT2, alveolar type 2 cell; cDC, conventional dendritic cell; FAP, fibroadipogenic progenitor; pDC, plasmacytoid dendritic cell; PF, proliferating; SPC, spermatocyte; SPG, spermatogonium; SPT, spermatid. Source data
Fig. 2
Fig. 2. Organism-wide mapping of chemokine signalling and neutrophil maturation.
a, Dot plot of the mean expression of selected chemokine receptors and their primary cognate ligands across immune and other major interacting cell types in the atlas (10x data). Boxes of the same colour highlight cell types highly expressing a receptor (filled boxes) and its ligand (open boxes). b, UMAP of immune cells in the atlas (10x and SS2 data) that were integrated using the FIRM algorithm across all tissues and individuals, coloured by major immune cell type. Inset (boxed), extracted neutrophil UMAP with cells coloured by cell type. Black line, pseudotime trajectory; thin grey lines, individual cell alignments to trajectory. c, Neutrophil lineage cells (dots; coloured as in b inset) along the pseudotime trajectory (x axis) separated by the source tissue (y axis) and individual lemur (L1–L4; merged on the right). The light blue background highlights the trajectory location of non-activated, mature neutrophils (the main circulating neutrophil population in health) with progenitor or maturing cells to the left and activated neutrophils to the right. Note that lemur L1 had progenitor cells in the blood, which implicated dysregulation of granulopoiesis. Lemur L2 had maturing neutrophils in the blood (clinically called ‘left shift’). Lemurs L1–L3 all had activated neutrophils in peripheral inflamed tissues, which was probably in response to infection or malignancy. Grey dashed lines indicate organs not profiled. See also Extended Data Figs. 5–8, Supplementary Notes 4–7 and Supplementary Figs. 3 and 4. BM, bone marrow; Br, brain; Eos, eosinophil; GMP, granulocyte–monocyte progenitor; HPC, haematopoietic precursor cell; Hypo/Pit, hypothalamus/pituitary gland; LM, limb muscle; SI, small intestine. Source data
Fig. 3
Fig. 3. Cellular and molecular characterization of mouse lemur cancer and fat depots.
a,b, Image of an intact lung from lemur L2 (a) and a section stained with haematoxylin and eosin (b) showing metastatic endometrial tumour nodules on the lung surface and extending into the parenchyma (n = 1). Scale bar, 1 mm. c, UMAP of lung cells from lemurs L1–L4 (10x and SS2 data, FIRM-integrated) coloured by compartment. Note the isolated cluster (arrow) of epithelial cells, identified as metastatic tumour (Met) cells. d, Sina plot of the Pearson’s correlation coefficients between lung metastatic cells from lemur L2 and all other atlas cell types (10x and SS2 data, coloured by compartment). Note the high correlation with uterine non-ciliated epithelial cells (FXYD4+MUC16+) from lemur L3, presumptively a primary tumour. e, Dot plot of the mean expression in lung and uterus epithelial cell types (separated by lemur, coloured bars) of endometrial (and ovarian) cancer (EC) serum marker genes and genes (indicated by an asterisk) known to be amplified, overexpressed or mutated in EC with their cognate ligands, receptors and/or modulators. Lung met > epith, genes enriched in lung metastasis compared with lung epithelial cell types; Uterus tum > epith, genes enriched in uterine FXYD4+MUC16+ cells compared with other uterine epithelial cell types. f,g, FIRM-integrated UMAP of adipocytes and adipo-CAR cells (10x and SS2 data) coloured by cell type (f) and expression levels of indicated genes (g). Adipocytes form two main populations, distinguished by the expression of classical white (for example, NNAT) and brown (for example, UCP1) adipocyte markers (g), and designated here as UCP1low and UCP1hi, respectively. UCP1low formed two subclusters in UMAP that differed only in the total gene and UMI counts per cell and not the expression of any biologically significant genes (Extended Data Fig. 10a–c). h, Distribution of UCP1hi versus UCP1low adipocytes in the indicated fat depots and organs (10x and SS2 data from lemur L2 and combined fat depots from lemur L4). n, number of adipocytes. BAT, interscapular brown adipose tissue; GAT, perigonadal adipose tissue; MAT, mesenchymal adipose tissue; SCAT, subcutaneous adipose tissue. i, Dot plot of the mean expression of the indicated cell-type markers and differentially expressed genes in the indicated cell types (L1–L4, 10x data). Notably, the classical brown adipocyte marker CIDEA and the white adipokine RBP4 (asterisks) were equally expressed across all adipocytes. Symbols in brackets indicate the description of genes identified by NCBI as loci: [GZMBL], LOC105864431; [AOX2], LOC105856978; [AKR1B10L], LOC105857399 and LOC105860191; [ATP1A2], LOC105862687; [COX7A1], LOC105876884; [Uncharacterized 1], LOC105854963. See also Extended Data Figs. 9 and 10. Cil, ciliated; Met, metastatic; Non-cil, non-ciliated. Source data
Fig. 4
Fig. 4. Lemur expression patterns of PS genes.
a, Scheme for identifying and characterizing PS genes. The pie chart shows the fraction of the approximately 20,000 human protein-coding genes with identified orthologues (in NCBI, Ensembl and/or Mouse Genome Informatics) in lemur and/or mouse. The 539 (3%) that share an orthologue only with lemur (PS genes) correspond to 481 lemur genes b, Number of PS genes enriched (or depleted) in a specific tissue compartment. Cross-compartment, enriched or depleted in >1 compartment. c,d, Sina plots showing the expression of example PS genes that are compartment enriched or depleted (c) or organ-enriched (d) (10x data), with cell types (dots) grouped by compartment (c) or by organ (d). e, Dot plot of the mean expression of PS genes enriched or depleted in the germ compartment. Values are averaged across all cells in the indicated non-germ compartments and germ cell types (10x data). f, Dot plot of the mean expression of selected PS genes in 63 orthologous cell types in human and lemur lung (L), skeletal muscle (M), liver, testes, and bone marrow and spleen (B/S). Rows, orthologous genes (indicated with human gene symbols). Columns, cell types displayed as paired dots showing expression in humans and lemurs. Symbols in brackets indicate the description of genes identified by NCBI as loci: [TRGC10], LOC105878255; [AMY2BL], LOC105863954; [MT1EL], LOC105866478; [CARD18L], LOC105862464, [H2BC12], LOC105858749; [AK1], LOC105869668; [HSFX4], LOC109730266; [SPANXN4], LOC105864720; [EXT], LOC105877793; [MT2A], LOC105866476; [MT2AL], LOC105866477; [MT1XL], LOC105866553; [H2H2BE], LOC105865505; [RPL36AL], LOC105873222. D/S, diplotene/secondary; EP, erythroid progenitor; Hep, hepatocyte; MG, mammary gland; MGP, megakaryocyte progenitor; MK, megakaryocyte; MuSC, skeletal muscle stem cell; VSM, vascular smooth muscle. See also Supplementary Figs. 5 and 6. Source data
Fig. 5
Fig. 5. Nonsense mutations in lemur immune genes and their transcriptional phenotypes.
a, Scheme for finding and transcriptional phenotyping of nonsense mutations in the profiled lemurs. b, NMD pathway showing the degradation of mRNA with a nonsense mutation (bottom) but not the corresponding WT mRNA (top). cn, Identified heterozygous nonsense mutations and their transcriptional consequences for three lemur immune genes present in lemur and human genomes but missing in the mouse genome: CD58 (cf), a ubiquitously expressed CD2-binding T cell activator; GBP1 (gj), an interferon-inducible GTPase highly expressed in endothelial cells; and LOC105864482 (PYH1N1 homologue; k–n), an interferon-inducible protein abundant in T cells and NK cells. c,g,k, Diagram of mutations (arrowhead) with the affected exon (E) in red in the affected (heterozygous mutant) individual lemurs. ‘Stop’ indicates a change to a stop codon in the mutant allele. d,h,l, Bar plots of relative transcript read counts in the mutant allele normalized to counts from the WT allele (raw values above bars) for each affected individual (10x data). Dots, each tissue. Note that transcript reads analysed here are only those that covered the mutation position. P values, one-tailed binomial test (combining reads from all tissues). Sample size (unique read count) indicated above the bar. e,i,m, Dot plots of the relative expression levels of the gene in mutant (heterozygous) versus WT individuals, normalized to the mean expression level across all WT cells (dashed line). Dots, cell types separated by each individual, coloured by compartment (n = 46, 49 (e); 9, 3 (i); 44, 19 (m) for WT and mutant, respectively). P values, two-tailed student t-test. f,j,n, Models of the effects of the nonsense mutation on the expression of the mutant and WT alleles of the gene. f, Simple model showing how NMD degrades only the mutant and not the WT transcript. Around 90% depletion of CD58 mutant transcript (d) results in about 45% less transcripts in heterozygous mutants (e). j, NMD destroys both mutant and WT transcripts (or, there is attenuation of a positive-feedback loop). Thus heterozygous mutants have a reduction in total GBP1 transcripts (i) greater than expected (h) from the simple model. n, NMD destroys mutant transcripts, but the gene exhibits compensatory transcriptional upregulation. Despite almost complete (99%) elimination of mutant transcripts (l), heterozygotes show only about 30% less total gene transcripts than WT animals (m). See also Extended Data Fig. 11. LOF, loss of function. Source data
Extended Data Fig. 1
Extended Data Fig. 1. Comparison of expression patterns of uTARs and annotated genes, and Ig gene structures.
a. Box plot of average silhouette coefficient values of the atlas datasets (separated by tissue, individual, and sequencing channel, N = 41) based on expression of annotated genes, aTARs, or uTARs. Box, mean±s.d.; red triangles, L4 colon example dataset as shown in panel d. Note the positive uTAR-based silhouette values of most datasets, supporting effective clustering of cells according to cell types by uTARs alone. b. UMAP of lemur male germ cells from testis (L4, 10x) embedded based on expression of either annotated genes (top) or uTARs alone (middle), colored by spermatogenesis stage (color code in c). Black line, pseudotime trajectory, with arrow indicating maturation direction; thin gray lines, individual cell alignments to trajectory. Dot plot (bottom) compares cellular pseudotime trajectory coordinates from annotated genes (x-axis) vs. uTARs (y-axis). Dashed black line, 1:1 relationship; r, Pearson’s correlation coefficient. c. Left, expression of selected sperm cell markers in germ cells ordered by the pseudotime developmental trajectory calculated by uTAR expression as in c. Right, number of expressed annotated genes (top) or uTARs (middle), and percent uTAR reads of total TARs (bottom), in each cell along trajectory. Note similar pattern of transcriptional downregulation of both uTARs and annotated genes during spermatogenesis. d. UMAP of colon cells (L4, 10x) embedded based on expression of annotated genes (top) or uTARs (bottom), colored by cell type as in e. e. Dot plot showing mean expression of selected DE uTARs across L4 colon cell types. Gene names for each DE uTAR based on sequence homology (identical names indicate multiple uTARs aligned to the same gene in another species). f. Percent of genes detected by TAR analysis as a function of the filtering threshold used to define cell type selective expression (i.e., TAR expression in any cell type ≥ e^threshold times that of the average of other cell types). Gene categories used include: the top 100 (black), 2000 (dark gray), and 5000 (light gray) variably-expressed genes annotated in Mmur 3.0 NCBI annotation, all genes (blue), PS genes (yellow), and genes annotated in Mmur 3.0 Ensembl annotations but missing from NCBI (green). g. Venn diagram of the 4003 DE-uTARs with sequence homology to coding regions (>1 hit by DIAMOND blastp analysis) and/or non-coding regions (>1 hit by Infernal cmscan analysis), according to Nf-predictorthologs analysis. h. Extension of schematic in Fig. 1e with lemur (top), human, (middle) and mouse (bottom) Ig loci for heavy chain (left) and κ (center) and λ (right) light chains, located on the forward (fwd) or reverse (rev) strand of the indicated chromosomes (chr) and colored as in key. Top lemur line shows annotation as in NCBI’s Annotation Release 101 of Mmur 3.0; line below shows revised annotation using the atlas. Filled boxes, constant (A, E, G, D, M for heavy, C for light chains), variable (V), joining (J) and diversity (D) regions; open boxes, pseudogenes. Above V regions are the estimated number of functional V genes (varies per individual) and, in parentheses, the estimated number of V pseudogenes (lack transcripts). Note smaller V cluster ~5 Mb downstream of constant region in heavy locus which may be an assembly error (main V cluster is upstream). Arrows below clusters indicate genes oriented opposite to direction of constant regions, and those with numbers indicate subset of those genes that are flipped. Values below lemur loci in gray indicate number of expressed alleles for each constant region isotype in each lemur profiled. i. Bar graph showing fraction of B and plasma cells (SS2) by their expressed Ig heavy chain (top), light chain (middle) isotype, and heavy chain variable domain (VH) family member (bottom), separated by individual (L2, L4) and colored as in panel h (gray, unassigned isotype). N, number of cells analyzed. Fractions for heavy chain isotypes are also shown separately for organs with ≥5 cells, revealing tissue specialization (e.g., IGA-expressing cells prominent in small intestine and pancreas). Note VH gene families related to human IGHV1, 3 and 4, show the broadest expression, as in human and mouse,,; however, light chain isotype IGL is more commonly expressed than IGK, in contrast to human and mouse B cells where IGK predominates. j. CDRH3 lengths (number of amino acids, aa) for L2 and L4 (SS2), compared to that of healthy humans and lab mice. N, number of analyzed cells for lemurs and number of unique clones for humans and mice, including all isotypes. Human and mouse data courtesy of Scott Boyd’s group and Tho Pham, (source data). CDRH3 lengths over 30 are not displayed because they are rare in human/mouse and did not occur in the lemurs analyzed. Note CDRH3 length in lemur is generally shorter than in human and more comparable to that of mouse. Though it is known that CDRH3 region length varies with age, disease state, and B cell maturity in order to affect antigen-binding affinity, the functional relevance of inter-species variation is unsettled. k. B and plasma cell clones identified by their CDRH3 sequence. Each clone is represented as a filled circle, with its outline color indicating the lemur from which the clone was found and the fill color indicating the heavy chain isotype(s) of the clone. All clones consisted of two cells except in spleen which is a three-cell clone. Dashed outlines represent which organ(s) the constituent cells of the clone were found in. Circles between two dashed outlines indicate that the clone was found in both organs. Source data
Extended Data Fig. 2
Extended Data Fig. 2. Expression of alternatively spliced isoforms across atlas cell types.
Stacked bar graphs showing percent of indicated splice isoforms expressed across atlas cell types for MYL6 that is differentially spliced across compartments, formatted as in Fig. 1j. Cell types shown are those with spliced transcripts of the gene in ≥300 reads across ≥10 cells (except for sperm cells with fewer reads/cells). Cell types are labeled by their tissue source and designation number, and colored by compartment. Top, transcript structure shown with splice isoforms labeled by corresponding NCBI Refseq ID and with exons affected by alternative splicing in red. Left, diagrams of mapped read buildups in Ex5-Ex7 genomic region are shown for the indicated cell types with weight of the connecting arcs reflecting the number of mapped reads (shown) that span each junction. See also Supplementary Fig. 2. Source data
Extended Data Fig. 3
Extended Data Fig. 3. Additional examples of expression homologue triads.
Dot plots as in Fig. 1m with additional examples of expression homologue triads (named, unnamed, missed orthologue, and non-orthologue types) across human, lemur, and mouse lung and skeletal muscle cell types indicated. Corresponding triad diagrams are shown on the right. Note, three RAMP expression homologue triads are detected: two non-orthologues (i.e., hu RAMP2 - le RAMP1* - ms Ramp2, hu RAMP3* - le RAMP2 - ms Ramp2) and one named orthologue (hu RAMP2 - le RAMP2 - ms Ramp2). Asterisk indicates the outlier non-orthologous gene. The shared expression patterns of lemur RAMP1 and human RAMP3 with RAMP2 suggests that lemur RAMP1 and human RAMP3 have evolved to engage in similar physiological functions as the species-conserved RAMP2 or to modulate RAMP2-mediated ligand signaling in lung endothelial cells. Similar non-orthologous expression homologues were identified for TEKT1/3, ADAMTS8/S15, and AEBP1/CPXM1.
Extended Data Fig. 4
Extended Data Fig. 4. Structure and global expression pattern of mouse lemur MHC class I and II genes.
a. Schematic of mouse lemur MHC locus on chromosome (chr.) 6. Filled rectangles, expressed genes; open rectangles, pseudogenes. Numbers below DRB, DQA, and DQB indicate the number of genes annotated by NCBI, though Guethlein et al. suggest a single gene for each family. Dashed lines, extended areas in genome assembly. g1, LOC105855356 in NCBI; g2, LOC105855357; g3, LOC105858107. b. Schematic of MHC class I gene locus on lemur chr. 20. Top line, gene order as annotated by NCBI’s Refseq Annotation Release 101. The three genomic segments are separated by gaps (slanted lines) in Mmur 3.0 genome assembly. Second line, proposed reorganization of assembly based on rearrangement of three segments to match gene order of a sequenced BAC (third line). Note gene content in Mmur 3.0 assembly and BAC differ due to haplotype variability in the individuals sequenced. Dashed lines connect corresponding genes. Fourth (bottom) line, proposed revision of structure and annotation of this locus based on above and the expression pattern of these genes in the lemur atlas. Dashed boxes, genes varying in either presence, copy number or expression status. W03 and W04 are sequences derived from the original study on the lemur MHC. Based on sequence similarity, 168, W03 and W04 could represent divergent allelic variants (or separate genes). 202 (g10) and 202P (g9) are a pair of phylogenetically related genes annotated by NCBI; there was no evidence supporting them as separate genes in atlas expression data, suggesting 202P is a pseudogene, genomic polymorphism, or an assembly error. g4, LOC105855949 in NCBI; g5, LOC105855951; g6, LOC105870766; g7, LOC105870764; g8, LOC105870765; g9, LOC105870769; g10, LOC105870767; g11, LOC105870762. c. Number of putative alleles for each MHC gene in the four lemurs (L1-4), and number of genes annotated in the BAC and by NCBI. Note some class I sequences differ only by a few base pairs among haplotypes, therefore the number of alleles in the panel represents our best estimate but may be inexact due to sequencing errors or other technical artifacts. C, genes that exhibit copy number variation; P, genes that have at least one allele that is a pseudogene;?, insufficient number of reads for a reliable allele count; NA, gene absent from BAC sequence. d. Comparison of mouse lemur MHC class I and class II regions with that of other primates and mouse,,,. Note lemur MHC class I region on chr. 6 contains only pseudogenes (opened boxes) whereas functional class I genes (filled boxes) are translocated to chr. 20. Dark blue, classical MHC class I genes (high, widespread expression); light blue, non-classical MHC class I genes (lower expression and/or tissue-specific expression), orange, MHC class II A genes; red, MHC class II B genes. Gray dashed box, genes with haplotypic variability in gene number or expression status. Cyan dashed boxes enclose mouse MHC haplotype T, M, and Q regions with expanded gene families. Dashed lines, extended areas in genome assembly. e. Schematic of the three Mimu-DRB genes in lemur genome assembly Mmur 3.0. DRB1-10 is predicted to encode a full length DRB1 polypeptide, whereas DRB1-1 and DRB1-4 are incomplete and contain non-MHC sequences (gray shading) but would together encode a functional DRB polypeptide, suggesting that these sequences were misassembled and belong together to form a second complete DRB1 allele. Thin vertical lines, positions that differ between the three sequences. f. Sina plots of summed expression of classical class I, non-classical class I, and class II MHC genes, respectively and averaged across cell types. g. Sina plots of ratio of summed non-classical to summed classical MHC class I expression, averaged across cell types and plotted separately by compartment. Note consistently lower levels of non-classical vs. classical MHC class I expression across almost all atlas cell types (dots), except a few highlighted cell types in the neural and germ compartments. Ste, brainstem; Cor, brain cortex; Ret, retina; Tes, testis. h. Dot plot of mean expression of each MHC gene across all atlas molecular cell types (10x, L1-L4), ordered by compartment and labeled by tissue and designation number. Gray dashed boxes, cell types highlighted in main text. Source data
Extended Data Fig. 5
Extended Data Fig. 5. Expression of chemokines and receptors across atlas cell types.
a. Heat map showing percent of chemokine ligands (n = 32), typical receptors (20), and atypical receptors (4) expressed across atlas cell types (10x, L1-L4), ordered by designation number and tissue. b. Rank of cell types based on the percent of expressed chemokine ligands (left), typical receptors (center), and atypical receptors (right). Cell types (dots) colored by tissue compartment. c. Extension of Fig. 2a with dot plot of mean expression of selected chemokine receptors and their primary cognate ligands across immune and other major interacting cell types in the atlas (10x). Gray boxes, cell types with inflammation and disease related expression patterns. See Supplementary Note 4 and Supplementary Fig. 3 for further analysis. Source data
Extended Data Fig. 6
Extended Data Fig. 6. FIRM-integrated UMAP of atlas immune cells and further characterization of neutrophils and B lymphocytes.
a-d. UMAP of atlas immune cells as in Fig. 2b but colored by proliferation state (a), scRNA-seq method (b), individual (c), and tissue of origin (d). e. Heatmap showing relative expression along neutrophil trajectory (10x) of lemur orthologues of human neutrophil markers. Colored bar indicates cell type designation as in Fig. 2b inset. For each gene, expression values (ln(UP10K + 1)) were normalized to its maximal value (99.5 percentile) in trajectory. Non-activated neutrophils in plot were uniformly subsampled (10%). Note human-like sequential expression of granulopoiesis marker genes; azurophilic (primary) granules (AZU1, MPO, ELANE) in early stages, followed by specific (secondary) granules (LTF, CAMP, LCN2), gelatinase granules (MMP9, ARG1), and finally secretory vesicles (ALPL, MME) in mature neutrophils. *, genes without a mouse orthologue; +, genes not expressed in mouse neutrophils. [], description of genes identified by NCBI as loci: [CTSG], LOC105866609; [DEFA4L], LOC105881499; [DEFA1], LOC105881500; [CCL8], LOC105885739; [CCL4], LOC105881712. f. UMAPs of lung neutrophils (10x) of the indicated individuals, with cells colored by cell type designation. Note the two subtypes of activated neutrophils (CCL13+ and IL18BP+) cluster separately from the main neutrophil population (non-activated) in both L1 and L2. g. Heatmap showing relative expression of the indicated marker genes for mature and activated neutrophils as well as DEGs for each activated neutrophil subtypes. Bars at top show for each neutrophil, its tissue source (top set of bars), individual lemur source (middle), and cell type designation (bottom). Note both activated neutrophil subtypes were found in more than one individual and from multiple tissues. Expression values for each gene were normalized to the maximal value (99.5 percentile) for the gene across all cells in the neutrophil trajectory. The mature (non-activated) neutrophils are highly abundant so uniformly subsampled (20%) in plot at late stage (>0.7) of the pseudotime trajectory. *, genes without a mouse orthologue. [IFITM3L], LOC105874071; [Uncharacterized 1], LOC105867541; [CCL2L], LOC105859340 and LOC105885684; [CCL13], LOC105859268; [Uncharacterized 2], LOC105856756; [CCL3L], LOC105881608. h. Dot plot showing mean expression in B lymphocyte lineage cells of marker genes for B cells, plasma cells, and top DEGs in the SOX5+ B cell population compared to other B cells (10x, L1-L4). Lemur B cells and plasma cells in the atlas appear relatively homogenous molecularly, except for SOX5+ B cell population identified in L4’s pancreas (with nearby lymph nodes). See Supplementary Note 6 for further analysis. Source data
Extended Data Fig. 7
Extended Data Fig. 7. Control of immune cell development, activation, and senescence.
Atlas-informed control of multi-organ tumor progression and the local and systemic inflammatory programs in L2, diagnosed with endometrial cancer (Step 1), metastatic spread to lung (2), secondary bacterial infection in both organs, plus suppurative cystitis (3) and suspected inflammation in perigonadal fat (4). Involved cell types in bone marrow (bottom left), circulating in blood vessels (middle), in the inflamed tissues (top), and in lymph nodes (bottom right) are shown along with their marker genes, and the signals (ligand–receptor pairs in tan boxes, colored as in Fig. 2a) proposed to control the local and systemic inflammatory steps (5-9) are indicated. Detailed description in Supplementary Note 5. Schematic created in BioRender. Ezran, C. (2025) https://BioRender.com/r8i9ddj.
Extended Data Fig. 8
Extended Data Fig. 8. Monocyte and macrophage lineage development and tissue specialization.
a. UMAP of atlas monocyte, macrophages, and their progenitors, integrated by FIRM across tissues and individuals (10x and SS2, L1-L4), colored by major cell types (top left), lemur individual (top middle), scRNA-seq method (bottom left), tissue source (bottom middle), and major groups of tissue-specific/resident macrophages (right). Note separate clustering of different macrophage subtypes as well as a unique population of activated monocytes (L2 bladder and perigonadal fat). b. Dot plot showing mean expression of classical marker genes for hematopoietic precursors, granulocyte-monocyte progenitors (GMP), monocytes, macrophage, and tissue-resident macrophage markers across monocyte/macrophage cell types and their progenitors, separated by tissue. Note some markers are shared between multiple cell types (see Supplementary Table 1 in the accompanying paper). [CD14L], LOC105862649; [CD163], LOC105869074; [CD209L], LOC105885453. c. Dot plot showing mean expression across cell type as in b of top DEGs in the indicated tissue-resident macrophage populations compared to all other macrophage populations. [CD300C], LOC105878881; [HLA-DRB1L], LOC105876782; [HLA-DQA2], LOC105869752; [CCL3L], LOC105882215; [TLL], LOC105872655; [SIGLEC8], LOC105866341; [SIGLEC7], LOC105882132; [FCGR3AL], LOC105873562; [KRT76L], LOC105871481; [PRXL2A], LOC105863040. d. Dot plot showing mean expression of the top DEGs in the population of separately-clustered monocytes from L2 bladder and perigonadal fat compared to the other atlas monocytes/macrophages (blood, lung shown), separated by individual. DEGs include inflammation-associated genes CD274/PD-L1, IL23A, AREG, CSF3, IL1A, suggesting these could be activated populations. [Uncharacterized 1], LOC105869025. See Supplementary Note 7 for further analysis. Source data
Extended Data Fig. 9
Extended Data Fig. 9. Further characterization of uterine tumor cells and metastasis to lung.
a-c. H&E sections of primary endometrial tumor cells in the uterus of L2 (a, N = 2), which metastasized to the lung (b, close up of Fig. 3b, N = 1), and of endometrial tumor cells of L3 (c), which metastasized locally. Scale bar, 20 μm (all panels). Full set of micrographs are available on Tabula Microcebus web portal. d. UMAP of lung cells (left, L1-L4, 10x and SS2) and uterine cells (right, L3, 10x) integrated by FIRM and colored by (top to bottom) compartment, epithelial cell type designation (non-epithelial cells in grey), expression level of uterine marker OXTR, and expression level of human endometrial cancer marker MUC16/CA125, respectively. Note isolated cluster of lung epithelial cells (arrow, from L2), identified as metastatic tumor cells and cluster of uterine epithelial cells (arrowhead, from L3), designated as non-ciliated epithelial cell of uterus (FXYD4+ MUC16+), presumed to be primary endometrial tumor cells. e. UMAP of all atlas cell types showing their mean transcriptional similarity (L1-L4, 10x). Each data point is a cell type (unique combination of tissue and free annotations), colored by compartment. Boxed inset shows close-up of indicated UMAP region with cell types colored by compartment (circle fill) and tissue of origin (circle border), and labeled by cell type designation. Note metastatic tumor cells (Met, arrow) from L2 lung and adjacent (molecularly similar) uterine non-ciliated epithelial cells (FXYD4+ MUC16+, arrowhead) from L3, supporting uterine origin of the metastatic tumor. Source data
Extended Data Fig. 10
Extended Data Fig. 10. Further characterization of lemur adipocytes and their expression patterns.
a. FIRM-integrated UMAP of adipocytes and adipo-CAR cells (10x and SS2) as in Fig. 3f with cells colored by (left to right) cell type designation, scRNA-seq method, individual lemur source, and tissue source, respectively. b. UMAP as above colored by expression level of indicated adipocyte markers (ADIPOQ, CIDEC) and example DEGs in UCP1lo (CHIT1, APOE) and UCP1hi (FABP3, KCNK3) adipocytes. c. UMAP as above colored by the number of scRNA-seq reads per cell (UMIs, 10x; transcripts, SS2, left) and number of genes detected per cell (right). Note the heterogeneity of UCP1lo population, which forms two subclusters distinguished by total read per cell and genes detected per cell, but not by any biologically significant DEGs. d. H&E-stained sections of fat tissues from L2 (left) and L4 (right) that are near the kidney (top) and paraspinal muscle (bottom), N = 4. Scale bar, 50 μm (all panels). Full set of micrographs available online on Tabula Microcebus web portal. e. Dot plot of mean expression of the top 10 DEGs in each of the four fat depots: BAT, interscapular brown adipose tissue; GAT, perigonadal; MAT, mesenchymal; SCAT, subcutaneous (L2, 10x). [Uncharacterized 1], LOC105856764; [Uncharacterized 2], LOC105867540; [COX7A1], LOC105876884; [Uncharacterized 3], LOC105867541; [MT2A], LOC105866476; [MT1E], LOC105866554; [CTRB1L], LOC105875474; [MAGEB16L], LOC105877758; [PRSS1L], LOC105873340; [IGLL1], LOC109729893; [IGLL5], LOC105882024; [RPS3], LOC105862350; [RPS20], LOC105874908; [RPS27L], LOC109731171; [RPL32], LOC105861123; [RPLP1], LOC105859117; [RPS15A], LOC105857549; [RPL29], LOC105863618; [FTL], LOC105870251. f. Dot plot of expression of adipokines LEP and ADIPOQ as well as their receptors across atlas cell types (L1-L4, 10x). Note abundant and specific expression of ADIPOQ but lack of LEP expression in adipocytes. Curiously, LEP transcripts are detected in the AKR1B1+ kidney loop of Henle cells (LoH), mesothelial cells, and some vascular-associated smooth muscle cells (SMC), although at very low levels. In contrast, LEPR shows expected expression in various cell types including tendon cells, fibroblasts, and endothelial cells, and high LEPR expression is found in mesenchymal progenitor cell types such as osteo-CAR and adipo-CAR cells. Also note ubiquitous expression of ADIPOR1 across almost all atlas cell types, and enriched expression of ADIPOR2 in sperm lineage cells and adipocytes. Source data
Extended Data Fig. 11
Extended Data Fig. 11. Further characterization of the identified nonsense mutations identified in the profiled lemurs.
a-d. Gene schematic (a), bar plot (b) and dot plot (c) of gene expression, and model of NMD regulation of the gene’s expression (d) as in Fig. 5c–n but for CLEC4E, a fourth gene with a nonsense mutation identified in a lemur in the atlas (L4). CLEC4E is an innate immune regulator expressed in neutrophils and monocytes. (c) N cell types = 19, 6 for wildtype and mutant, respectively. e. Length of preserved and C-terminus depleted portion of the mutant protein predicted for the four characterized genes with a nonsense mutation, based on the position of the nonsense mutation in the gene. Numbers at right of bar indicate the total length of the protein (black) and the percent of the depleted portion (red). f. Percent of transcript reads that cover the mutation position among all transcripts reads that align to the corresponding gene in the affected individual (10x). g. Dot plot showing mean expression of the four characterized genes across 63 orthologous cell types in human, lemur, and mouse. Rows are orthologous genes, indicated by their respective human gene symbols. *, lemur homologue for human gene PYHN1 is LOC105864482. Columns are cell types, displayed as trios of dots showing the respective expression, from left to right, in human, lemur, and mouse. Red cross, gene missing in mouse genome. Source data

References

    1. The Tabula Microcebus Consortium. A molecular cell atlas of mouse lemur, an emerging model primate. Nature10.1038/s41586-025-09113-9 (2025). - PMC - PubMed
    1. Goldstein, B. & King, N. The future of cell biology: emerging model organisms. Trends Cell Biol.26, 818 (2016). - PMC - PubMed
    1. Ezran, C. et al. The mouse lemur, a genetic model organism for primate biology, behavior, and health. Genetics206, 651–664 (2017). - PMC - PubMed
    1. Terrien, J. et al. Metabolic and genomic adaptations to winter fattening in a primate species, the grey mouse lemur (Microcebus murinus). Int. J. Obesity42, 221–230 (2018). - PubMed
    1. Bons, N., Rieger, F., Prudhomme, D., Fisher, A. & Krause, K.-H. Microcebus murinus: a useful primate model for human cerebral aging and Alzheimer’s disease? Genes Brain Behav.5, 120–130 (2006). - PubMed

LinkOut - more resources