. 2025 Aug;644(8075):173-184.
doi: 10.1038/s41586-025-09113-9. Epub 2025 Jul 30.

A molecular cell atlas of mouse lemur, an emerging model primate

Collaborators, Affiliations

A molecular cell atlas of mouse lemur, an emerging model primate

Tabula Microcebus Consortium et al. Nature. 2025 Aug.

Abstract

Mouse lemurs are the smallest and fastest reproducing primates, as well as one of the most abundant, and they are emerging as a model organism for primate biology, behaviour, health and conservation. Although much has been learnt about their ecology and phylogeny in Madagascar and their physiology, little is known about their cellular and molecular biology. Here we used droplet-based and plate-based single-cell RNA sequencing to create Tabula Microcebus, a transcriptomic atlas of 226,000 cells from 27 mouse lemur organs opportunistically obtained from four donors clinically and histologically characterized. Using computational cell clustering, integration and expert cell annotation, we define and biologically organize more than 750 lemur molecular cell types and their full gene expression profiles. This includes cognates of most classical human cell types, including stem and progenitor cells, and differentiating cells along the developmental trajectories of spermatogenesis, haematopoiesis and other adult tissues. We also describe dozens of previously unidentified or sparsely characterized cell types. We globally compare expression profiles to define the molecular relationships of cell types across the body, and explore primate cell and gene expression evolution by comparing lemur transcriptomes to those of human, mouse and macaque. This reveals cell-type-specific patterns of primate specialization and many cell types and genes for which the mouse lemur provides a better human model than mouse1. The atlas provides a cellular and molecular foundation for studying this model primate and establishes a general approach for characterizing other emerging model organisms.


Conflict of interest statement

Competing interests: The authors declare no competing interests.

Figures

Fig. 1
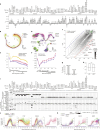
Fig. 1. Construction of the mouse lemur cell atlas.
a, Age and sex of the lemurs (L1–L4) profiled, the metadata collected and uses of the obtained tissues. b, Sections of lung (from lemur L1) and small intestine (from lemur L3), with close-ups on the right, stained with haematoxylin and eosin. n = 4. Scale bars (left to right), 1,000, 10, 100 and 25 µm. A histological atlas of all tissues analysed is available online (Tabula Microcebus portal), and histopathology is described in a separate study. c, Summary of the tissues collected, showing for each the number of biological replicates (individuals) and the number of identified molecular cell types. Asterisks indicate technically challenging tissues to obtain with only one replicate. d, Scheme for obtaining and processing scRNA-seq data. e, Dendrogram of the 256 assigned designations for the 768 molecular cell types across the atlas, arranged by compartment (epithelial, endothelial, stromal, immune, neural, germ) then ordered by organ system (epithelial compartment) or biological relatedness (other compartments). Designation numbers are provided below the abbreviations. Closely related molecular types are grouped (shown separately in Supplementary Figs. 1 and 2). H1–12, hybrid types with symbols between types for which the hybrid shares expression signatures; M1–M7, mixed clusters of distinct cell types too few to assign separately; PF, proliferative state. Dagger indicates tumour cells. See Extended Data Fig. 1 for the annotation pipeline. 1–2, interfollicular basal (Interfol); 3–6, interfollicular suprabasal; 7, upper hair follicle (Fol); 8, inner bulge; 9, outer bulge; 10, melanocyte (Mel); 11–12, channel; 13, sweat (Swt) gland; 14, granulosa (Gran); 15, unknown (Unkn) epithelial (CRISP3+); 16, unknown epithelial (PGAP1+); 17–18, respiratory (Resp) basal; 19, ciliated (Cil); 20, club; 21, respiratory tuft; 22, pulmonary neuroendocrine (Pulm NE); 23, alveolar epithelial type 1 (AT1); 24, alveolar epithelial type 2 (AT2); 25, uterine metastasis (Met); 26–27, basal; 28–32, suprabasal (Supra) basal; 33, filiform papilla (Fili pap); 34, enterocyte progenitor (Ent prog), small intestine (SI); 35–36, enterocyte; 37–38, goblet (Gob); 39, enteroendocrine (Ent-endo); 40, microfold (Mic-f); 41, intestinal (Int) tuft; 42–43, hepatocyte (Hep); 44, cholangiocyte (Cho); 45–47, acinar (Acn); 48–49, ductal (Duct); 50, pancreatic α (Pα); 51, pancreatic β (Pβ); 52, pancreatic δ (Pδ); 53, pancreatic polypeptide (PP); 54, podocyte (Podo); 55, proximal convoluted tubule (PCT); 56, proximal straight tubule (PST); 57, loop of Henle (LoH) thin descending (dsc) limb; 58–59, LoH thin ascending (asc) limb; 60–61, LoH thick ascending limb; 62, macula densa (MD); 63, distal convoluted tubule (DCT); 64–66, collecting duct principal (CDp); 67, α-intercalated (α-CDi); 68, β-intercalated (β-CDi); 69, urothelial (Uro); 70, basal urothelial; 71, intermediate (Inter) urothelial; 72, luminal (Lum) urothelial; 73–75, non-ciliated (Non-cil) epithelial of uterus; 76, ciliated (Cil) epithelial of uterus; 77, artery; 78, vein; 79–80, vasa recta descending limb; 81–82, vasa recta ascending limb; 83–87, capillary (Cap); 88, capillary aerocyte (Aer); 89, sinusoid (MAFB+) (Sin); 90, hepatic sinusoid; 91, glomerular endothelial (Glo); 92–94, lymphatic; 95, osteo-CAR; 96, osteoblast (Ostbla); 97, chondrocyte (Cho); 98, tendon (Ten); 99–100, skeletal muscle satellite stem (Stm); 101, skeletal fast muscle (Skt fast); 102, skeletal slow muscle (Skt slow); 103, cardiomyocyte (CM); 104, atrial cardiomyocyte; 105, ventricular (vent) cardiomyocyte; 106, nodal (Nod); 107, Purkinje (Pur); 108, smooth muscle (SM); 109, vascular-associated smooth muscle (VSM); 110, fibroadipogenic progenitor (FAP); 111–114 and 117–127, fibroblast (Fib); 115, adventitial fibroblast (Fib adv); 116, alveolar fibroblast (Fib alv); 128, myofibroblast (Myofib); 129, fibromyocyte (Fibmyo); 130, pericyte (Per); 131, adipo-CAR; 132–133, adipocyte (Adi); 134–137, mesothelial (Mes); 138, epicardial (Epi); 139, leptomeningeal (Lep); 140, reticular (Ret); 141, unknown stromal (NGFR+TNNT2+); 142, unknown stromal (COL15A1+PTGDS+); 143, unknown stromal (ST6GAL2+); 144–146, B cell; 147–148, plasma cell; 149, innate lymphoid cell (ILC); 150–154, NK cell; 155, NKT cell; 156–168, T cell; 169, haematopoietic precursor (HPC); 170, megakaryocyte progenitor (Meg prog); 171, platelet (Plat); 172, erythroid progenitor (Ery prog); 173–174, erythroid lineage (Ery); 175–178, neutrophil (Neu); 179, basophil (Bas); 180, eosinophil (Eos); 181, granulocyte–monocyte progenitor (GMP); 182–183, monocyte (Mon); 184–185 and 200–210, macrophage (Mac); 186, microglial (Mic-glia); 187, osteoclast (Ostcla); 188–191, alveolar macrophage (Alv mac); 192–194, interstitial macrophage (Interstit. mac); 195–199, Kupffer (Kup); 211, conventional DC (cDC); 212, plasmacytoid DC (pDC); 213, mature DC (Mat DC); 214–215 and 217, DC; 216, Langerhans (Lang); 218–222, GABAergic neuron (GABA); 223–226, glutamatergic neuron (Glut); 227, cone; 228, rod; 229, horizontal (Hor); 230, on-bipolar (Bipol on); 231, off-bipolar (Bipol off); 232, interstitial of Cajal (Interstit. Caj); 233, corticotroph (Cort); 234, gonadotroph (Gonad); 235, lactotroph (Lact); 236, somatotroph (Somat); 237, thyrotroph (Thyro); 238–241, astrocyte (Astro); 242, oligodendrocyte precursor (OPC); 243, oligodendrocyte (Oli); 244–245, ependymal (Epen); 246, choroid plexus (Chor-plex); 247, Muller; 248, myelinating Schwann (Mye); 249, non-myelinating Schwann (Non-mye); 250, spermatogonium; 251, early spermatocyte (Early); 252, pachytene spermatocyte (Pach); 253, diplotene/secondary spermatocyte (Diplo/Second); 254, early spermatid; 255, mid spermatid (Mid); 256, late spermatid (Late).
Fig. 2
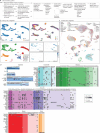
Fig. 2. Organ cell types and gradients.
a, Dendrogram of 71 identified kidney molecular types. b, Left, UMAP of kidney epithelial cells (L4, 10x). The trajectory (black line, cell density ridge) corresponds to the known cell spatial continuum along the nephron, beginning with the proximal convoluted tubule (55) and ending with the principal cells of the collecting duct (64–66). Note that macula densa cells (62) cluster between thin (58–59) and thick (60) ascending loop of Henle cell types and urothelial cells (69) near the principal cells of the collecting duct. Intercalated cells of the collecting duct (67–68) and podocytes (54) lie off the trajectory. Dots, individual cells coloured by molecular type; thin grey lines, cell alignments to the trajectory. Right, heatmap showing the relative expression of nephron markers along the trajectory ((ln[UP10K + 1] normalized for each gene to its maximal value (99.5 percentile) along the trajectory). Coloured bar, cell-type designations (as for the UMAP). c, Left, UMAP of vasa recta endothelial cells (L4 kidney, 10x). The trajectory reflects the spatial cell continuum along the vasa recta descending limb (VR D, 79–80) and the ascending limb (VR A, 81–82). Right, heatmap showing the relative expression of vasa recta markers along the trajectory. Note the marker transition from artery–arteriole (GJA5+) to capillary (CA4+) to vein (ACKR1+). d, Top, UMAP of male germ cells (L4 testis, 10x) corresponding to the spermatogenesis trajectory from stem cells (spermatogonia, 250) to late spermatids (256). Bottom, heatmap showing the relative expression of spermatogenesis markers along the trajectory (spermatogonium panel enlarged for resolution). e, Top left, UMAP of myeloid cells (L2 bone, bone marrow, 10x) corresponding to two haematopoiesis trajectories. One begins with haematopoietic precursor cells (169) and bifurcates at granulocyte–monocyte progenitors (181) into the neutrophil lineage (175–176) and the monocyte–macrophage lineage (182–184 and 187). The other connects erythroid progenitor and lineage cells (172–174) with a fraction of megakaryocyte progenitors nearby (170). Top right and bottom, heatmaps showing the relative expression of haematopoiesis markers along trajectories (neutrophils uniformly subsampled). Symbols in brackets indicate the description of genes identified by NCBI as loci: [DMC1], LOC105858542; [HSPA1L], LOC105858168; [CD14], LOC105862649; [HBB], LOC105883507; and [HBA2], LOC105856254. See also Extended Data Fig. 2. Source Data
Fig. 3
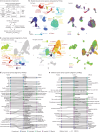
Fig. 3. Previously unknown and understudied molecular cell types.
af, Cell-type dendrogram (a), UMAPs (b,e) and gene expression dot plots (c,d,f) of examples of previously unknown molecular types identified in the atlas, including two hepatocyte types (b,c), FABP5+RBP7+ capillary cells (d) and an unknown kidney stromal cell (designation 143; unknown ST6GAL2+), which may be mesangial cells (e,f). In a, asterisks indicate cell types profiled in only one individual. Labels in parentheses indicate the tissue abbreviation for molecular types found in ≤3 tissues. Dot plots (c,d,f) show mean expression (ln(UMIg/UMItotal × 1 × 104 + 1), abbreviated as ln(UP10K + 1) in dot heatmaps) and the percentage of cells expressing (dot size) the indicated cell-type markers and selected DEGs. In d, note that FABP5+RBP7+ capillary cells seem to be specialized for energy storage because they were found in high-energy-demand tissues (for example, heart, limb muscle and kidney) and enriched in genes for fatty acid uptake and binding (for example, RBP7, FABP1 and FABP5), as well as the transcription factors MEOX2 and TCF15, as in humans and mice,. Note also DEGs distinguishing FABP5RBP7 capillary cells from the CNS (cortex, brainstem and pituitary) versus peripheral tissues (blood, lung and kidney), which indicates tissue specialization of capillaries. Cell types are indicated by tissue and designation number. Bla, Bladder; Blo, blood; Bon, bone; BM, bone marrow; Cap, capillary; Col, colon; Cor, brain cortex; Hep, hepatocyte; Pit, pituitary; Kid, kidney; Liv, liver; Lun, lung; MG, mammary gland; Pan, pancreas; SI, small intestine; Ski, skin; Spl, spleen; Ste, brainstem; Ton, tongue; Tra, trachea; Ute, uterus. Symbols in brackets indicate the description of genes identified by NCBI as loci: [HP], LOC105859005; [FABP4-like], LOC105857591; and [CD36], LOC105879342. See also Extended Data Figs. 3–4 and Supplementary Fig. 3. Source Data
Fig. 4
Fig. 4. Relationships of molecular cell types across the lemur atlas.
a, UMAP of molecular cell types (dots) in the atlas based on their mean transcriptomic profiles (L1–L4, 10x). Dot fill colour, tissue compartment; black or grey outline, progenitor or proliferating cell types, respectively. Dashed contours, biologically related cell types. Arrow and arrowhead, unexpected molecular convergence highlighted in b–d; boxed regions are shown in e and f. bd, UMAPs as in a showing relative expression level heatmaps of the indicated DEGs for the following comparisons: immune progenitor and proliferating cells and germ cells versus cell types in other compartments (b; additional genes in Extended Data Fig. 5j); immune progenitor and proliferating cells and germ cells versus proliferating cells in other compartments (c; additional genes in Extended Data Fig. 5j); and Schwann and stromal cells versus non-Schwann cell types in the neural compartment (d; additional DEGs include SOCS3, COL1A2, COL5A2, ID3, ID1, CDC42EP5, MMP2, TGFBR2, CCN1 and TBX3). e,f, Close-up of the boxed regions in a showing segregation of two types of lymphatic cell independent of tissue of origin (e), versus tissue-specific segregation of skin and tongue epithelial cell types despite their relatively similar functions in both tissues (for example, basal cells) (f). Source Data
Fig. 5
Fig. 5. Evolutionary comparison of cell types and gene expression patterns.
a, Bar plot showing the lemur-over-mouse advantage for modelling the human cell-type transcriptome for 63 cell types. Δrc = rcHL – rcHM, with rc (transcriptomic correlation coefficient, one-to-one-to-one orthologous genes), rcHL (human-to-lemur), rcHM (human-to-mouse). P < 0.05, asterisks indicate right-tailed t-test, diamonds indicate left-tailed t-tests (exact values are provided in the source data). Error bar, 95% confidence interval. b,c, Species-integrated UMAP (coloured by species) of spermatogenesis (b; black curve, maturation trajectory; contours, related cell types) and transcriptomic correlation coefficients to the human profile (c; yellow, human–macaque (rcHMa); red, human–lemur (rcHL); blue, human–mouse (rcHM)). Error bar, 95% confidence interval. Human–macaque similarity may be overestimated because transcriptomic data are from the same study using drop-seq, whereas lemur (this study) and mouse data are from independent studies using the 10x method. d,e, Species-integrated UMAP (d) and cell correlation coefficients (e) as in b,c but for haematopoiesis trajectories (bone marrow and spleen immune cells). Neutrophil trajectory (e), other immune lineages (Extended Data Fig. 8e,f). fh, Comparison (correlation coefficients, rg, one-to-one orthologous genes) of gene expression patterns across 63 cell types (a) between human–lemur (rgHL) versus human–mouse (rgHM), shown as a scatter plot (f), bar plot (g) and boxplot (h). f, Grey dots, orthologous genes; green and red dots, highlighted highly conserved (green, rgHL and rgHM > 0.8) and human–lemur conserved (red) genes. Contours, probability density. Dashed lines, black, rgHL = rgHM; red, Δrg,(rgHL – rgHM) threshold (Δrg > 0.4) for designated human–lemur-conserved and mouse–divergent genes (HL genes); blue, threshold (Δrg < −0.4) for designated human–mouse-conserved and lemur-divergent genes (HM genes)). g, Quantification of HL and HM genes. h, Comparison of rgHL and rgHM distributions. Median (central line), 25th (bottom) and 75th (top) percentiles; dashed line, rgHL median. n = 7,787. ***P = 3 × 10–76 (paired two-tailed t-test). i, Dot plots showing expression of example genes with highly conserved (top) and HL-conserved (bottom) patterns for the 63 cell types in a. Rows, orthologous genes (human symbol). Columns, cell-type expression displayed as human–lemur–mouse trios. Note different patterns of evolutionary expression rewiring among HL genes: (1) simple gain or loss of expression in primates versus mouse; (2) conserved expression in some cell types but expression expansion or contraction in other cell types in primates; (3) expression switches from one or more mouse cell types to different cell type (or types) in primates; and (4) complex expression rewiring (combinations of above). j,k, Scatter plots of expression along spermatogenesis (j) and neutrophil (k) trajectories of genes with highly conserved (SPACA1 and YPEL3); primate-conserved and mouse-divergent (KTN1 and OSCAR, mice lack expression; PRSS55 and MMP8, mouse heterochronic expression), and lemur-specific (YPEL2) patterns. Points, individual cells, coloured by species; curves, moving average of expression along trajectory. B/S, bone marrow/spleen; EP, erythroid progenitor; Lu, lung; MGP, megakaryocyte progenitor; Mu, skeletal muscle; MuSC, skeletal muscle stem cell; SC, spermatocyte; SG, spermatogonium; ST, spermatid; VSM, vascular smooth muscle. See also Extended Data Figs. 6–10 and Supplementary Fig. 4. Source Data
Extended Data Fig. 1
Extended Data Fig. 1. Taxonomy of identified mouse lemur molecular cell types.
a. Scheme for multi-step scRNA-seq dataset integration, iterative cell clustering of cells with related transcriptomic profiles, and cell type annotation. b. Example tissue UMAP showing scRNA-seq profiles of all cells (dots) from an organ (kidney), integrated using FIRM algorithm across 10x and SS2 datasets (top left) and three individuals (top right). Compartment identities of the cell clusters are shown (bottom left) along with heat maps of expression levels (ln(UP10K+1) for 10x data, ln(CP10K+1) for SS2 data) of the indicated compartment marker genes (bottom right; EPCAM, epithelial; PTPRC, immune lymphoid/myeloid; PECAM, endothelial; COL1A1, stromal). c. UMAP of all 244,081 cells in the atlas integrated by FIRM across the 27 tissues analyzed from four individuals. d. Dot plot showing number of profiled cells (dot intensity shown by heat map scale, central red dot indicates <10 cells) for each of the 768 identified molecular cell types (including 38 hybrid types) plus 24 mixed clusters, isolated from the tissues indicated at left. Molecular cell types in each tissue (rows) are arranged (columns) by cell type designation number and separated by compartment as in Fig. 1e. Horizontal bars, closely related molecular types. +, unknown molecular type.
Extended Data Fig. 2
Extended Data Fig. 2. Heatmaps of DEGs along molecular gradients and UMAPs of cell trajectories for additional individuals.
a-d. Heat maps showing relative expression of top DEGs along each trajectory in Fig. 2. Expression is normalized to the maximal value (99.5 percentile) for each gene across all cells in the trajectory. Genes shown are top three DEGs from each of the detected trajectory-dependent expression patterns described in Methods. Cells are ordered left to right by their trajectory coordinates (Ncells), and their cell type designations are indicated by colors in top bar (as in UMAPs of Fig. 2). e. (Top) UMAP of kidney epithelial cells as in Fig. 2b color-coded by molecular trajectory coordinates calculated using algorithm Slingshot algorithm. (Bottom) Comparison of cell trajectory coordinates assigned by two independent methods: Method 1, in-house algorithm, and Method 2, Slingshot. Red dashed line, values for perfect 1-1 correlation. f-k. UMAPs and detected molecular trajectories of cells from the indicated tissues and compartments as in Fig. 2, but from other lemurs as indicated at bottom left of each UMAP. “thin D, thin descending; thin A, thin ascending; thick A, thick ascending”. [], description of genes identified by NCBI as a loci: [BEX1], LOC105884179; [CCSAP], LOC105877478; [DCUN1D1], LOC105862715; [DEFA1], LOC105881500; [FCGR1A], LOC105865511; [GSTP1], LOC105867419; [HBA1], LOC105856255; [HBB], LOC105883507; [HP], LOC105859005; [HLA-DRB1-1], LOC105872012; [HRNR], LOC105859819; [IFITM3], LOC105874071; [LRRC9], LOC105882927; [NAT8B], LOC105884612; [PTMA], LOC105880511; [SERPINB3], LOC105883741; [SERPINB3], LOC105876721; [TMEM45A], LOC105859377; [TMEM14C], LOC105865212; [RGCC], LOC105871594; [RDH7], LOC105865610; [RDH16], LOC105865617; [RNASE2], LOC105864771; [uncharacterized 1], LOC105876678; [uncharacterized 2], LOC105873147; [uncharacterized 3], LOC105862290; [uncharacterized 4], LOC105858108; [uncharacterized 5], LOC105880776; [uncharacterized 6], LOC105881161; [uncharacterized 7], LOC105871650. Source Data
Extended Data Fig. 3
Extended Data Fig. 3. Hepatocyte molecular subtypes across human, lemur, and mouse.
a. UMAP of liver hepatocytes and cholangiocytes, separately for human (left), lemur (middle), and mouse (right). Top to bottom: cells colored by cell type annotation, by sex of the animal, and by heatmap showing relative expression of a hepatocyte marker (ASGR1), a cholangiocyte marker (SPP1), and a hepatocyte subtype DEG (CPN2). Note that in the lemur atlas CPN2hi and CPN2low hepatocytes are given the designations hepatocyte (APOB+) and hepatocyte (PHYH+), respectively. b. Species-integrated UMAP of liver hepatocytes and cholangiocytes, with cells colored by cell type annotation (top) and species (bottom). c. Box and whisker plots of the number of genes (top) and UMIs (bottom) detected per cell for each cell type indicated. H, Human; L, lemur; M, mouse. d. Dot plot comparing mean expression (ln(UP10K+1), dot heamap) and percent of cells (dot size) expressing indicated genes in the two hepatocyte molecular subtypes and cholangiocytes across human, lemur and mouse. Genes shown are (top to bottom): one-to-one orthologues of hepatocyte and cholangiocyte markers, DEGs between the two hepatocyte subtypes, liver zonation markers, and cell stress markers including immediate-early genes and heat shock proteins (labeled with the respective human gene symbol). Note that in all three species, hepatocyte molecular subtypes do not differ significantly in expression of zonation markers or cell stress markers. Source Data
Extended Data Fig. 4
Extended Data Fig. 4. UMAP and differential expressed genes of previously unknown cell types.
UMAPs (a, c) of indicated tissue compartments (integrated across individuals by FIRM, colored by molecular cell types) with unknown molecular type(s) highlighted (dashed circles), and corresponding dot plots (b, d) of mean expression (ln(UP10K + 1), dot heatmap; percent of cells expressing, dot size) of selected compartment and cell type marker genes as well as DEGs in the unknown cell type (dashed box) vs. other cell types in the dot plot. Cell types in dot plots are indicated by tissue_cell type designation number (for example, Bon_95) and compartment is indicated by color of bar beneath it. a,b. Bone stromal and neural cells (L2 and L4, 10x) with unknown stromal cell type (NGFR+TNNT2+, #141). c,d. Tongue stromal and neural cells (L2 and L4, 10x) with unknown stromal cell types (NGFR+TNNT2+, #141) and (COL15A1+PTGDS+, #142). e. Combined dot plot as above (b,d) showing expression of indicated marker genes and DEGs in the unknown stromal populations above (#141, #142) and the related unknown stromal population (NGFR+TNNT2+, #141) present in mammary gland and pancreas. Also plotted are cardiomyocytes, mesothelial, leptomeningeal, and Schwann cells from all tissues (L1-L4, 10x), which express high levels of the DEGs of #141 and 142. See also Supplementary Fig. 3. Source Data
Extended Data Fig. 5
Extended Data Fig. 5. Relationships of molecular cell types within and across compartments in human, lemur, and mouse.
a. Cell type UMAP as in Fig. 4a overlaid with relative expression level (as heat maps) of example tissue compartment markers indicated. b,c. Close up of portions of UMAP in Fig. 4a showing segregation of two types of adipocytes (b) and three types of neutrophils (c) independent of their tissue of origin. d. Heat maps of pairwise Pearson’s correlation coefficients between the transcriptomic profiles of each of the 749 molecular cell types in atlas (10x and SS2 datasets, excluding cardiac cells), calculated from principal component values of FIRM-integrated UMAP (Extended Data Fig. 1c) averaged across all cells of each type. Cell types ordered by compartment, then cell type designation/number, and then tissue. An interactive version of this map is available at https://tabula-microcebus.ds.czbiohub.org/heatmaps. e. Close up of heat map from panel d showing pairwise correlations between skin epithelial cells and all other cell types (top), and between testis germ cells and all other cell types (bottom). Note proliferating skin interfollicular suprabasal cells show high correlation with other proliferating and progenitor cell types across all compartments in atlas. Spermatogonia also show high correlation with proliferating cell types in the atlas, and especially with hematopoietic progenitor cells. f-h. UMAPs of the 63 orthologous cell types (see evolutionary comparisons) clustered separately for human (f), lemur (g), and mouse (h). Dot color, cell types compartment. Note the close clustering of germline progenitors with immune progenitors, as shown for lemur in Fig. 4a, is consistent across all three species. i. Violin plot showing distribution of transcriptomic distances between pairs of cell types (see Methods) within the same compartment and across different compartments for the 63 orthologous cell types, separated by species. j. Dot plot showing mean expression across the 63 human, lemur and mouse orthologous cell types of DEGs detected by comparing the lemur immune progenitor/proliferating cells and germ cells vs. cell types in other compartments [1], or vs. proliferating cells in other compartments [2], as in Fig. 4b,c. Figure format as in Fig. 5i. See also Supplementary Fig. 4. Source Data
Extended Data Fig. 6
Extended Data Fig. 6. Molecular relationships of lung and skeletal muscle cell types across species.
a. Overview of methodology for evolutionary cell type and gene comparison analysis using the indicated datasets. HLCA, Human lung cell atlas. b,c. UMAPs of skeletal muscle (b) and lung (c) cells integrated across species by Portal based on the one-to-one gene orthologues, colored by cell type (b, left; c, non-immune cell types on left and immune in middle) and by species (b and c, right). d,e. Sankey plots showing the molecular relationship between human, lemur, and mouse cell types for lung (d) and skeletal muscle (e) as determined by SAMap algorithm (see Methods). Each cell type in lemur is connected (gray line) to the cell type(s) it maps to in human and mouse datasets; line thickness indicates molecular similarity score (0-1) between connected cell types. A cell type with no connecting lines indicates it did not map with similarity score > 0.1 to any cell type in the other species. Note that cell types of the same designation show higher similarity scores across species compared to with other cell types.
Extended Data Fig. 7
Extended Data Fig. 7. Evolutionary comparisons of spermatogenesis.
a,b. UMAPs of male germ cells integrated across species as in Fig. 5b with cells colored by cell type/developmental stage (a) and pseudotime along the spermatogenesis trajectory (b). c,d. Dot plot showing mean expression along spermatogenesis trajectory for known spermatogenesis markers genes (c) and evolutionary conserved/divergent genes (d: top, all species-conserved; middle, primate-conserved and mouse divergent; bottom, lemur-specific). Rows are orthologous genes (indicated by the human gene symbol). Columns are cell types along trajectory, displayed as groups of four dots showing respective expression in the corresponding cell type of human, macaque, lemur, and mouse. Source Data
Extended Data Fig. 8
Extended Data Fig. 8. Evolutionary comparisons of hematopoiesis.
a-d. UMAP of bone marrow and spleen immune cells integrated across species as in Fig. 5d, with cells colored by cell type (a) and pseudotime along the hematopoietic trajectories (b, neutrophil; c, monocyte/macrophage; d, erythroid). e,f. Correlation coefficients of human progenitor and mature immune cell transcriptomic profiles to those of lemur (rcHL) and mouse (rcHM) as shown in Fig. 5e but for monocyte/macrophage (e) and erythroid (f) trajectories. Note that rcHL is almost always greater than rcHM throughout the trajectories with the exception of the end of the monocyte/macrophage trajectory, likely confounded by different fractions of macrophages in each dataset. g-j. Dot plot showing mean expression along neutrophil (g, j), monocyte/macrophage (h), and erythroid (i) trajectories, for known markers genes (g-i) and evolutionary conserved/divergent genes (j: top, all species conserved; bottom, primate-conserved and mouse divergent). Rows are orthologous genes, indicated by their human gene symbols. Columns are cell types, displayed as trios of dots showing expression in the corresponding human, lemur, and mouse cell type. Source Data
Extended Data Fig. 9
Extended Data Fig. 9. Evolutionary comparison of lung cell types across human, lemur, mouse, and macaque.
a. Bar plots comparing differences (Δrc) between human-to-macaque (rcHMa), human-to-lemur (rcHL) and human-to-mouse (rcHM) transcriptomic correlation coefficients (top to bottom: ΔrcMa-L = rcHMa-rcHL, ΔrcL-M = rcHL-rcHM, ΔrcMa-M = rcHMa-rcHM)) for each of the 18 orthologous lung cell types indicated. p < 0.05, * (right-tailed t-test), ◊(left-tailed). Bottom panel, correlation coefficient between each species. b. Dot plot showing mean expression of genes highly-conserved between human, lemur, and mouse (as in Fig. 5i and Supplementary Fig. 4a) in the 18 orthologous lung cell types across human, macaque, lemur, and mouse. Genes without an orthologue in macaque were excluded. Note that macaque cell types generally showed similar expression patterns to cognate cell types in the other three species, but with exceptions (notable examples indicated by arrowheads). Format as in Fig. 5i. Source Data
Extended Data Fig. 10
Extended Data Fig. 10. Evolutionary comparison of gene expression and sequence conservation.
a. Expanded version of Fig. 5a including (bottom panel) comparison of transcriptomic correlation coefficient score between human and lemur (rcHL) and between human and mouse (rcHM) for each of 63 orthologous cell types. b. Bar graph quantifying the number of cell types in panel a that are more similar between human and lemur compared to human and mouse (Δrc > 0, where Δrc = rcHL-rcHM) and vice versa). c-e. Scatter plots comparing gene expression conservation patterns (correlation coefficients) between human and lemur (rgHL), human and mouse (rgHM), and lemur and mouse (rgLM) for each one-to-one orthologous gene, formatted as Fig. 5f and dot colors as in legend. Expression of the highlighted genes are shown in Fig. 5i and Supplementary Fig. 4. f. Ratio of HL, HM, and LM conserved genes detected at different Δrg thresholds. The number of HL and LM genes were consistently higher than (more than doubling) that of HM genes, whereas the number of HL and LM genes were more comparable, supporting the lemur as genetic intermediate between human and mouse. g,h. Scatter plots comparing gene expression conservation (rg) vs. gene sequence identity (I) between HL and HM one-to-one orthologues (g) and HL-HM differences in expression conservation (Δrg) vs. gene sequence identity (ΔI) (h). Note the lack of positive correlation between measurements (Pearson’s r in g = −0.14 and in h = 0.002). Source Data

References

    1. Ezran, C. et al. Mouse lemur cell atlas informs primate genes, physiology and disease. Nature10.1038/s41586-025-09114-8 (2025). - PMC - PubMed
    1. Mestas, J. & Hughes, C. C. Of mice and not men: differences between mouse and human immunology. J. Immunol.172, 2731–2738 (2004). - PubMed
    1. Watase, K. & Zoghbi, H. Y. Modelling brain diseases in mice: the challenges of design and analysis. Nat. Rev. Genet.4, 296–307 (2003). - PubMed
    1. IUCN. IUCN Red List of Threatened Species. IUCNhttps://www.iucnredlist.org/en (2022).
    1. Ezran, C. et al. The mouse lemur, a genetic model organism for primate biology, behavior, and health. Genetics206, 651–664 (2017). - PMC - PubMed

LinkOut - more resources