. 2025 Sep;645(8080):507-517.
doi: 10.1038/s41586-025-09297-0. Epub 2025 Jul 30.

ACLY inhibition promotes tumour immunity and suppresses liver cancer

Affiliations

ACLY inhibition promotes tumour immunity and suppresses liver cancer

Jaya Gautam et al. Nature. 2025 Sep.

Abstract

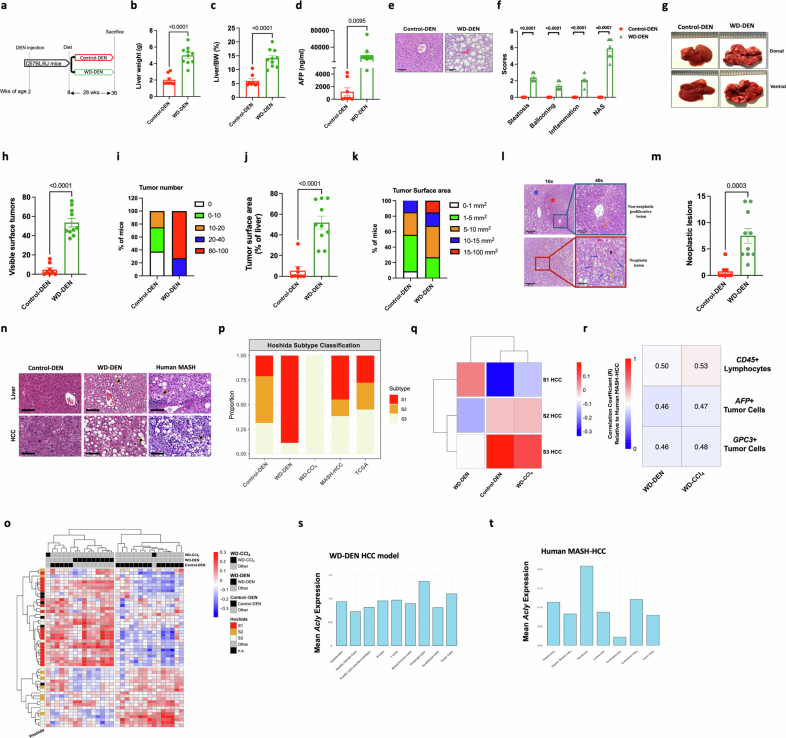
Immunosuppressive tumour microenvironments are common in cancers such as metabolic dysfunction-associated steatohepatitis (MASH)-driven hepatocellular carcinoma (HCC) (MASH-HCC)1-3. Although immune cell metabolism influences effector function, the effect of tumour metabolism on immunogenicity is less understood4. ATP citrate lyase (ACLY) links substrate availability and mitochondrial metabolism with lipid biosynthesis and gene regulation5-7. Although ACLY inhibition shows antiproliferative effects in various tumours, clinical translation has been limited by challenges in inhibitor development and compensatory metabolic pathways8-12. Here, using a mouse model of MASH-HCC that mirrors human disease, genetic inhibition of ACLY in hepatocytes and tumours reduced neoplastic lesions by over 70%. To evaluate the therapeutic potential of this pathway, a novel small-molecule ACLY inhibitor, EVT0185 (6-[4-(5-carboxy-5-methyl-hexyl)-phenyl]-2,2-dimethylhexanoic acid), was identified via phenotypic screening. EVT0185 is converted to a CoA thioester in the liver by SLC27A2 and structural analysis by cryo-electron microscopy reveals that EVT0185-CoA directly interacts with the CoA-binding site of ACLY. Oral delivery of EVT0185 in three mouse models of MASH-HCC dramatically reduces tumour burden as monotherapy and enhances efficacy of current standards of care including tyrosine kinase inhibitors and immunotherapies. Transcriptomic and spatial profiling in mice and humans linked reduced tumour ACLY with increases in the chemokine CXCL13, tumour-infiltrating B cells and tertiary lymphoid structures. The depletion of B cells blocked the antitumour effects of ACLY inhibition. Together, these findings illustrate how targeting tumour metabolism can rewire immune function and suppress cancer progression in MASH-HCC.


Conflict of interest statement

Competing interests: G.R.S., R.S.N., S.H., D.C.O., Y.H., J.S.V.L. and J.G. are shareholders of Espervita Therapeutics. The laboratories of S.L.F., K.V. and G.R.S. received funding from Espervita Therapeutics. The other authors declare no competing interests.

Figures

Fig. 1
Fig. 1. Genetic inhibition of Acly reduces tumour burden in a mouse model of MASH-HCC.
a, Experimental scheme of the Acly-KO model. TN, thermoneutral. b, Representative images of ACLY protein expression in WT and hepatocyte-specific Acly-KO liver and tumours. c,d, The H-score of ACLY protein expression in tumour (c) and tumour-adjacent liver (d). Data are presented as mean ± s.e.m. n = 5 Acly-KO versus n = 5 WT livers. P values were determined by two-tailed, unpaired Student’s t-test: P = 3.54 × 10−5 (c) and P = 1.23 × 10−6 (d). e, Representative Acly-KO mouse liver stained with ACLY antibody. The asterisk indicates inflammatory cell aggregation-positive ACLY staining; the blue arrows denote mesenchymal cell (endothelial or Kupffer cells)-positive ACLY staining; and the orange arrows show hepatocyte-negative ACLY staining. f, Representative dorsal and ventral images of WT and Acly-KO liver with tumours. g, Visible number of tumours on the liver surface. Data are presented as mean ± s.e.m. n = 11 WT and n = 11 Acly-KO mice. P values were determined by unpaired, two-tailed Student’s t-test. h, Percentage distribution graph of tumour numbers from livers of WT (n = 11) and Acly-KO (n = 11) mice. i, Number of neoplastic lesions in livers from WT (n = 11) and Acly-KO (n = 11) mice. Data are presented as mean ± s.e.m. P values by unpaired, two-tailed Student’s t-test. j, Representative images of neoplastic lesions from the livers of WT and Acly-KO mice. k, Representative images showing tumour with lipid (left) and calculation of the percentage lipid area of WT (n = 5) and Acly-KO (n = 5) livers (right). Scale bars, 600 µm. Data are presented as mean ± s.e.m. P values were determined by unpaired, two-tailed Student’s t-test. l, Fatty acids (FAs) in tumours from WT (n = 11) and Acly-KO (n = 10) mice. C:D, the total number of carbon atoms to the number of carbon–carbon double bonds. Data are presented as mean ± s.e.m. P values were determined by unpaired, two-tailed Student’s t-test. Source data
Fig. 2
Fig. 2. Identification of EVT0185, a novel dicarboxylic acid prodrug, that is converted to a CoA thioester and inhibits ACLY through CoA binding.
a, 14C-acetate incorporation into fatty acids and cholesterol in mouse primary hepatocytes treated with varying doses of EVT0185 (0.1 and 0.5 µM (n = 4 samples per group), 0.3, 1 and 3 µM (n = 10 samples per group), and 10, 30 and 100 µM (n = 6 samples per group)). Data are presented as mean ± s.e.m. b, Effect of EVT0185 and EVT0185-CoA on ACLY activity. Data are presented as mean ± s.e.m. Inhibition of ACLY activity by EVT0185 (n = 3 samples) and EVT0185-CoA (n = 3 samples). c,d, Michaelis–Menten (c) and Lineweaver–Burk (d) plots for ACLY with EVT0185-CoA at three distinct concentrations. Data are presented as mean ± s.e.m. n = 3 independent experiments. e, Domain architecture of ACLY. f, 2D cryo-EM class averages for the ACLY–(R,S)-EVT0185-CoA complex. ess, effective sample size; ptcls, particles. g, Cryo-EM reconstruction without symmetry applied. The sharpened map is contoured at 8.74σ (absolute level of 0.176) and coloured by the different structural domains as in panel e. The red dashed line indicates the region used for local refinement. h,i, Sharpened cryo-EM map contoured at 9.94σ (h; absolute level of 0.12) and real space refinement atomic model (i) following local refinement after symmetry expansion and 3D classification. j, Adenosine 3′-phosphate 5′-diphosphate moiety of EVT0185-CoA modelled in the sharpened cryo-EM map at the CoA-binding pocket located at the interface between the CCS and CSH modules of ACLY. The map is carved around the ligand with a carve radius of 2 Å. The interacting residues of ACLY are labelled. The disordered pantothenyl arm is tentatively indicated. Source data
Fig. 3
Fig. 3. Oral delivery of the ACLY inhibitor EVT0185 reduces tumour burden in distinct mouse models of MASH-HCC.
a, Representative images of livers isolated from mice WD-DEN for 8 months, then treated with vehicle, EVT0185 (30 or 100 mg kg−1) or bempedoic acid (BA-100 mg kg−1) for 1 month. b, Quantification of visible surface tumours from livers of mice treated with vehicle (n = 12), EVT0185 (30 or 100 mg kg−1; n = 12) or bempedoic acid (BA-100 mg kg−1; n = 4). Data are mean ± s.e.m. P values were determined by one-way analysis of variance (ANOVA) with Fisher’s least significant difference (LSD). c, Representative images of livers isolated from WD-CCl4 mice (12 weeks) treated with vehicle or EVT0185 (100 mg kg−1) for 18 weeks. d, Visible surface tumours on livers. Data are mean ± s.e.m. n = 10 mice per group for vehicle or EVT0185 (100 mg kg−1). P value was determined by an unpaired, two-tailed Student’s t-test. e, Percent distribution of tumour numbers per group. f, Representative images of livers isolated from mice maintained on WD for 18 months and treated with vehicle or EVT0185 (100 mg kg−1) for 4 weeks. g, Visible number of surface tumours. Data are mean ± s.e.m. n = 5 mice per group. P value was determined by unpaired, two-tailed Student’s t-test. h, Representative images of livers isolated from WD-CCl4 mice treated with vehicle, EVT0185 (50 or 100 mg kg−1), sorafenib (Sora; 15 mg kg−1), lenvatinib (Lenva; 7 mg kg−1), EVT0185 + sorafenib or EVT0185 + lenvatinib for 6 weeks. i, Tumour counts in the liver. Data are mean ± s.e.m. n = 12 mice in the treatment groups and n = 10 mice in the vehicle group. P values were determined by one-way ANOVA with Fisher’s LSD: P = 4.20 × 10−5 (EVT0185 + sorafenib versus vehicle) and P = 3 × 10−5 (EVT0185 + lenvatinib versus vehicle). j, Percent distribution of tumour numbers. k, Representative images of livers isolated from WD-CCl4 mice treated with isotype control or PDL1 and VEGFR2 antibody (Ab; 200 µg) with or without EVT0185 (100 mg kg−1). l, Visible surface tumours on the livers. Data are mean ± s.e.m. n = 11 isotype control, n = 10 PDL1 + VEGFR2 antibody and n = 11 EVT0185 + PDL1 + VEGFR2 antibody injected mice. P values were determined by one-way ANOVA with Fisher’s LSD. m, Percent distribution of tumour numbers per group. Source data
Fig. 4
Fig. 4. Genetic inhibition of Acly or treatment with EVT0185 in MASH-driven HCC promotes tumour-infiltrating B cells.
a, Volcano plot of bulk RNA-seq of tumours showing upregulated and downregulated genes at early or late timepoints from Acly-KO (n = 12) versus WT (n = 9) mice. Significance was determined by Wald test with a false discovery-adjusted threshold of 5% as implemented in DESeq2. Horizontal dashed lines demarcate the P value threshold at a 5% false discovery rate (FDR). b, Gene Ontology analysis of selected biological processes involving significantly upregulated genes in tumours from Acly-KO (n = 12) versus WT (n = 9) mice. FC, fold change. c, Top 10 Gene Ontology biological processes (GOBP) from clusters identified among significantly upregulated gene sets in tumours from Acly-KO (n = 12) versus WT (n = 9) mice. NES, normalized enrichment score. d, Correlation between B cell populations and Acly expression in tumours from WT (n = 9) and Acly-KO (n = 12) mice. Confidence bands denote the upper and lower bounds of the 95% confidence interval. Significance of association was determined by a two-sided Student’s t-test of regression coefficients and at a false discovery-adjusted threshold of 5%. ep, Spatial transcriptomic analysis of livers from WT and Acly-KO mice and vehicle or EVT0185-treated mice. Cluster analysis representing the number of cell types in the liver and tumour (e,k). Umapharmony integration analysis showing increased B cells in Acly-KO (f) and in EVT0185-treated (l) mice. The top upregulated pathways in HCC cells from Acly-KO (g) and EVT0185-treated (m) mice. Statistical analysis was performed using Fisher’s exact test. Expression level of metabolic genes (h,n). Expression of markers of subtypes of B cells (i,o). The box-and-whisker plots are defined by the median with the first quartile (Q1), third quartile (Q3), minimum (Q1 − 1.5 × interquartile range (IQR)) and maximum (Q3 + 1.5 × IQR). Cxcl13 expression levels in HCC cells (j,p). GC, germinal centre; HSC, hepatic stellate cell; MZ, marginal zone; Tr, regulatory; VSMC, vascular smooth muscle cell.
Fig. 5
Fig. 5. Infiltrating B cells are important for reducing tumour burden in MASH-HCC.
a, t-distributed stochastic neighbour embedding (tSNE) plots showing cell phenotypes in WT and Acly-KO mice. DC, dentritic cell; endo–meso, endothelial–mesothelial; Mac, macrophage. b, Representative tumour images: 2 × 2 mm2 montage (25 fields of view (FOVs)), single 400 × 400 μm FOV, and 100 × 100 μm region of interest (ROI). dsDNA, double-stranded DNA. c,d, B cell (c) and T cell (d) counts at the tumour–liver interface. Data are mean ± s.e.m. n = 4 mice per group. P values were determined by Wilcoxon unpaired, two-sided test. e, Representative image of CD19+ staining (top) and quantification of CD19+ cells per mm2 tumour area in WT (n = 12) and Acly-KO (n = 10) lesions (bottom). Data are mean ± s.e.m. P value was determined by unpaired, two-tailed Student’s t-test. f, Percentage of mice with B cells present or absent in tumour TLSs. g, Pixel images of lymphoid marker levels with cell neighbourhood and phenotype maps overlaid on cell-boundary masks. The tumour interior is marked by a black star. CN1, cellular neighbourhood 1; Hep, hepatocyte; NK cell, natural killer cell. h, Distribution of cells across cellular neighbourhoods. i, CN3 and CN5 (antigen-presenting enriched) represented as ‘antigen-presenting complex’. The box-and-whisker plots show the median as hinge and a box representing the middle 50% of the data, bounded by the lower and upper quartiles. The whiskers extend to data within 1.5 × IQR. P value was determined by Wilcoxon non-parametric unpaired, two-sided test. n = 4 WT and n = 4 Acly-KO tumour border regions. j, Schematic of B cell depletion protocol in the Aclyf/f WD-DEN model. k, Representative liver images. l,m, Tumour count (l) and surface area (m). Data are mean ± s.e.m. n = 12 WT isotype-injected, n = 4 WT anti-CD20-injected, n = 7 Acly-KO isotype-injected and n = 7 Acly-KO anti-CD20-injected mice. P values were determined by one-way ANOVA with Fisher’s LSD: P = 7.51 × 10−5 (Acly-KO isotype versus WT isotype). n, ACLY upregulation in human MASH-HCC (n = 53) relative to non-tumour adjacent tissue (n = 29), MASH liver (n = 74), cirrhotic liver (n = 8) and healthy liver (n = 6). The box-and-whisker plot lines represent the Q1, median and Q3. The whiskers connect the minimum and maximum values. P values were determined by two-tailed Student’s t-test as implemented in limma. o, Hepatocyte-specific ACLY expression in MASH-HCC tumour and adjacent tissues (scRNA-seq). P values were determined by χ2 test of independence. Error bars represent 95% confidence interval. p,q, Correlation of ACLY expression with B cell-specific markers (p), and B cell abundance based on cell-type deconvolution methods (q). Confidence bands denote 95% confidence interval bounds; two-tailed Student’s t-test of regression coefficients (FDR < 0.05). Source data
Extended Data Fig. 1
Extended Data Fig. 1. Feeding DEN-injected mice a high-fat and fructose (Western Diet (WD)) promotes MASH-driven HCC, which mimics human disease pathology.
a, Study design; DEN-injected animals fed Control Chow (Control-DEN) or Western Diet (WD-DEN). b, Liver mass, c, Liver mass/BW, and d, plasma AFP levels; mean ± SEM, WD-DEN (n = 10) vs Control-DEN (n = 8); unpaired two-tailed t-test: P = 3.86 × 10⁻⁶ (b), P = 1.41 × 10⁻⁵ (c). e, Representative H and E-stained liver sections. f, histological scores for steatosis, ballooning degeneration, inflammation, and NAS; mean ± SEM, WD-DEN (n = 10) vs Control-DEN (n = 8); unpaired Mann-Whitney two-tailed test: P = 2.29 × 10⁻⁵. g, Dorsal and ventral liver images. h, Tumor counts; mean ± SEM, WD-DEN (n = 10) vs Control-DEN (n = 8) mice; unpaired two-tailed t-test: P = 9.47 × 10⁻⁸. i, Tumor count distribution and j, tumor surface area; mean ± SEM, WD-DEN (n = 10) vs Control-DEN (n = 8); unpaired two-tailed t-test: P = 2.18 × 10⁻⁵. k, Distribution of tumor surface area per group. l, Histological feature of lesions (blue star: hepatic parenchyma, red star: Non-neoplastic proliferative lesion (FAH), orange arrow: slightly atypical hepatocyte (enlarged nuclei, higher N/C ratio, basophilic cytoplasm), black arrow: mitosis, blue arrows: atypical hepatocytes with enlarged and occasional binucleated nuclei, irregular nuclear membrane, prominent nucleoli and cytoplasmic alterations, red arrow: balloon cells with Mallory Denk bodies, yellow arrow: inflammatory infiltration). m, Number of neoplastic lesions in Control-DEN (n = 8) and WD-DEN (n = 10); mean ± SEM; unpaired two-tailed t-test. n, Representative H and E-stained liver images showing similar macro/microvesicular steatosis in hepatocytes and HCC cells and ballooning (arrowhead) in livers from WD-DEN mice and MASH HCC samples from humans. Scale bar = 100 µm. o, Average pairwise correlation on a per-model basis for mouse samples (column) and per-tissue or tissue molecular subtype basis for human samples (row). p, Proportion of mouse and human tumor tissue classification based on Hoshida molecular subtypes. q, Pairwise Pearson correlation between mouse models (columns) for cell types of interest (rows), using normalized gene expressions for all 1-to-1 orthologous genes between the mouse models (WD-DEN, WD-CCl4) and humans with MASH-HCC. r, Individual sample pairwise mouse to human correlation matrix. s-t, Mean Acly mRNA expression by cell types in livers from WD-DEN mice (s) and human MASH-HCC (t). Source data
Extended Data Fig. 2
Extended Data Fig. 2. Genetic deletion of ACLY does not affect hepatic ballooning, liver steatosis, lobular inflammation, and NAFLD activity score (NAS) but reduces tumor burden.
a, Baseline serum AFP levels prior to AAV injection in WD-DEN treated mice. Data are presented as mean ± SEM. WT (n = 8) and Acly KO (n = 8) mice and statistical comparison was analyzed by two-tailed unpaired t-test. b, Representative diagram of genetic deletion of ACLY using hepatocyte-specific AAV. The diagram was created using BioRender (https://biorender.com). c, Pathological scoring of livers for steatosis, ballooning, inflammation, and NAFLD activity in WT (n = 8) and Acly KO (n = 8) mice. Data are presented as mean ± SEM. Statistical comparison for histological scores was analyzed by an unpaired Mann-Whitney two-tailed test. d, Fatty acid levels in tumor adjacent liver sections from WT and Acly KO mice (FA, Fatty acid; C:D, the total number of carbon atoms to the number of carbon-carbon double bonds). Data are presented as mean ± SEM, Acly KO (n = 10) vs WT (n = 11) mice by unpaired two-tailed t-test. Significant differences observed for FA(18:0): P = 3.7 × 10−5, FA(20:1): P = 5.09 × 10−5, FA(20:2): P = 8.35 × 10−5, FA(22:1): P = 9.46 × 10−7, FA(22:5): P = 4.39 × 10−7 and FA(22:6): P = 1.08 × 10−7. e, Percentage of total liver area covered by tumors. Data are presented as mean ± SEM. WT (n = 5) and Acly KO (n = 5) mice analyzed by unpaired two-tailed t-test. f, Non-neoplastic proliferative lesions in livers from WT (n = 11) and Acly KO (n = 11) mice. Data are presented as mean ± SEM. P-values by unpaired two-tailed t-test. g, Average lipid droplet size in liver tumors from WT and Acly KO mice. Data are presented as mean ± SEM, n = 5/group. Statistical significance within each genotype condition was analyzed by an unpaired two-tailed t-test. Source data
Extended Data Fig. 3
Extended Data Fig. 3. HEK-293 cells expressing SLC27A2 generated the CoA thioester.
a, Overlay of the extracted ion chromatograms for EVT0185 reaction mixture at 0 and 30 min. b, Mass spectrum of EVT0185-CoA at 30-min. c, Fragment ions of EVT0185-CoA at 30-min sample showing the fragment ion 605 m/z produced following the characteristic neutral loss of 3’-phosphonucleoside diphosphate (507 Da). Western blot showing d, Dkk tag expression in empty vector control (pCMV), SLC27A1, SLC27A2, SLC27A4, and SLC27A5 transfected HEK293 cells e, SLC27A2 (ACSVL1) protein expression in non-transfected cells (lane 1), pCMV controls (lanes 2–4) and SLC27A2 (lanes 5–7) transfected cells; β-actin as a loading control. For gel source data, see Supplementary Fig. 1. f, Extracted ion chromatogram from the MS1 and MS2 scans of HEK293 cells transfected with SLC27A2 and treated with 30 µM EVT0185. g, Mass spectrum from the MS1 and MS2 scans which shows the parent ion (1112 m/z) and the neutral loss of 3’-phosphonucleoside diphosphate (507 Da), respectively. h, EVT0185-CoA detected only in extracts from HEK293 cells overexpressing SLC27A2 (ACSVL1); mean ± SEM, n = 6 biologically independent samples/group. i, Proportion of human liver cells expressing SLC27A2 mRNA at different stages of disease progression. j, Human SLC27A2 protein expression in different cell types. k, Flow cytometry gating strategy: lymphocyte population identified via FSC vs. SSC, singlets via FSC-A vs. FSC-H, live cells via FSC vs. e780 viability dye, and CD19+ B cells and CD3+ T cells via CD19 vs. CD3 plot. l, PBMCs stimulated with R848 and IL-2 showing CD19+ B cell proliferation compared to negative control. m, Average proliferation index of R848-induced CD19+ B cells with EVT0185 or vehicle, n = 2 biologically independent PBMC donors. n, PBMCs stimulated with Concanavalin A (Con A) and IL-2 showing CD3+ T cell proliferation compared to negative control. o, Average proliferation index of Con A-induced CD3+ T cells with EVT0185 or vehicle, n = 2 biologically independent PBMC donors. Source data
Extended Data Fig. 4
Extended Data Fig. 4. Competitive assay and cryo-EM analysis of the ACLY:(R, S)-EVT0185-CoA complex.
a, Global fit of Michaelis-Menten Plots by GraFit software for EVT0185-CoA effects on ACLY activity. b, Motion-corrected micrograph with picked particles encircled. The bottom scale bar is 20 nm. c, Cryo-EM data processing workflow in cryoSPARC for the ACLY:(R,S)-EVT0185-CoA complex. d, Sharpened cryo-EM map for ACLY:(R, S)-EVT0185-CoA complex following refinement without symmetry applied illustrating the ligand density at the four CoA-binding binding pockets of ACLY. The density is overlayed with the final real-space refined model molecular model for adenosine 3’-phosphate 5’-diphosphate (shown in Fig. 2i) based on the structural superposition of the CSH domains. e, Segment of the sharpened cryo-EM map following symmetry expansion, 3D classification, and local refinement and carved around residues ACLY residues 1054–1077 (carve radius = 2 Å). f-g, Comparison between the binding modes of (R, S)-EVT0185-CoA (panel f) and CoA bound to human ACLY in pdb 6hxh (panel g).
Extended Data Fig. 5
Extended Data Fig. 5. EVT0185 inhibits key metabolic enzymes involved in the regulation of sterol and fatty acid synthesis.
a, Graphical representation showing metabolic enzymes in the regulation of sterol and fatty acid synthesis. The graphical representation was created using BioRender (https://biorender.com). (b-c), Effect of BA (Bempedoic acid) and EVT0185 on b, lactate and c, acetate incorporation into fatty acids and sterols in WT and Acly KO mouse hepatocytes. Each stacked bar represents the mean ± SEM, % suppression with BA or EVT0185 in WT (n = 3) and Acly KO (n = 3) mice. (d-g) Inhibitory effect of EVT0185-CoA on the activity of d, AMPK; e, ACC1; f, ACC2; and g, ACSS2. Each line graph represents the mean ± SEM, enzyme activity inhibition by EVT0185-CoA (n = 3 samples/group). (h and i) Effect of Bempedoic acid and EVT0185 on clonogenic survival/colony formation in h, Hep3B human, and i, Hepa1-6 mouse HCC cell lines. Each line graph represents the mean ± SEM colony formation in cells treated with EVT0185 or Bempedoic acid (n = 4 biologically independent samples/treatment groups). Source data
Extended Data Fig. 6
Extended Data Fig. 6. EVT0185 decreases RER,14C-glucose incorporation into lipid and tumor burden in mouse liver.
a, Effect of a single dose of EVT0185 on RER (Respiratory Exchange Ratio) in C57BL-6 mice. Each line graph represents the mean ± SEM, P values by unpaired two-tailed t-test, EVT0185 (n = 8) vs. vehicle-treated (n = 9) mice. b, 14C-glucose incorporation into fatty acids and cholesterol in the liver isolated from C57BL-6 mice treated with EVT0185 for 7 days. Each bar represents the mean ± SEM, Vehicle (n = 10), EVT0185-10 (n = 6), 30 (n = 7), and 60 (n = 6) mg/kg-treated mice, one-way ANOVA followed by Tukey’s multiple comparisons. c, Experimental Scheme of WD-DEN HCC model. d, Serum-AFP levels before starting treatment, and e, tumor surface area after treatments. Data as mean ± SEM, Vehicle (n = 12), EVT0185-30 and 100 mg/kg (n = 12) and Bempedoic acid (n = 4)-treated mice; one-way ANOVA with Fisher’s LSD. (f-g) f, Representative images showing tumor lipid droplets (Scale bars are 600 µm) and bar diagram showing percentage area of a lipid and g, average lipid droplet size in tumor, each bar represents the mean ± SEM, n = 6 mice/group, P values by unpaired two-tailed t-test. h, WD-fed mice with elevations in AFP at 18 months before starting treatment. Each bar represents the mean ± SEM, n = 5 mice/group, P values by unpaired two-tailed t-test. i, Sum of tumor diameter per mouse liver. Each bar represents the mean ± SEM, Treatment groups (n = 12) vs. vehicle-treated mice (n = 10), P values by one-way ANOVA followed by Fisher’s LSD multiple comparisons: P = 1.99 × 10⁻⁵ (EVT0185-100 vs. vehicle), P = 1.14 × 10⁻⁵ (EVT0185+Soraf vs. vehicle) and P = 4.57 × 10⁻⁶ (EVT0185+Lenva vs. vehicle). j, Tumor surface area. Each bar represents the mean ± SEM, Isotype control (n = 11), PDL1 + VEGFR2 Ab (n = 10), and EVT0185 + PDL1 + VEGFR2Ab (n = 11) injected mice, P values by one-way ANOVA followed by Fisher’s LSD multiple comparisons. Source data
Extended Data Fig. 7
Extended Data Fig. 7. Transcriptomic profiling of Acly KO tumors vs WT tumors.
a, Experimental scheme. b, No. of visible tumors on the liver surface in mice 4 weeks after adenovirus injection. Data are presented as mean ± SEM, WT (n = 7) vs. Acly KO (n = 7). Statistical analysis was performed using a two-tailed unpaired t-test. c, Differential expression analysis of Acly KO using an additive model adjusting for timepoint. Significance was determined by Wald test with a false discovery adjusted threshold of 5% as implemented in DESeq2. d, Modifying effect of time on Acly KO using an interaction model. Significance of interaction was determined by Wald test with a false discovery adjusted threshold of 5% as implemented in DESeq2. e, Comparison between the number of significant genes in each module negatively associated with both Acly expression and surface tumor burden. f, GSEA of decreased tumor growth size. g, TCA cycle showing a percentage change in tumor citrate and succinate levels in Acly KO mice compared to WT mice. The illustration of the TCA cycle was created using BioRender (https://biorender.com). h, Tumor Suclg1 and Sucla2 mRNA expression. Each bar represents the mean ± SEM, Acly KO (n = 12) vs WT (n = 9) mice, P values by two-tailed unpaired t-test. i, Hierarchical clustering of upregulated biological processes based on semantic similarity. j, Identification of co-expression modules significantly associated with Acly expression and surface tumor burden. k, Gene ontology analysis of co-expressed genes within module blue, Acly KO (n = 12) vs WT (n = 9) mice. Source data
Extended Data Fig. 8
Extended Data Fig. 8. Genetic inhibition of ACLY or treatment with EVT0185 in MASH-driven HCC selectively enhances tumor-infiltrating B cell populations with minimal impact on other immune cells.
a-b, Immune cell markers expressed in different cell types in a, WT and Acly KO and b, Vehicle and EVT0185-treated mice. c, Top upregulated pathways in B cells in Acly KO or EVT0185-treated mice (spatial transcriptomics analysis). Statistical analysis was performed using Fisher’s Exact test. d and e, Single seq analysis of d, WD-DEN and e, WD-CCl4 mouse livers showing top upregulated pathways in B cells. Statistical analysis was performed using a one-sided hypergeometric test (enrichGO); p-values adjusted by Benjamini-Hochberg. f, Cxcl13 mRNA expression analyzed from publicly available RNA-seq dataset in WT and Acly KO DEN tumors cultured in vitro (GSE223966). Boxplot lines represent the first quartile, median, and third quartile. Whiskers connect the minimum and maximum values. Significance was ascertained by an unpaired two-tailed t-test between Acly KO vs WT (n = 4 hepatocellular carcinoma cell lines derived from DEN-induced tumors in Aclyf/f mice).
Extended Data Fig. 9
Extended Data Fig. 9. B cells in the tumor periphery were in close proximity to cells involved in antigen presentation.
a and b, Quantification of lipid droplet area was extrapolated by converting the PLIN-2 signal into a mask and quantifying the area covered by this mask per 400 × 400 micron field of view (FOV). These calculations were performed in ImageJ using custom scripts. Each dot represents a single FOV, Wilcoxon non-parametric unpaired two-sided test. Acly KO (n = 188) vs WT (n = 170) FOVs from n = 4 mice/group. c, CXCL13 protein level in tumors from WT and Acly KO mice; mean ± SEM, n = 5 mice/group; unpaired two-tailed t-test. d, Representative images showing B cells at tumor centre and periphery (Orange star: Tumor front (border-periphery), Black star: Surrounding non-tumoral hepatic tissue). e, B cell aggregations in Acly KO tumor (Orange star: Tumor, Black star: Non-tumoral liver tissue, Blue star: B Cell aggregations). f, Heatmap of cell neighborhoods hierarchically sorted by cell phenotype and showing relative cell abundances. (g-j, l-n) WD-DEN mice treated with Vehicle or EVT0185. g, Representative MIBI images of liver tumors. h, B cell, and i, T cell counts from regions representing the tumor lesion interface with the liver; mean ± SEM, n = 4 mice/group; unpaired Wilcoxon non-parametric unpaired two-sided test. j, CD19+ positive cells count/mm2 tumor area; mean ± SEM, Vehicle (n = 29) and EVT0185 (n = 21) lesions; unpaired two-tailed t-test. k, CD3+ positive cells count/mm2 tumor area; mean ± SEM, WT (n = 12) and Acly KO (n = 10) lesions; unpaired two-tailed t-test. l, CD3+ positive cells count/mm2 tumor area; mean ± SEM, Vehicle (n = 29) and EVT0185 (n = 21) lesions; unpaired two-tailed t-test. m, Percentage of mice with/without B cells in TLS. n, TLS in EVT-treated mouse compared with vehicle control. o, GO enrichment analysis showing upregulated pathways related to complement activation in B cells in the EVT0185-treated group relative to Vehicle. Statistical analysis was performed using one-sided hypergeometric test (enrichGO); p-values adjusted by Benjamini-Hochberg. Source data
Extended Data Fig. 10
Extended Data Fig. 10. Reduction in tumor burden due to ACLY inhibition is mediated by the induction of an immunogenic response.
a-c, a, Representative images with percentage area fluorescence level of b, CCP3; mean ± SEM, Acly KO (n = 11) vs WT (n = 13) tumors by unpaired two-tailed t-test, and c, Ki67 protein expression in tumor leading edge; mean ± SEM, Acly KO (n = 12) vs WT (n = 15) tumors by unpaired two-tailed t-test: P = 8.74 × 10⁻⁸. d-f, d, Representative images and percentage area fluorescence level of e, CCP3 (P = 1.34 × 10⁻⁸) and f, Ki67 (P = 1.27 × 10⁻⁶) protein expression in the tumor leading edge. Data are presented as mean ± SEM. EVT0185 vs Vehicle control by unpaired two-tailed t-test, (n = 18 tumors per group). g, DOX inducible shRNA suppresses ACLY expression and phosphorylation in Hep3B cells. For gel source data, see Supplementary Fig. 1. (h-j) Inducible knockdown led to h, reduced [14C] glucose-mediated DNL and i, increased [3H] acetate mediated DNL in Hep3B cells and j, increased fatty acid oxidation based on the sampling of [14C] incorporation in gaseous carbon dioxide obtained from cell culture media. Data are presented as mean ± SEM. Number of cell culture replicates per condition were WT (n = 3), shNTC (n = 3), shACLY #1 (n = 3), and shACLY #2 (n = 3). Significance was determined by an unpaired one-tailed t-test. k, Outline of in vivo orthotopic experiment. The illustration of the mouse was created using BioRender (https://biorender.com). l, Bioluminescence at 6 weeks was not significantly different between control and ACLY-deficient tumor. Each bar represents the mean ± SEM. Number of mice per condition at the time of sacrifice were shNTC -Dox (n = 3), shNTC +Dox (n = 5), shACLY -Dox (n = 7), shACLY +Dox (n = 9). Significance was determined by unpaired one-tailed t-test. Source data
Extended Data Fig. 11
Extended Data Fig. 11. Confirmation of B cell depletion.
a, Gating strategy to identify B220+CD19+ cells in Isotype control, and Anti-CD20 injected WT and Acly KO mice. Briefly, cells were gated as follows: SSC vs FSC plot of lymphocytes population, FSC-H vs FSC-A to identify single cell population, FSC vs 7-AAD to identify live cells population, B220 vs CD19 to identify B220+CD19+ B cell population. b. B220+CD19+ cells in Iso (Isotype control) and Anti-CD20 (B cell-depleted)-injected WT or Acly KO mice. Data are presented as mean ± SEM, Significant reductions were observed in WT-Anti-CD20 (n = 4; P = 2.37 × 10⁻⁶) and in Acly KO-Anti-CD20 (n = 7; P = 9.76 × 10⁻⁸), compared to WT-Isotype control (n = 11)-injected mice. The Acly KO-Isotype control group included n = 8 mice. Statistical analysis was performed using one-way ANOVA followed by Fisher’s LSD test. Source data
Extended Data Fig. 12
Extended Data Fig. 12. Differential expression analysis in human MASH-HCC.
a, Differential expression analysis comparing MASH-HCC (n = 53) and non-tumor adjacent liver (n = 29), MASH liver (n = 74), cirrhotic liver (n = 8), and healthy liver tissue (n = 6); two-tailed t-test; 5% FDR as implemented in limma. b, Overlap between significantly upregulated and downregulated genes in each pairwise comparison. c, Gene expression of lipogenic enzymes acetyl-CoA carboxylase (ACACA or ACACB), ACSS2, and FASN across disease states (MASH-HCC, n = 53; non-tumor adjacent, n = 29; MASH liver, n = 74; cirrhotic liver, n = 8; healthy liver, n = 6). Boxplot lines represent the first quartile, median, and third quartile. Whiskers connect the minimum and maximum values. d, ACLY upregulation in human MASH-HCC compared to all other tissue types using scRNAseq samples. Significance assessed using Wilcoxon rank-sum tests comparing each condition to MASH-HCC, with p-values adjusted using the Benjamini-Hochberg method. Exact p-adj values: vs healthy Padj = 6.9 × 10−247, vs MALSD Padj = 1.0 × 10⁻¹⁶, vs non-tumor adjacent Padj = 1.6 × 10⁻¹⁸. e, Differential expression analysis of genes associated with ACLY expression in MASH-HCC; two-tailed t-test; 5% FDR as implemented in limma. f, Principal component embeddings of genes differentially expressed with respect to ACLY expression validate stratification of MASH-HCC tissues by high, medium, and low ACLY expression levels. g, Upregulation of CXCL13 among human MASH-HCC samples with reduced (bottom tertile, n = 18) relative to elevated (top tertile, n = 18) ACLY expression. Significance determined by two-tailed t-test with a false discovery adjusted threshold of 5% as implemented in limma. Boxplot lines represent the first quartile, median, and third quartile. Whiskers connect the minimum and maximum values. h, Identification of co-expression modules associated with ACLY expression and immune features. i, Significant biological processes associated with the immune and ACLY associated gene co-expression module.

References

    1. Pfister, D. et al. NASH limits anti-tumour surveillance in immunotherapy-treated HCC. Nature592, 450–456 (2021). - PMC - PubMed
    1. Zhou, Z. et al. The immunosuppressive tumor microenvironment in hepatocellular carcinoma-current situation and outlook. Mol. Immunol.151, 218–230 (2022). - PubMed
    1. Karin, M. New insights into the pathogenesis and treatment of non-viral hepatocellular carcinoma: a balancing act between immunosuppression and immunosurveillance. Precis. Clin. Med.1, 21–28 (2018). - PMC - PubMed
    1. Stine, Z. E., Schug, Z. T., Salvino, J. M. & Dang, C. V. Targeting cancer metabolism in the era of precision oncology. Nat. Rev. Drug Discov.21, 141–162 (2022). - PMC - PubMed
    1. Batchuluun, B., Pinkosky, S. L. & Steinberg, G. R. Lipogenesis inhibitors: therapeutic opportunities and challenges. Nat. Rev. Drug Discov.21, 283–305 (2022). - PMC - PubMed

MeSH terms

Substances