. 2025 Jul 5;28(8):113063.
doi: 10.1016/j.isci.2025.113063. eCollection 2025 Aug 15.

Direct interaction of HMGB1 with SARS-CoV-2 facilitates its infection via RAGE-dependent endocytosis

Affiliations

Direct interaction of HMGB1 with SARS-CoV-2 facilitates its infection via RAGE-dependent endocytosis

Su Ful Jung et al. iScience. .

Abstract

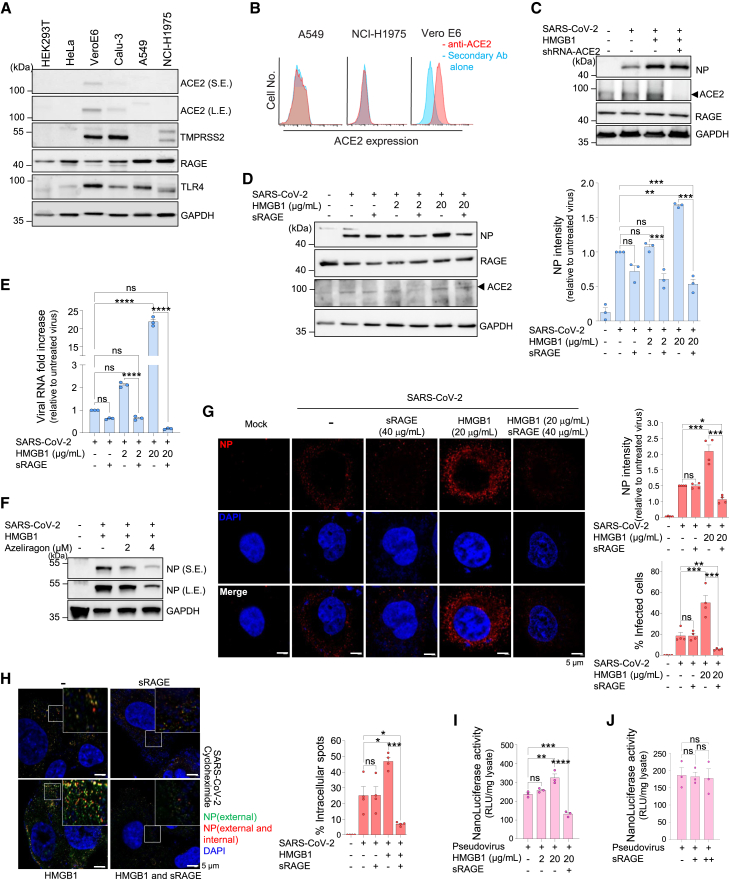
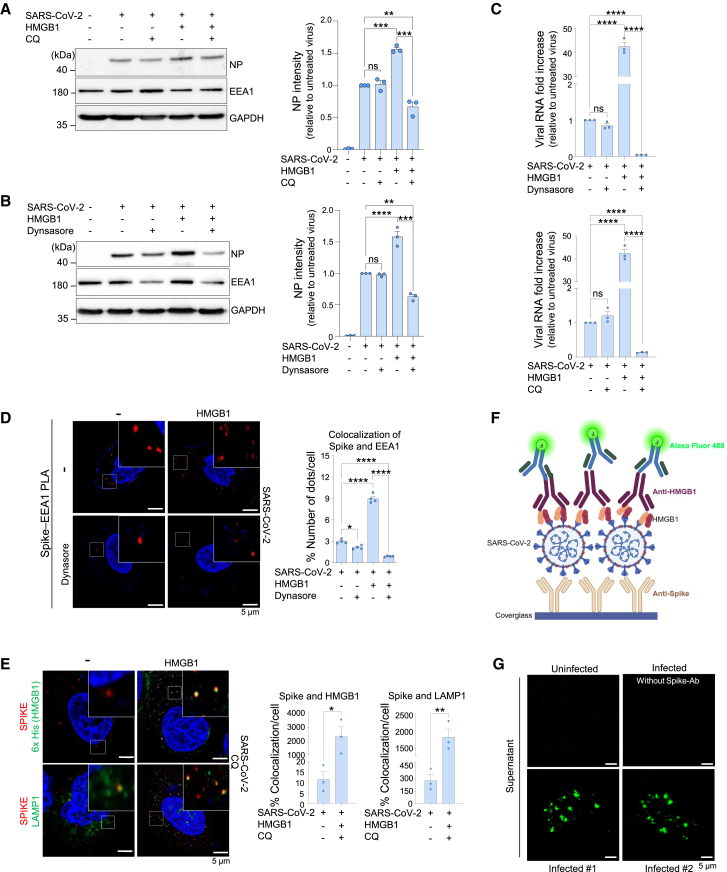
Severe acute respiratory syndrome coronavirus 2 (SARS-CoV-2), the causative agent of coronavirus disease 2019 (COVID-19), has caused >770 million infections since 2020. SARS-CoV-2 outcomes are largely influenced by host immune responses. Among key mediators of innate immunity, high-mobility group box 1 (HMGB1) has gained attention for its role in inflammation during SARS-CoV-2 infection, and its levels are significantly elevated in acute and post-COVID-19 cases, correlating with disease severity. This study investigated the role of HMGB1 in COVID-19 pathogenesis. Our findings demonstrate that the SARS-CoV-2 spike protein directly interacts with HMGB1, forming an HMGB1-SARS-CoV-2 complex. This complex interacts with the receptor for advanced glycation end-products (RAGE), facilitating clathrin-mediated endocytosis and enhancing SARS-CoV-2 infection in human lung cells in vitro and in mouse models of infection. Overall, this study demonstrates the role of HMGB1 in promoting viral entry via RAGE, emphasizing its potential as a therapeutic target in severe COVID-19 cases.

Keywords: Cell biology; Immunology; Virology.


Conflict of interest statement

The authors declare no competing interests.

Figures

None
Graphical abstract
Figure 1
Figure 1
HMGB1 directly interacts with the S1 subunit of the SARS-CoV-2 spike protein (A) Various HMGB1 domains were purified and (B) direct binding of HMGB1 domains to the spike protein was detected using SPR. Spike protein was immobilized on a CM5 chip, and each HMGB1 analyte was added. KD values were measured using the Biacore T200 evaluation software. Also see Table S1. HMGB1 domains were incubated with the S1-subunit of spike protein for 1 h at 37°C. Recombinant protein concentration was calculated according to its molecular mass. Immunoprecipitation (C) between the S1 subunit and HMGB1 domains was performed (left panel), and non-specific binding of the HMGB1 protein molecules to the beads was observed as a control (right panel). HMGB1, high-mobility group box 1; SARS-CoV-2, severe acute respiratory syndrome coronavirus 2; SPR, surface plasmon resonance.
Figure 2
Figure 2
HMGB1 enhances SARS-CoV-2 Infectivity (A) hACE2 and HMGB1 were incubated for 1 h at 37°C. hACE2 was immunoprecipitated in vitro, and the presence of HMGB1 was assessed via western blotting. (B and C) A549 cells were infected for 1 h with 1 MOI SARS-CoV-2, which was preincubated with HMGB1 for 1 h at 37°C, cultured further for 3 h, and subjected to western blotting (B) and qRT-PCR for viral RNA measurement (C) n = 3. S.E., short exposure; L.E., long exposure. Also see Figure S1. (D) A549 cells were infected with 5 MOI SARS-CoV-2 as above, fixed, and stained with anti-NP for confocal imaging. Representative images are shown. The percentage of infected cells and NP intensity were measured by counting at least 200 visible cells. n = 4. (E and F) A549 cells were infected with 1 MOI SARS-CoV-2 preincubated with various HMGB1 domains and were harvested for western blotting, quantification (E) n = 3, and qRT-PCR for viral RNA measurement (F) n = 2. (G) A549 cells were infected with 5 MOI SARS-CoV-2 preincubated with various HMGB1 domains. Cells were fixed, permeabilized, and stained with anti-NP for confocal imaging. Representative images are shown. The percentage of infected cells and NP intensity were measured by counting at least 200 visible cells. n = 4. Scale bars represent 5 μm. Also see Figure S2. Data are presented as mean ± SEM; ∗p < 0.05, ∗∗p < 0.01, ∗∗∗p < 0.001; ns, not significant, using one-way ANOVA with Tukey’s multiple comparison test. HMGB1, high-mobility group box 1; SARS-CoV-2, severe acute respiratory syndrome coronavirus 2; hACE2, human angiotensin-converting enzyme 2; MOI, multiplicity of infection; qRT-PCR, quantitative reverse transcription polymerase chain reaction; NP, nucleocapsid protein; SEM, standard error of the mean; ANOVA, analysis of variance.
Figure 3
Figure 3
HMGB1 induces SARS-CoV-2 infection in an ACE2-independent RAGE-dependent manner (A) Western blot analysis of receptors responsible for SARS-CoV-2 infection and HMGB1 binding. S.E., short exposure; L.E., long exposure. (B) Flow cytometry analysis of ectodomain ACE2 in A549 and NCI-H1975 cells used in this study. Vero E6 cells were used as control. (C) A549 cells were transfected with shRNA-ACE2 for 48 h prior to infection with 1 MOI SARS-CoV-2, which was preincubated with HMGB1 for 1 h at 37°C, cultured further for 3 h, and subjected to western blotting. (D and E) A549 cells were infected for 1 h with 1 MOI SARS-CoV-2, which was preincubated with HMGB1 for 1 h, in the presence of 40 μg/mL sRAGE at 37°C as indicated. Cells were harvested at 3 hpi and subjected to western blotting (D) n = 3, and qRT-PCR for viral RNA measurement (E) n = 3. (F) NCI-H1975 cells were infected with SARS-CoV-2 preincubated with 20 μg/mL HMGB1 in the presence of azeliragon. Cells were harvested at 3 hpi and subjected to western blotting. (G) A549 cells were infected with 5 MOI SARS-CoV-2, which was treated as above to observe NP. Representative confocal images are shown. The percentage of infected cells and NP intensity were measured by counting at least 700 visible cells. n = 4. (H) Cycloheximide pretreated NCI-H1975 cells were infected with 5 MOI SARS-CoV-2 (preincubated with HMGB1). Cells were stained for NP before permeabilization (green; external) and post-permeabilization (red; external and internal). Representative images and their magnifications are shown. The percentage of intracellular spots was measured by counting at least 200 visible cells. n = 4. (I and J) SARS2pp was preincubated with or without HMGB1 in the presence of sRAGE before transduction in NCI-H1975 cells. NanoLuc luciferase activity was measured 72 h post-transduction. n = 3 Scale bars represent 5 μm. Data are presented as mean ± SEM, ∗p < 0.05, ∗∗p < 0.01, ∗∗∗p < 0.001, ∗∗∗∗p < 0.0001; ns, not significant, using one-way ANOVA with Tukey’s multiple comparison test and Student’s unpaired t-test. HMGB1, high-mobility group box 1; SARS-CoV-2, severe acute respiratory syndrome coronavirus 2; MOI, multiplicity of infection; qRT-PCR, quantitative reverse transcription polymerase chain reaction; NP, nucleocapsid protein; SEM, standard error of the mean; ANOVA, analysis of variance; hpi, hours post-infection; RAGE, receptor for advanced glycation end-products; ACE2, angiotensin-converting enzyme 2; SARS2pp, SARS-CoV-2 spike protein (S)-pseudotyped retrovirus.
Figure 4
Figure 4
The SARS-CoV-2–HMGB1–RAGE complex is required for endocytic viral entry (A–C) NCI-H1975 cells were pretreated with either dynasore or chloroquine (CQ) and infected with 1 MOI SARS-CoV-2, which was preincubated with HMGB1 for 1 h at 37°C, cultured further for 3 h, and subjected to western blotting (A and B) n = 3, and qRT-PCR for viral RNA measurement (C) n = 3. (D) NCI-H1975 cells were pretreated with dynasore and infected with 5 MOI SARS-CoV-2, preincubated with HMGB1, and analyzed using a proximity ligation assay. Representative images and their magnifications are shown with red dots indicating the colocalization of spike protein and EEA1. The percentage of the number of dots per cell was determined by counting at least 10 visible cells. n = 4. (E) NCI-H1975 cells were pretreated with CQ and infected with 5 MOI SARS-CoV-2 (preincubated with HMGB1). Cells were stained for spike (SARS-CoV-2) and either for 6x His for HMGB1 or LAMP1. Representative images and their magnifications are shown. The percentage of colocalization per cell was determined by counting at least 30 visible cells. n = 3. (F) Scheme of virus pull-down assay. (G) Supernatants from infected cells were incubated on spike antibody-coated cover glass and subsequently stained for HMGB1. Green signals indicate SARS-CoV-2–HMGB1 complexes. Also see Figure S3n = 2. Scale bars represent 5 μm. Data are presented as the mean ± SEM, ∗p < 0.05, ∗∗p < 0.01, ∗∗∗p < 0.001, ∗∗∗∗p < 0.0001; ns, not significant, using one-way ANOVA with Tukey’s multiple comparison test and Student’s unpaired t-test. HMGB1, high-mobility group box 1; SARS-CoV-2, severe acute respiratory syndrome coronavirus 2; MOI, multiplicity of infection; qRT-PCR, quantitative reverse transcription polymerase chain reaction; SEM, standard error of the mean; ANOVA, analysis of variance; RAGE, receptor for advanced glycation end-products.
Figure 5
Figure 5
HMGB1 enhances SARS-CoV-2 infectivity in a murine model (A) Schematic overview of the timeline of the experiment. BALB/c mice were infected with SARS-CoV-2 (preincubated with HMGB1). The lungs and trachea were harvested at 24 and 48 hpi for (B) the plaque assay n = 4, and (C and D) immunohistochemistry analysis using anti-NP, anti-RAGE, anti-ACE2, and anti-HMGB1 antibodies. n = 3. Scale bars represent 100 μm. Data are presented as mean ± SEM, ∗p < 0.05, ∗∗p < 0.01, ∗∗∗p < 0.001, ∗∗∗∗p < 0.0001; ns, not significant, using one-way ANOVA with Tukey’s multiple comparison test. HMGB1, high-mobility group box 1; SARS-CoV-2, severe acute respiratory syndrome coronavirus 2; SEM, standard error of the mean; ANOVA, analysis of variance; RAGE, receptor for advanced glycation end-products; ACE2, angiotensin-converting enzyme 2; hpi, hours post-infection.

References

    1. Huang C., Wang Y., Li X., Ren L., Zhao J., Hu Y., Zhang L., Fan G., Xu J., Gu X., et al. Clinical features of patients infected with 2019 novel coronavirus in Wuhan, China. Lancet. 2020;395:497–506. doi: 10.1016/S0140-6736(20)30183-5. - DOI - PMC - PubMed
    1. Shuai H., Chan J.F.W., Hu B., Chai Y., Yuen T.T.T., Yin F., Huang X., Yoon C., Hu J.C., Liu H., et al. Attenuated replication and pathogenicity of SARS-CoV-2 B.1.1.529 Omicron. Nature. 2022;603:693–699. doi: 10.1038/s41586-022-04442-5. - DOI - PubMed
    1. World Health Organization 2023 data.who.int, WHO Coronavirus (COVID-19) dashboard > More resources [Dashboard] https://data.who.int/dashboards/covid19/more-resources
    1. Omolo C.A., Soni N., Fasiku V.O., Mackraj I., Govender T. Update on therapeutic approaches and emerging therapies for SARS-CoV-2 virus. Eur. J. Pharmacol. 2020;883 doi: 10.1016/j.ejphar.2020.173348. - DOI - PMC - PubMed
    1. Arunachalam P.S., Wimmers F., Mok C.K.P., Perera R.A.P.M., Scott M., Hagan T., Sigal N., Feng Y., Bristow L., Tak-Yin Tsang O., et al. Systems biological assessment of immunity to mild versus severe COVID-19 infection in humans. Science. 2020;369:1210–1220. doi: 10.1126/science.abc6261. - DOI - PMC - PubMed

LinkOut - more resources