. 2025 Jul 10;28(8):113092.
doi: 10.1016/j.isci.2025.113092. eCollection 2025 Aug 15.

Age- and sex-associated differences in immune cell populations

Affiliations

Age- and sex-associated differences in immune cell populations

Reza Gheitasi et al. iScience. .

Abstract

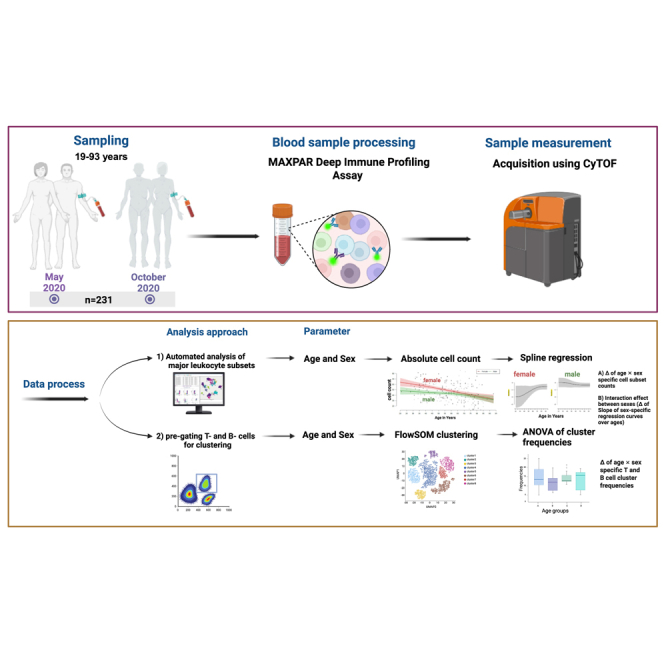
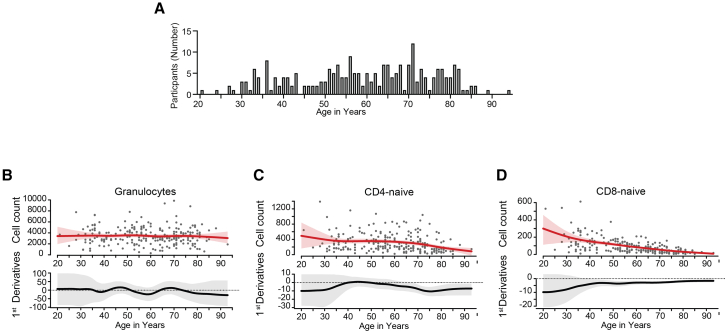
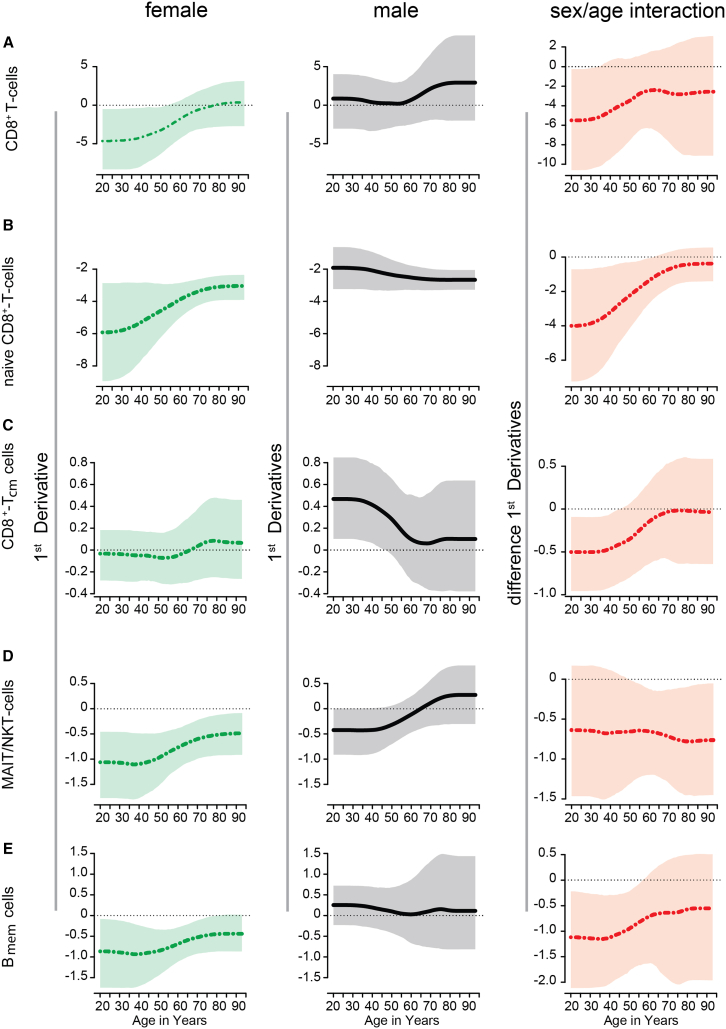
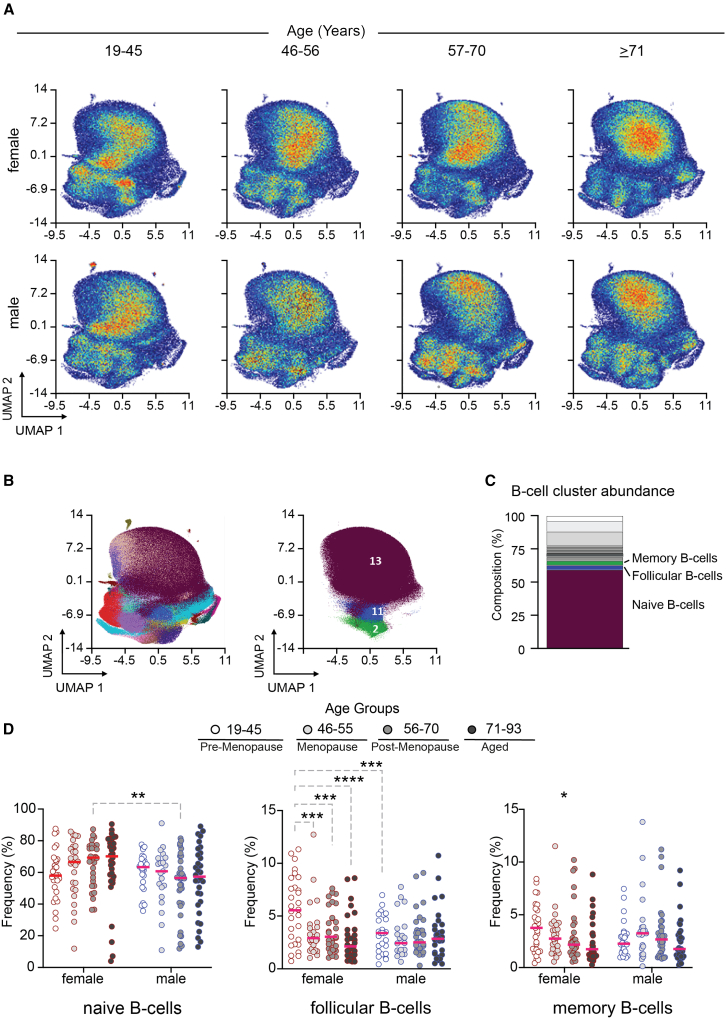
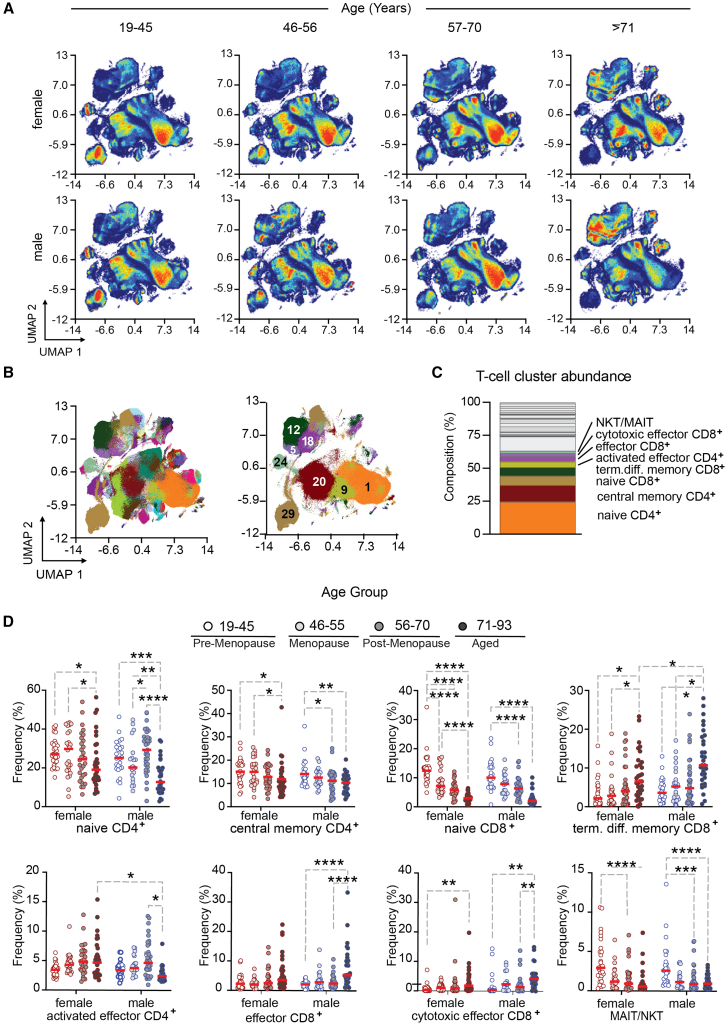
Aging is associated with the risk of increased infection severity and altered immune responses. In this study we investigated age- and sex-specific differences in immune cell composition in a subset of the population-based CoNAN study using a cross-sectional analysis. We identified a significant age × sex interaction in memory B cells and observed age-related declines in naive lymphocytes and an increase in CD8+ effector memory T cells in men. Additionally, numbers of dendritic cell subpopulations decreased with age in both sexes. This study provides new insights into complex dependencies of the immune cell composition on age and sex (e.g., age × sex interaction effects) and could enhance our understanding of immune status variations among different ages. However, further studies are needed to assess the functional implications of these compositional differences.

Keywords: Components of the immune system; Immunology.


Conflict of interest statement

All authors declare no competing interests.

Figures

None
Graphical abstract
Figure 1
Figure 1
Age distribution and spline regression analysis of granulocyte and naive T cell counts across the human lifespan (A) Age distribution of participants (n = 236). Absolute counts of (B) granulocytes, (C) CD4+ naive T cells, and (D) CD8+ naive T cells of all intact leukocytes. Each dot indicates an individual participant. Red lines with the 95% confident band indicate spline regression, black lines with the 95% confident band indicate the first derivative of the spline regression. (Supplementary information on graphs interpretation exemplary on (D): Flexible spline regression model was used to analyze cell count trends across the lifespan, avoiding the need for pre-defined age groups or assumptions about the relationship between cell numbers and age. The upper panel depicts the overall negative trend in naive CD8+ T cell counts with increasing age. The lower panel shows the age-specific slopes of the regression curve, along with their 95% confidence intervals, illustrating the rate of change in cell counts at different ages. A slope significantly different from zero, where the confidence interval does not overlap with zero, indicates a statistically significant increase or decrease at that specific age. In this case, a significant decline in naive CD8+ T cell number is evident from age 38 onwards. Notably, the varying slope across the age spectrum reveals subtle fluctuations in the rate of decline over time).
Figure 2
Figure 2
Comparison of absolute immune cell counts between sexes across the lifespan Each cell in the graph represents the mean difference in absolute count for a specific immune cell type (y axis) at a given age (x axis). Green indicates a significantly higher mean count in women compared to men, while gray indicates a significantly higher mean count in men compared to women. Tcm: central memory, Tem: effector memory, Bmem cells: memory B cells, MAIT/NKT: Mucosal associated invariant T cells/natural killer T cells, trans mono: transitional monocytes, cDC: conventional dendritic cells, non class mono: non classical monocyte, All values are indicating Year.
Figure 3
Figure 3
First derivatives of sex-specific spline regressions and age × sex interaction for selected immune cell populations First derivatives of sex-specific spline regressions of cell counts (left and middle column) and age × sex interaction effect (right column) representing the difference of the first derivative of the two sex-specific regression curves with 95%-confidence band, respectively, for (A) total CD8+ T cells, (B) naive CD8+ T cells, (C) CD8+ Tcm cells, (D) MAIT/NKT, and (E) Bmem cells in regard to age.
Figure 4
Figure 4
Differences in B cell composition across different sex and age groups (A) UMAP projection of pre-gated B cells from women and men in pre-defined age groups regarding the sexual hormone status of women in general. Each dot represents a single cell. Color represents the density of cells derived from age group 19–45 years (n = 29 females, n = 26 males), age group 46–56 years (n = 26 females, n = 21 males), age group 57–70 years (n = 30 females, n = 35 males), and age group 71–93 years (n = 32 females, n = 32 males). (B) UMAP projection of B cells. Color represents 20 different meta clusters derived from FlowSOM clustering (left) and selected clusters 2 (memory B cells), 11 (follicular B cells) and 13 (naive B cells) (right) that were statistically significant in age/sex interactions depicted in Figure 3D. (C) Bar chart shows the composition of all B cell clusters derived from FlowSOM clustering naming selected cluster 2, 11, and 13. (D) Graphs show frequencies of memory, follicular and naive B cells across different sex and age groups. Asterisks denote statistically significant results after applying ANOVA statistical test (∗p < 0.05, ∗∗p < 0.01, ∗∗∗p < 0.001, ∗∗∗∗p < 0.0001). Abbreviations: UMAP: uniform manifold approximation and projection, FlowSOM: self-organizing maps for cytometry data, ANOVA: analysis of variance.
Figure 5
Figure 5
Differences in T cell composition across different sex and age groups (A) UMAP projection of pre-gated T cells from women and men in pre-defined age groups regarding the sexual hormone status of women in general. Each dot represents a single cell. Color represents the density of cells derived from different age groups consistent to Figure 3. (B) UMAP projection of T cells. Color represents 30 different meta clusters derived from FlowSOM clustering (left) and selected clusters 1 (naive CD4+ T cells), 5 (cytotoxic effector CD8+ T cells, 9 (activated effector CD4+ T cells), 12 (TEMRA CD8+ T cells), 18 (CD8+ Teff cells), 20 (CD4+ Tcm cells), 24 (MAIT/NKT), 29 (naive CD8+ T cells) (right) that were statistically significant in age/sex interactions depicted in Figure 4D. (C) Bar chart shows the composition of all T cell clusters derived from FlowSOM clustering naming selected cluster from Figure 4B. (D) Graphs show frequencies of selected T cell clusters from Figure 4B across different sex and age groups. Asterisks denote statistically significant results after applying ANOVA statistical test (∗p < 0.05, ∗∗p < 0.01, ∗∗∗p < 0.001, ∗∗∗∗p < 0.0001). Abbreviations: UMAP: uniform manifold approximation and projection, FlowSOM: self-organizing maps for cytometry data, ANOVA: analysis of variance, Term.diff. memory: terminally differentiated memory, MAIT/NK: mucosal associated invariant T cell/natural killer T cell.

References

    1. Ruggieri A., Anticoli S., D’Ambrosio A., Giordani L., Viora M. The influence of sex and gender on immunity, infection and vaccination. Ann. Ist. Super Sanita. 2016;52:198–204. doi: 10.4415/ANN_16_02_11. - DOI - PubMed
    1. Shaw A.C., Goldstein D.R., Montgomery R.R. Age-dependent dysregulation of innate immunity. Nat. Rev. Immunol. 2013;13:875–887. doi: 10.1038/nri3547. - DOI - PMC - PubMed
    1. Gubbels Bupp M.R. Sex, the aging immune system, and chronic disease. Cell. Immunol. 2015;294:102–110. doi: 10.1016/j.cellimm.2015.02.002. - DOI - PubMed
    1. Valiathan R., Ashman M., Asthana D. Effects of Ageing on the Immune System: Infants to Elderly. Scand. J. Immunol. 2016;83:255–266. doi: 10.1111/sji.12413. - DOI - PubMed
    1. Zhang Z., Reynolds S.R., Stolrow H.G., Chen J.-Q., Christensen B.C., Salas L.A. Deciphering the role of immune cell composition in epigenetic age acceleration: Insights from cell-type deconvolution applied to human blood epigenetic clocks. Aging Cell. 2024;23 doi: 10.1111/acel.14071. - DOI - PMC - PubMed

LinkOut - more resources