[Preprint]. 2025 Jul 26:arXiv:2505.14730v2.

Predicting Neoadjuvant Chemotherapy Response in Triple-Negative Breast Cancer Using Pre-Treatment Histopathologic Images

Affiliations

Predicting Neoadjuvant Chemotherapy Response in Triple-Negative Breast Cancer Using Pre-Treatment Histopathologic Images

Hikmat Khan et al. ArXiv. .

Update in

Abstract

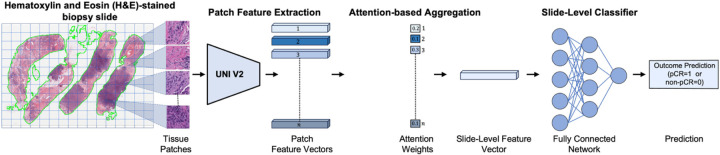
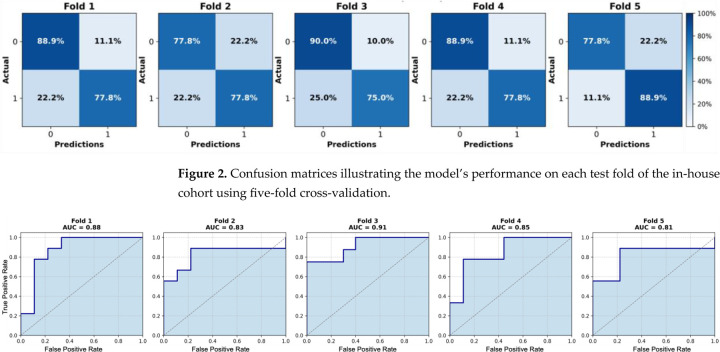
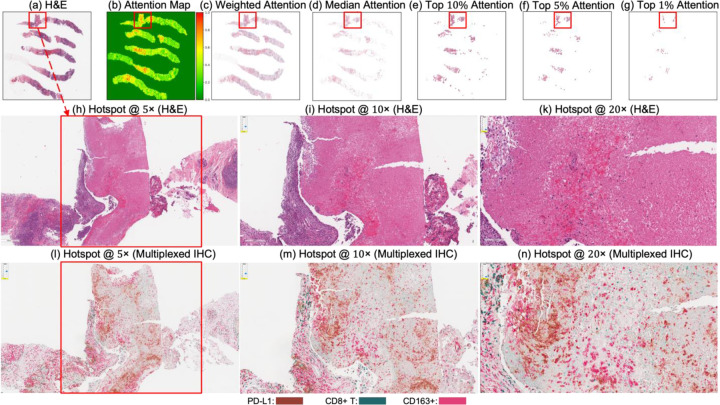
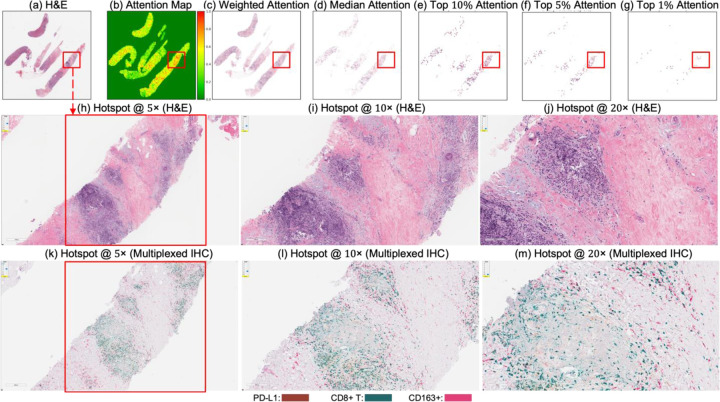
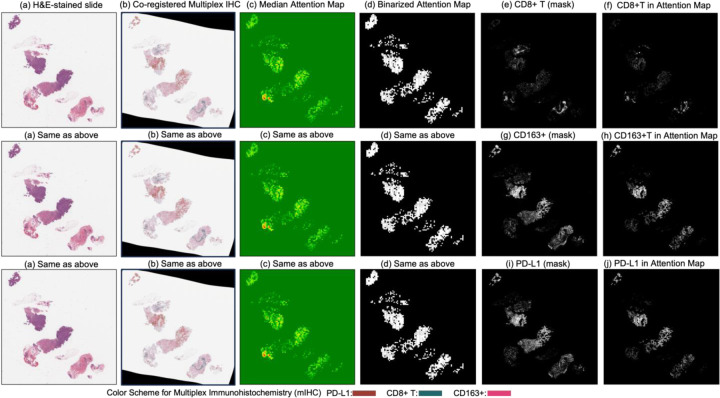
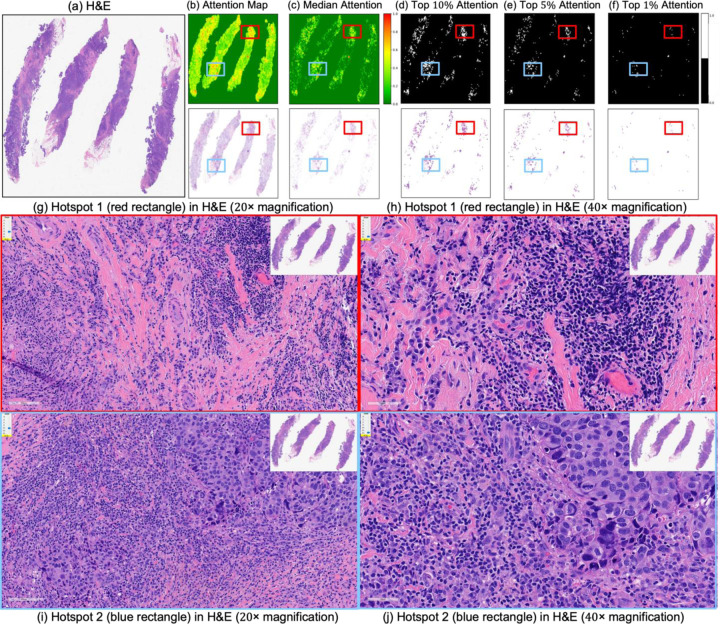
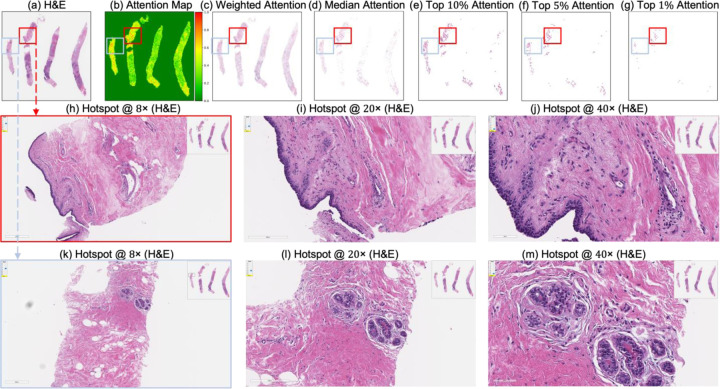
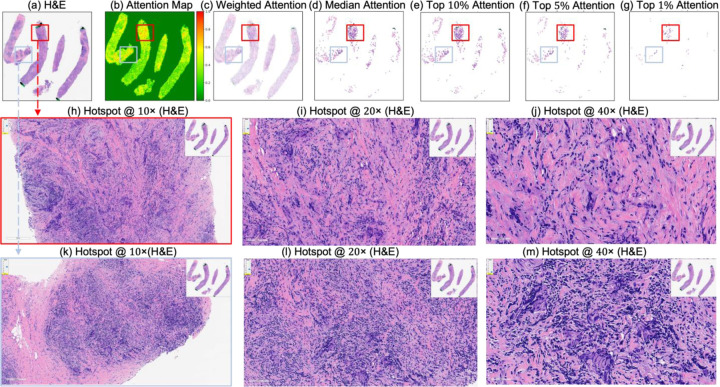
Triple-negative breast cancer (TNBC) remains a major clinical challenge due to its aggressive behavior and lack of targeted therapies. Accurate early prediction of response to neoadjuvant chemotherapy (NACT) is essential for guiding personalized treatment strategies and improving patient outcomes. In this study, we present an attention-based multiple instance learning (MIL) framework designed to predict pathologic complete response (pCR) directly from pre-treatment hematoxylin and eosin (H&E)-stained biopsy slides. The model was trained on a retrospective in-house cohort of 174 TNBC patients and externally validated on an independent cohort (n = 30). It achieved a mean area under the curve (AUC) of 0.85 during five-fold cross-validation and 0.78 on external testing, demonstrating robust predictive performance and generalizability. To enhance model interpretability, attention maps were spatially co-registered with multiplex immunohistochemistry (mIHC) data stained for PD-L1, CD8+ T cells, and CD163+ macrophages. The attention regions exhibited moderate spatial overlap with immune-enriched areas, with mean Intersection over Union (IoU) scores of 0.47 for PD-L1, 0.45 for CD8+ T cells, and 0.46 for CD163+ macrophages. The presence of these biomarkers in high-attention regions supports their biological relevance to NACT response in TNBC. This not only improves model interpretability but may also inform future efforts to identify clinically actionable histological biomarkers directly from H&E-stained biopsy slides, further supporting the utility of this approach for accurate NACT response prediction and advancing precision oncology in TNBC.

Keywords: artificial intelligence (AI); neoadjuvant chemotherapy (NACT); pathologic complete response (pCR); treatment response prediction; triple-negative breast cancer (TNBC).


Conflict of interest statement

Conflicts of Interest: All authors have no conflicts of interest.

Figures

Figure 1.
Figure 1.
Overview of the pipeline for predicting pathologic complete response (pCR) to neoadjuvant chemotherapy (NACT) in triple-negative breast cancer (TNBC) using pre-treatment H&E-stained biopsy slides. First, the H&E-stained slide is segmented and divided into a grid to extract tissue patches. Each patch is then encoded into a feature vector using a pretrained deep learning encoder (i.e., UNI v2 [46], a general-purpose, self-supervised pathology foundation model trained on 1.2 million histopathology slides). These patch-level features are aggregated via an attention mechanism [45] that assigns greater weight to the most informative regions, resulting in a slide-level feature representation. A fully connected neural network classifier then utilizes the slide-level feature representation to predict the likelihood of a complete response (pCR) or non-response (non-pCR) to NACT for each patient.
Figure 2.
Figure 2.
Confusion matrices illustrating the model’s performance on each test fold of the in-house cohort using five-fold cross-validation.
Figure 3.
Figure 3.
Receiver operating characteristic (ROC) curves for each test fold of the in-house cohort using five-fold cross-validation. Area under the curve (AUC) values range from 0.81 to 0.91.
Figure 4.
Figure 4.
Attention map visualization of an attention-based multiple instance learning (MIL) model for a correctly classified triple-negative breast cancer (TNBC) patient (true positive) who achieved pCR to neoadjuvant chemotherapy (NACT). (a) H&E-stained biopsy slide thumbnail with (b) corresponding attention heatmap of the MIL model. (c) Weighted attention heatmap representation showing individual patches weighted by the model’s attention scores. (d) Median attention heatmap. (eg) Progressive filtering of attention regions showing median attention: (e) top 10% attention (f) and top 5% attention, (g) culminating in top 1% attention hotspots. (hj) Zoomed-in H&E slides of the identified hotspot region at increasing magnifications: 5×, 10×, and 20×, respectively. (km) Multiplex immunohistochemistry (mIHC) slides of consecutive tissue sections from the same hotspot region at the same magnifications (5×, 10×, 20×), revealing the presence of PD-L1 (brown), CD8+ T cells, and CD163+ macrophages (red) in the model-identified regions. These immune markers are established biomarkers for pCR in TNBC [27], demonstrating the model’s ability to attend to immunologically relevant regions rich in biomarkers.
Figure 5.
Figure 5.
Attention map visualization of an attention-based multiple instance learning (MIL) model for a correctly classified triple-negative breast cancer (TNBC) patient (true negative) who did not achieve pathological complete response (non-pCR) to neoadjuvant chemotherapy (NACT). (a) H&E-stained biopsy slide thumbnail with (b) corresponding attention heatmap generated by the MIL model. (c) Weighted attention representation showing individual patches weighted by the model’s attention scores. (d) Median attention. (eg) Progressive filtering of attention regions showing median attention: (e) top 10% attention (f) and top 5% attention, (g) culminating in top 1% attention hotspots. (hj) Zoomed-in H&E slides of the identified hotspot region at increasing magnifications: 5×, 10×, and 20×, respectively. (km) Multiplex immunohistochemistry (mIHC) slide of consecutive tissue sections from the same hotspot region at the same magnifications (5×, 10×, 20×), revealing the presence of PD-L1 (brown), CD8+ T cells, and CD163+ macrophages (red) in the model-identified regions. These immune markers are established biomarkers for pCR in TNBC [27], demonstrating the model’s ability to attend to immunologically relevant regions rich in biomarkers.
Figure 6.
Figure 6.
Columns (a) through (d) display (a) the original H&E-stained biopsy slide, (b) the corresponding co-registered multiplex immunohistochemistry (mIHC) slide, (c) the median attention map generated by the attention model, and (d) the binarized version of the attention map. Column (e) shows the CD8+ T-cell mask, and column (f) illustrates the intersection between the binarized attention map (d) and the CD8+ T-cell mask (e), indicating the presence of CD8+ T cells within the model’s attention regions. Similarly, column (g) presents the CD163+ cell mask, and column (h) shows the intersection between (d) and (g), reflecting the attention overlap with CD163+ regions. Column (i) displays the PD-L1 mask, and column (j) presents the intersection between (d) and (i), quantifying the presence of PD-L1 in the attended regions.
Figure 7.
Figure 7.
Attention map visualization for an incorrectly classified triple-negative breast cancer (TNBC) patient who achieved pathological complete response (pCR) to neoadjuvant chemotherapy (NACT) but who the model predicted as non-pCR. (a) H&E-stained biopsy slide thumbnail. (b,c) First row: corresponding attention heatmap generated by the deep learning model. The second row displays the weighted attention representation showing individual patches weighted by the model’s attention scores. (c) Median attention. (df) display the top 10%, 5%, and 1%, attention masks while below each mask is shown individual patches weighted by the model’s attention scores. (g,h) show the zoomed-in H&E slide of the identified hotspot region 1 (highlighted by the red rectangle) at increasing magnifications of 20×, and 40×, respectively. (i,j) show the zoomed-in H&E slides of the identified hotspot region 2 (highlighted by the blue rectangle) at increasing magnifications of 20×, and 40×, respectively.
Figure 8.
Figure 8.
Attention map visualization of an attention-based multiple instance learning (MIL) model for an incorrectly classified TNBC patient (false negative) who achieved pathological complete response (pCR) to neoadjuvant chemotherapy (NACT), but who the model predicted as non-pCR. (a) H&E-stained biopsy slide thumbnail with (b) corresponding attention heatmap of the MIL model. (c) Weighted attention representation showing individual patches weighted by the model’s attention scores. (d) Median attention. (eg) Progressive filtering of attention regions showing median attention, (e) top 10% attention, (f) and top 5% attention, (g) culminating in top 1% attention hotspots. (hk) Zoomed-in H&E slide of the identified hotspot region (highlighted by the red rectangle) at increasing magnifications: 8×, 20×, and 40×, respectively. (ln) Zoomed-in H&E slides of the identified hotspot region (highlighted by the sky-blue rectangle) at increasing magnifications: 8×, 20×, and 40×, respectively.
Figure 9.
Figure 9.
Attention map visualization of an attention-based multiple instance learning (MIL) model for an incorrectly classified triple-negative breast cancer (TNBC) patient (false positive) who did not achieve pathological complete response (non-pCR) to neoadjuvant chemotherapy (NACT), but who the model predicted as pCR. (a) H&E-stained biopsy slide thumbnail with (b) corresponding attention heatmap of the MIL model. (c) Weighted attention representation showing individual patches weighted by the model’s attention scores. (d) Median attention. (eg) Progressive filtering of attention regions showing median attention, (e) top 10% attention, (f) and top 5% attention, (g) culminating in top 1% attention hotspots. (hj) Zoomed-in H&E slide of the identified hotspot region (highlighted by the red rectangle) at increasing magnifications: 10×, 20×, and 40×, respectively. (km) Zoomed-in H&E slide of the identified hotspot region (highlighted by the sky-blue rectangle) at increasing magnifications: 10×, 20×, and 40×, respectively.

Similar articles

References

    1. Marra A.; Curigliano G. Adjuvant and neoadjuvant treatment of triple-negative breast cancer with chemotherapy. Cancer J. 2021, 27, 41–49. - PubMed
    1. Soliman A.; Li Z.; Parwani A.V. Artificial intelligence’s impact on breast cancer pathology: A literature review. Diagn. Pathol. 2024, 19, 38. - PMC - PubMed
    1. Ferlay J.; Steliarova-Foucher E.; Lortet-Tieulent J.; Rosso S.; Coebergh J.-W.W.; Comber H.; Forman D.; Bray F. Cancer incidence and mortality patterns in Europe: Estimates for 40 countries in 2012. Eur. J. Cancer 2013, 49, 1374–1403. - PubMed
    1. van den Ende N.S.; Nguyen A.H.; Jager A.; Kok M.; Debets R.; van Deurzen C.H. Triple-negative breast cancer and predictive markers of response to neoadjuvant chemotherapy: A systematic review. Int. J. Mol. Sci. 2023, 24, 2969. - PMC - PubMed
    1. Xiong N.; Wu H.; Yu Z. Advancements and challenges in triple-negative breast cancer: A comprehensive review of therapeutic and diagnostic strategies. Front. Oncol. 2024, 14, 1405491. - PMC - PubMed

Publication types

LinkOut - more resources