Review
. 2025;22(1):2.
doi: 10.1007/s41116-025-00041-4. Epub 2025 Jul 28.

Coronal dimmings and what they tell us about solar and stellar coronal mass ejections

Affiliations
Review

Coronal dimmings and what they tell us about solar and stellar coronal mass ejections

Astrid M Veronig et al. Living Rev Sol Phys. 2025.

Abstract

Coronal dimmings associated with coronal mass ejections (CMEs) from the Sun have gained much attention since the late 1990s when they were first observed in high-cadence imagery of the SOHO/EIT and Yohkoh/SXT instruments. They appear as localized sudden decreases of the coronal emission at extreme ultraviolet (EUV) and soft X-ray (SXR) wavelengths, that evolve impulsively during the lift-off and early expansion phase of a CME. Coronal dimmings have been interpreted as "footprints" of the erupting flux rope and also as indicators of the coronal mass loss by CMEs. However, these are only some aspects of coronal dimmings and how they relate to the overall CME/flare process. The goal of this review is to summarize our current understanding and observational findings on coronal dimmings, how they relate to CME simulations, and to discuss how they can be used to provide us with a deeper insight and diagnostics of the triggering of CMEs, the magnetic connectivities and coronal reconfigurations due to the CME as well as the replenishment of the corona after an eruption. In addition, we go beyond a pure review by introducing a new, physics-driven categorization of coronal dimmings based on the magnetic flux systems involved in the eruption process. Finally, we discuss the recent progress in studying coronal dimmings on solar-like and late-type stars, and how to use them as a diagnostics for stellar coronal mass ejections and their properties.

Supplementary information: The online version contains supplementary material available at 10.1007/s41116-025-00041-4.

Keywords: Corona; Coronal mass ejections; Flares; Solar physics; Stellar activity; Stellar physics.


Figures

Fig. 1
Fig. 1
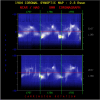
Examples of streamer blowouts taken from synoptic coronagraph data. Each chart consists of the brightness in an annulus (in this case at 2.8 R) stacked from right to left as the Sun’s rotation varies the Carrington longitude in the “plane of the sky.” Often a coronal streamer can be seen over many days, and a streamer blowout has a recognizeable bugle-like appearance, the horn of the bugle to the left, as the streamer swells and then suddenly disappears. That marks the occurrence of a CME, whose eruption essentially destroys the streamer. It may reform, but on a much longer time scale. Here the upper and lower panels refer to E limb and W limb, respectively, for three Carrington rotations in 1984. From the Solar Maximum Mission (SMM) coronal synoptic maps archive: https://www2.hao.ucar.edu/mlso/solar-maximum-mission
Fig. 2
Fig. 2
Twin coronal dimming event associated with the halo CME of SOL1997-05-12. The top row shows the pre-event corona (left) and the dimming evolution in SOHO/EIT 195 Å imagery. The bottom panel shows the SOHO/MDI line-of-sight magnetogram of the source AR (left) and snapshots in all three coronal EIT filters (195, 171, 284 Å) about two hours after the eruption. Image reproduced with permission from Thompson et al. (1998), copyright by AGU. The movie in the online supplement shows the evolution of the event in the EIT 195 Å filter
Fig. 3
Fig. 3
Simplified sketch of the time evolution of a coronal dimming intensity profile from spatially resolved observations (green) along with the associated CME height-time profile (blue) and the flare soft X-ray light curve (red). Important stages of evolution are outlined for each phenomenon. t0 marks the beginning of pre-eruption dimming, t1 the start of the dimming main phase which usually coincides with the start of the flare impulsive phase, and t2 marks the minimum in the dimming intensity, respectively. This diagram illustrates the various features that may be observed associated with a coronal dimming observed in EUV wavelengths such as 193 and 211 Å. The purpose of this diagram is to provide context for the following discussion of the associated phenomena. Some of the features are not always observed, and the time axis is shown to indicate relative timing of the different phenomena
Fig. 4
Fig. 4
Persistence maps derived from SDO/AIA images over the course of the dimming event SOL2010-11-30. Panel A is a pre-eruption frame at 17:00 UT, and subsequent frames are 18:05 UT, 19:00 UT, 19:55 UT, 20:00 UT, and 02:00 UT from the following day. The left sides of the panels are three-color images with AIA 211 Å in the red layer, 193 Å in the green layer, and 171 Å in the blue layer. The right sides of the panels are persistence maps, consisting of the minimum value of each pixel evaluated from 17:00 UT to the time of each frame. The persistence technique focused only on the decreasing regions, showing the full extent of the dimmings as they develop, and excluding the expanding flare loops. Adapted from Thompson and Young (2016). The movie in the online supplement shows the evolution of the event in the AIA 211-193-171 three-color persistence maps
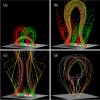
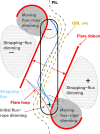
Fig. 5
Fig. 5
Illustration of the procedure used by SolarDemon to detect coronal dimmings based on running-difference (RD) and percentage running-difference (PRD) images. Image reproduced with permission from Kraaikamp and Verbeeck (2015), copyright by the authors
Fig. 6
Fig. 6
From imaging to “Sun-as-a-star” observations of SOL2010-08-07: Coronal dimmings identified in regions-of-interests (colored contours and corresponding time profiles) in full-disk integrated SDO/AIA EUV images (left and top right panels) and in SDO/EVE spatially integrated irradiance measurements (bottom right panel). Adapted from Mason et al. (2014)
Fig. 7
Fig. 7
Left: SDO/HMI line-of-sight magnetogram (top) and snapshots of logarithmic base-ratio images visualizing the relative changes in the emission in the SDO/AIA 211 Å filter during the flare/CME SOL2012-03-14 (M2.8). Right: Normalized light curves obtained from the six coronal SDO/AIA channels in a small area inside the Western dimming region indicated by the green box in the left panels. Adapted from Vanninathan et al. (2018)
Fig. 8
Fig. 8
Evolution of the coronal dimming associated with the SOL2009-02-13 CME. Top: Normalized light curve derived from the STEREO-B EUVI 195 Å filter for the FOV shown in the bottom panels. The shaded area marks the duration of the dimming, i.e. from its start until the EUV emission recovered back to the pre-event level. Middle: Selected EUVI 195 Å images covering a 600×500 FOV centered on the erupting AR. The recording times of the images shown are marked by vertical lines in the top panel. Bottom: Corresponding base difference images. The movie in the online supplement shows the first three hours of the event evolution in STEREO-B EUVI 195 Å images. Image reproduced with permission from Miklenic et al. (2011), copyright by Springer
Fig. 9
Fig. 9
Evolution of the coronal dimming parameters associated with the flare/CME SOL2011-02-13 (M6.7) together with the flare evolution and CME kinematics: a cumulative dimming area (black) and its growth rate (green), b positive (blue), negative (red), and total (black) unsigned magnetic flux underlying the dimming region, c corresponding magnetic flux rates, d total dimming brightness. e GOES 1–8 Å SXR flux of the associated flare. fh CME height-, velocity- and acceleration-time profile derived from smoothed curves (black lines) and direct measurement points (orange symbols). The vertical lines mark the start, peak, and end time of the impulsive dimming phase. Adapted from Dissauer et al. (2019)
Fig. 10
Fig. 10
Characteristic dimming properties derived from SDO/AIA 211 Å filtergrams and co-registered SDO/HMI line-of-sight magnetograms. Distributions of a dimming area, b minimum brightness, c unsigned magnetic flux, d mean unsigned magnetic flux density. The black line shows the lognormal probability density function for each distribution, and the insets give the corresponding median and standard deviation. Adapted from Dissauer et al. (2018b)
Fig. 11
Fig. 11
Simultaneous observations of the coronal dimming SOL2011-10-01 observed from two different viewpoints. Top: dimming observed against the solar disk by the SDO/AIA 211 Å filter. Left: direct image, middle: logarithmic base ratio image, right: timing map which indicates when each dimming pixel was detected for the first time (in hours after the flare onset). Bottom: Same but for the dimming as observed above the limb by the 195 Å filter of EUVI onboard STEREO-B, on that day located at a longitudinal separation of 97.6 from the Sun-Earth line. Image reprodcued with permission from Chikunova et al. (2020), copyright by AAS
Fig. 12
Fig. 12
Comparison of dimming properties derived from the on-disk (SDO/AIA) and off-limb view (STEREO/EUVI). Left: dimming area, right: dimming brightness from base difference images. The black line shows the least-squares linear fit to the data, the blue line the 1:1 correspondence line. Adapted from Chikunova et al. (2020)
Fig. 13
Fig. 13
Spatial distributions of the peak intensity, Doppler shift and line width derived from the single Gaussian fit and the average RB asymmetry in the velocity interval of 70–130 km s-1 for the Fe xiii 202.04 Å line in the 2006 December 14–15 observations. The upper and lower panels show the EIS line parameters before and after the eruption, respectively. Adapted from Tian et al. (2012)
Fig. 14
Fig. 14
Selected Hinode/EIS spectra of Fe xiii 202.04 Å (top row) and Fe xv 284.16 Å (bottom row) in a dimming region observed for SOL2012-09-28. A double-Gaussian fit is shown for each observed spectrum, and the velocities of the two components are displayed in the upper-right corners. Adapted from Veronig et al. (2019). The movie in the online supplement shows the event evolution in SDO/AIA 94, 304 and 211 Å direct and base-ratio images (from Veronig et al. 2019). The Hinode/EIS spectra shown were obtained in the triangle-shaped western dimming region
Fig. 15
Fig. 15
Differential emission measure (DEM) curves before the eruption (upper panel) and in the dimming region (lower panel) in the 2006 December 14–15 observations. In the lower panel the DEM curve before the eruption (dashed line) is also overplotted for a direct comparison. Image reproduced with permission from Tian et al. (2012), copyright by AAS
Fig. 16
Fig. 16
Left: Reconstructed DEM profiles derived from a small area inside the Western core dimming region for SOL2012-03-14 (M2.8); see Fig. 7. Right: Time evolution of total emission measure, density and mean plasma temperature derived from the DEM profiles over 12 hrs during the event. Images reproduced with permision from Vanninathan et al. (2018), copyright by AAS
Fig. 17
Fig. 17
Illustration of dimming recovery. Top left: SOHO/EIT 195 Å image during the impulsive phase of the SOL1997-05-12 dimming. Top right: corresponding base difference image, with contours overlaid at three times as shown in the legend. Bottom left: EIT 195 Å base difference image with contours showing the identified Eastern core (orange) and entire (green) dimming region. Bottom right: corresponding light curves in these regions. Images reproduced with permission from Attrill et al. (2008), copyright by Springer
Fig. 18
Fig. 18
Example of pre-eruption dimming. ad Twin dimmings observed in the 304 Å passband by SDO/AIA, which are located at the two ends of flare ribbons in magnetic fields of opposite polarities, prior to the CME eruption of a C5.7 two-ribbon flare on 2011 December 26. The contours indicate the two dimming regions, the left foot (LF) region and the right foot (RF) region, respectively. ef The total light curves in the 304 Å passband of the dimming region (thick black), and light curves of sample pixels (red and blue) in the left and right foot regions, in comparison with the total light curve of the active region (thin black), and the measured CME height in the plane of sky of the STEREO observation (symbols). The positions of the sample pixels in the LF and RF regions are denoted by crosses (red and blue) in panel (c). In panels (e) and (f), the orange dashed straight lines show the least-squared fit of the dimming depth (thick black) to a linear function of the time-lapse. g Height-velocity graph estimated using the pre-eruption dimming evolution with different expansion models (indicated by different line styles) and varying dimming rate, 0.003 (blue), 0.004 (red), and 0.008 (green) per minute, respectively, together with the observed height-velocity measured from the STEREO observations (symbols). Images reproduced with permission from Qiu and Cheng (2017), copyright by AAS
Fig. 19
Fig. 19
a An M1.9 flare (SOL2012-06-14) associated with a sigmoid and coronal dimming observed in 131 Å and 304 Å by SDO/AIA. b Associated halo coronal mass ejection observed by COR2 on STEREO A and B. c Vector magnetic field from SDO/HMI and d vertical electric current density in the host active region, superimposed with the contours that outline the coronal dimmings at the footprint of the erupting sigmoid. Images reproduced with permission from Wang et al. (2019), copyright by AAS. The movie in the online supplement shows the event evolution in AIA 1600 and 94 Å multi-color images (from Wang et al. 2019)
Fig. 20
Fig. 20
a GOES 1–8 Å soft X-ray light curve before and during the SOL2012-06-14 M1.9 flare. b Light curves of SDO/AIA 304 Å emission in the twin core dimming regions showing persistent dimming prior to the flare. c Slow rise of a coronal structure tracked in STEREO/EUVI 195 Å images. Image reproduced with permission from Wang et al. (2019), copyright by AAS
Fig. 21
Fig. 21
a The expected dimming depth in terms of the base ratio observed by SDO/AIA in the 171, 193, 211, and 335 Å passbands, respectively, with respect to the expansion height for isothermal (black) or adiabatic (color) expansion, assuming that the initial temperature of the corona T0=1.5 MK. b The expected dimming depth with respect to the expansion velocity (see text)
Fig. 22
Fig. 22
SOHO/EIT percentage difference images combined with SOHO/LASCO C2 difference images illustrating the connection between coronal dimmings in the low corona and the CME. Image reproduced with permission from Thompson et al. (2000), copyright by AGU
Fig. 23
Fig. 23
Histograms of CME speed for non-dimming-associated CMEs (white) and the total sample (black). Image reproduced with permission from Reinard and Biesecker (2009), copyright by AAS
Fig. 24
Fig. 24
Comparisons of CME masses inferred from EUV coronal dimmings and white-light coronagraph data. The left panel shows masses predicted from the dimming that are derived from a three-dimensional volume and density modeling in the dimming region and background corona (Aschwanden et al. 2009); the right panel shows predicted masses from the dimming using a DEM method (López et al. 2019). The solid lines mark the 1:1 correspondence level
Fig. 25
Fig. 25
Relation between coronal dimming area and CME mass for dimmings observed on-disk by SDO/AIA (left panel) and off-limb by STEREO/EUVI (right panel). The red (black) lines present the linear fit to the corresponding data points. Images reproduced with permission from [left] Dissauer et al. (2019) and [right] Chikunova et al. (2020), copyright by AAS
Fig. 26
Fig. 26
Examples for the strongest correlations of dimming parameters with the speed of the associated CME. Left: average dimming brightness from base-difference images for dimmings observed on-disk by SDO/AIA, right: dimming area for the same dimming events but observed off-limb by STEREO/EUVI. The red (black) line represents the linear fit to the corresponding data points. The CME speed is derived as the maximum speed that was reached within a distance of 20 solar radii. Images reproduced with permission from [left] Dissauer et al. (2019) and [right] Chikunova et al. (2020), copyright by AAS
Fig. 27
Fig. 27
Exemplary relations between dimming and flare parameters. Static dimming parameters (e.g., dimming area Aϕ, left panel), reflecting the total dimming extent, show the strongest correlations with the flare fluence (FT). Dynamic parameters (e.g., maximal brightness change rate |I˙cu,diff|, right), quantifying how the dimming is changing over time, show the strongest correlations with the soft X-ray peak flux (FP) of the corresponding flare. The blue lines present the linear fit to the corresponding data points. Image reproduced with permission from Dissauer et al. (2018b), copyright by AAS
Fig. 28
Fig. 28
Distributions of the time difference between the onset of the impulsive phase of the dimming and the flare start time (left) and the CME onset time (right). Images reproduced with permission from Dissauer et al. (2018b, 2019), copyright by AAS
Fig. 29
Fig. 29
SOHO/EIT 195 Å difference image at 14:10 UT during SOL1998-05-02 showing the coronal dimming. The contours are the Nançay 236 MHz radio emission at 13:48 UT, which show a radio source along a transequatorial interconnecting loop. At the time of the EIT image showing the coronal dimming, this radio source has already disappeared. Adapted from Pohjolainen et al. (2001)
Fig. 30
Fig. 30
Relation between coronal dimming flux and the reconstructed toroidal (a) and poloidal (b) magnetic flux of the associated ICME measured in-situ at 1 AU for 9 events. Dark and gray symbols indicate measured dimming fluxes determined by two different intensity thresholds used for the detection of the dimming regions. The solid lines show the linear least-squares fit applied to the data pairs in logarithmic scales. The dashed lines show the identity line. Adapted from Qiu et al. (2007)
Fig. 31
Fig. 31
Schematic for the basic eruption scenario, the relevant flux-systems, and their reconnection products. Representative field lines are drawn before, during, and after reconnection from left to right. The basic building blocks, including the erupting magnetic flux rope (MFR), the flare current sheet (thick black line), the flare arcade (FA), and the 2D projection of flux that is being drawn into the flare current sheet (thin dashed line) are indicated in the top row only for clarity. Blue arrows indicate the connectivity changes of the MFR. a Strapping-strapping reconnection for the standard flare model in 3D (Sect. 5.2). Here the legs of two overlying loops convert strapping flux (tan) into MFR flux (blue) and a post-flare loop (red). b Rope-strapping reconnection, where the leg of a rising MFR flux bundle reconnects with strapping flux, adding new poloidal flux to the MFR, and swaps the footprint (Sect. 5.3). c Analogous reconnection with exterior (Sect. 5.4) or open flux (Sect. 5.5) that originally had one leg rooted near the source region and one far from it (magenta), effectively shifting the MFR footprint to an external location which lies at infinity in case of rope-open reconnection. The other footprint can similarly be shifted out of the source region (not shown). The potentially involved leg-leg reconnection of the MFR is topologically similar to strapping-strapping reconnection, with both participating field lines running in the body of the flux rope. Variants of this process are discussed in Sects. 5.1, 5.3, and 6.2
Fig. 32
Fig. 32
Left: Schematic of flux rope, double-J shaped QSLs, and stationary flux-rope dimmings, due to the expansion of the erupting flux rope. Right: Shrinking flux-rope dimmings, due to the expansion and primary leg-leg reconnection of the erupting flux rope
Fig. 33
Fig. 33
Flare ribbons closing completely around stationary flux-rope (twin/core) dimmings in an eruption from NOAA AR 12443 on 2015 Nov 4. The dimmings in the SDO/AIA 304 Å base-difference images in panels (e) and (i) are replotted in panels (d) and (h) in blue and red colors on top of the AIA 1600 Å images, respectively. The closed ribbons also show the growth of the flux rope’s footprints due to the accretion of flux by the flare reconnection of strapping flux. Image reproduced with permission from Wang et al. (2017), copyright by the author(s). The movie in the online supplement shows the event evolution in nine SDO/AIA (E)UV channels along with GOES SXR and Fermi hard X-ray light curves (from Wang et al. 2017)
Fig. 34
Fig. 34
Shrinking flux-rope dimmings with the initial dimmings shown as green contours and the position of the flare ribbons, which partially re-close them, color coded as given in the time bar. Background image is the line-of-sight magnetogram of AR 11504 on 2012 June 14. Image reproduced with permission from Wang et al. (2019), copyright by AAS. The evolution of this event in SDO/AIA along with a movie is shown in Fig. 19
Fig. 35
Fig. 35
Schematic showing the formation of strapping-flux dimmings in the roots of the lifted strapping flux in the presence of a guide field component and the sweeping of the flare ribbons across these dimmings (red filled arrows). The position of the straight QSL sections at the onset of flare reconnection is shown dashed. The underlying strapping-strapping reconnection (Fig. 31a) is here visualized by the change of the light-blue field lines to a flux-rope field line (blue) and a flare-loop field line (red). The erupting flux rope is expected to form flux-rope dimmings in its footprints as well; these are not included here, to emphasize the strapping-flux dimmings
Fig. 36
Fig. 36
Pre-flare dimming (a) and strapping-flux dimming (here called “twin dimming”; b in SDO/AIA 171 Å base-difference images of the eruption of SOL2014-09-10, and the flare ribbons at the onset of the impulsive flare phase in an SDO/AIA 1600 Å image (c). Images adapted from Zhang et al. (2017), copyright by ESO. The movie in the online supplement shows the event evolution in SDO/AIA 171 Å base-difference images (from Zhang et al. 2017)
Fig. 37
Fig. 37
Left: Field lines showing the core of the initial flux rope equilibrium of the CME simulation in Fig. 38 (same data as in panel (a)). Green (red) field lines in the center of the rope are started in the positive (negative) footprint of the rope. The bundles of strapping flux that reconnect with the flux rope in the course of the simulation are visualized by field lines of the same color as the field lines traced from the footprint of the rope leg that reconnects with this strapping flux. The normal component of the magnetogram is displayed in grayscale. Right: Field lines with identical start points as the rope field lines of the left panel in the corresponding potential field (for clarity, only every second of the corresponding field lines is shown in the left panel). These field lines connect to near the footpoints of the strapping field lines in the left panel, indicating that the post-eruption core field of the source region (Fig. 38c, d) approaches the potential field, but does not reach it fully
Fig. 38
Fig. 38
Field lines of an erupting flux rope undergoing rope-strapping reconnection. Green (red) rope field lines are traced from points on a circle at the positive (negative) rope footprint, rainbow-colored ones initially from points on a circle at the rope apex; all of 1/3 the minor flux-rope radius. The latter points move with their fluid elements. Field lines of the strapping flux that reconnects with the rope around the time of panel (c) are shown in (a) and (b) in the same color as the field lines traced from the footprint of the reconnecting rope leg. The bottom plane shows the magnetogram in grayscale. a Initial, unstable force-free equilibrium (from Török and Kliem, 2005). b Eruption of the kink- and torus-unstable flux rope. c Reconnection with strapping flux allows approaching the potential field (compare the green and red field lines with Fig. 37). d Eventually, the erupting rope is completely rooted in the original roots of the strapping flux, analogous to the finding in Gibson and Fan (2008)
Fig. 39
Fig. 39
Schematic showing the formation of moving flux-rope dimmings. The underlying rope-strapping reconnection (Fig. 31b) is here visualized by the change of the cyan flux-rope field line and the light-blue strapping field line to the blue flux-rope field line and the red field line in the outward-extending flare loop arcade. For clarity, this reconnection is visualized only for the bottom flux-rope leg; it happens similarly in the other leg. The outward moving and expanding strapping-flux dimming is also shown. Filled red arrows show the motion of the flare ribbons from the initial position of the QSLs
Fig. 40
Fig. 40
Moving flux-rope dimming and associated flare ribbon evolution in an eruption from AR 12158 (SOL2014-09-10). SDO/AIA 131 Å, 1600 Å, 335 Å base-ratio and IRIS 1400 Å slit-jaw images are displayed (from top to bottom). The characteristic migration of the flux rope’s footprints and associated curved ends of the flare ribbons into the strapping-flux area is most clear in the negative polarity at the east side (ribbon NR), but also visible in the positive polarity at the west side in the 131 Å and 1600 Å images. The movie in the online supplement shows the event evolution in AIA 131 Å, 1600 Å and IRIS 1400 Å observations. Image and movie reproduced with permission from Gou et al. (2023), copyright by the author(s)
Fig. 41
Fig. 41
Schematic of twin exterior dimming formation by interchange reconnection between the legs of the erupting flux (“twisted loop”) and exterior flux (“overlying loop”). Note that each leg of the erupting flux reconnects with a different part of the exterior flux (indicated by two field lines). Images reproduced with permission from Manoharan et al. (1996), copyright by AAS
Fig. 42
Fig. 42
Multiple exterior dimmings in the major eruption SOL2003-10-28 from AR 10486 (areas 1–4, enclosed by red contours). The background images show a SOHO/EIT 195 Å base difference image 50 min after the peak of the X17 flare (left) and a SOHO/MDI magnetogram converted to the radial field component within the white circle (right). Images reproduced with permission from Mandrini et al. (2007), copyright by Springer
Fig. 43
Fig. 43
Numerical simulation of reconnection between erupting flux (rooted in AR 10069) and closed exterior flux (rooted in AR 10079) at a coronal null point (sNP); this reconnection formed an exterior dimming in AR 10079. Additional reconnection with open flux rooted in AR 10083 at another coronal null point (eNP) turns part of the erupting flux into open flux. Image reproduced with permission from Lugaz et al. (2010), copyright by AIP
Fig. 44
Fig. 44
Change from flux-rope dimming to open-flux dimming in Region 2 by reconnection of the leg of the erupting flux-rope (A) rooted in Regions 1 and 2 with the flux (B) of a coronal hole. Image reproduced with permission from Attrill et al. (2006), copyright by Springer
Fig. 45
Fig. 45
A conjectured strapping-flux dimming in SOL2011-10-01 observed as a large secondary dimming (red contours in top-right panel, from Temmer et al. 2017) under high-lying flux rooted in a dominantly positive, extended weak-field area to the south of AR 11305 and in the main negative sunspot of the AR, according to the potential-field source-surface (PFSS) computation in the bottom-left panel (from Krista and Reinard 2013). However, a more detailed, high-resolution PFSS computation (bottom-right panel; C. Downs, private commun.) suggests that part of the flux (pink field lines) is instead rooted in more distributed negative flux labeled P2 to the south of the erupting filament channel. In this case, the secondary dimming is composed of a strapping-flux dimming (D1) and an exterior dimming (D2) that forms in closed exterior flux. Moving flux-rope dimmings (red and blue filled contours) are shown along with the position of the flare ribbons at the peak time of the associated flare (yellow and cyan contours) in the top-left panel (from Temmer et al. 2017)
Fig. 46
Fig. 46
Schematic showing the dimmings that typically form in CMEs from source regions with a null point above a parasitic polarity embedded in closed exterior flux. The flux-rope and strapping-flux dimmings develop asymmetrically; the outer strapping-flux dimming additionally extends into an arc shape if the strapping flux is very strongly sheared. An exterior dimming and associated additional (remote) flare ribbon form at the footprint of the outer-spine flux; the ribbon fully encloses the dimming in some events. A further exterior dimming may form in flux rooted under or near the path of the erupting outer spine. The characteristic circular ribbon, forming at the base of the fan separatrix in such events, is also included. The corresponding magnetic connections, i.e., the spines and fan dome, are not included, to avoid overloading the figure. They are visualized by the yellow field lines in Fig. 51d and also, e.g., in Antiochos (1998), Reid et al. (2012). The changing magnetic connections underlying the dimmings are visualized by the red field lines in Fig. 51b–f
Fig. 47
Fig. 47
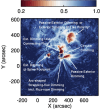
Various dimmings in the eruption under a coronal null point in AR 11283 in SOL2011-09-06 shown in an SDO/AIA 211 Å logarithmic base-ratio image (see color bar for the range of values in the image). These are interpreted as various exterior dimmings, including passive exterior dimmings and as an arc-shaped strapping-flux dimming, which includes the flux-rope dimming of the event in the polarity surrounding the parasitic polarity (compare with Fig. 46). Tentative interpretations are marked with an asterisk. The circular dimming, which formed in place of the circular ribbon, is not yet understood (a tentative interpretation is given in the text). The movie in the online supplement shows the event evolution in SDO/AIA 211 Å direct and logarithmic base-ratio images (adapted from Dissauer et al. 2018a)
Fig. 48
Fig. 48
Various dimmings in the final three major filament eruptions in the sympathetic eruptions in SOL2010-08-01. SDO/AIA 211 Å base-difference images, with the base image at 06 UT, are shown. The movie in the online supplement shows the evolution in AIA 211 Å base difference images (left) along with AIA 304 Å direct images (right)
Fig. 49
Fig. 49
(left panels) Illustration of rope-strapping reconnection (top row) and two forms of secondary leg-leg reconnection (middle and bottom row) in the simulation of Gibson and Fan (2008). (right panels) Footpoints of erupting flux in various snapshots during the simulation representing a proxy of dimmings. The footpoints show the migration into the strapping-flux area (yellow and light blue stripes), due to rope-strapping and the first form of leg-leg reconnection (t110), and the detachment of the erupting flux (closure of dimmings), due to the second form of leg-leg reconnection (t110)
Fig. 50
Fig. 50
Representative snapshots of the SOL2009-02-13 CME simulation from Downs et al. (2025). Together these show core dimming and motion of the dimming region (ac), stretched arcade loops (d) which undergo leg-arcade reconnection to become part of the MFR (e), and interchange reconnection between the leg and open flux (f). See the text for more details. A movie of the simulations and synthetic STEREO/EUVI 195 Å data is shown in the online supplement. STEREO/EUVI 195 Å observations of this event can be found in Fig. 8
Fig. 51
Fig. 51
Illustration of the magnetic reconnection and field topology changes associated with an erupting MFR and their observational counterparts in flare ribbons and dimming regions in the eruption from AR 11283 (SOL2011-09-06). Panel a shows a hot sigmoid in the SDO/AIA 94 Å channel and the co-spatial highly sheared, weakly twisted orange field lines from the extrapolation. Panel b shows the position of the magnetic null point as a green dot and the initial position of the field lines that form the erupting MFR in red. Panel c shows the reconnection of the MFR (red field lines) and its envelope (purple field lines) with ambient field lines (blue) that were initially running just above the fan separatrix associated with the null point. The reconnection proceeds at an X-type reconnection site, where a current sheet (CS) with high values of J/B is formed. Panel d shows that the footprints of the MFR coincide with the end regions of the parallel (double) flare ribbons (PFRs). The circular flare ribbon (CFR) observed in the AIA 304 Å channel can be seen tracing the footpoints of the field lines constituting the fan dome of the null point. Panel e overlays these magnetic field lines onto the arc-shaped dimming region D1 (indicated by the black arrows). This dimming region is thus seen to form along the circular flare ribbon. Panel f depicts the global connectivity in the NFFF, modified around the outer spine by reconnection, and its association with the remote dimming regions marked as D2 and D3. Panels e, f show AIA 211 Å logarithmic base-ratio images in the bottom plane, where white-to-red colors denote decreases in emission, i.e. dimming regions. The red, green, and blue arrows represent the x, y, and z directions, respectively. Adapted from Prasad et al. (2020). A movie of the simulations is shown in the online supplement (from Prasad et al. 2020)
Fig. 52
Fig. 52
Reconnection of an erupting MFR (cyan field lines) with flux around the outer spine (white-yellow-pink field lines rooted in positive flux P1 (corresponding to dimming D3 in Fig. 51f) at the null point of the modeled AR 11283. Black arrows show the reconnection flows. A movie of the simulation is shown in the online supplement. Image and movie reproduced with permission from Jiang et al. (2018), copyright by AAS
Fig. 53
Fig. 53
a A confined Gibson–Low flux rope eruption after 1 h simulation. The identified CME ejecta is shown as a translucent yellow shade. The background shows a transversal plane crossing the source AR with color contours representing the radial wind speed difference with respect to the pre-eruption condition (Alvarado-Gómez et al. 2018). b Decay index n as a function of height (in units of the star radius) for potential field model (source surface at 2.5 star radius) with both starspot and dipole. The bipolar starspot size ρ is fixed at 25. The thin black curve shows the dipole-only case and the colored curves represent different dipole strength g10. The vertical dotted line shows the critical decay index nc = 1.5 and the horizontal dotted lines indicate the critical heights (Sun et al. 2022). A movie of the simulations shown in panel (a) can be found in the online supplement (from Alvarado-Gómez et al. 2018)
Fig. 54
Fig. 54
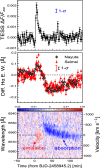
Observations of a stellar filament eruption associated with a superflare on EK Draconis. From top to bottom: Pre-flare subtracted TESS light curve in white light, Hα light curves integrated over ±10 Å around the line center from the Nayuta and Seimei telescopes, and two-dimensional Seimei Hα spectra. Adapted from Namekata et al. (2021)
Fig. 55
Fig. 55
SDO/EVE full-Sun light curves for the flare/CME SOL2012-03-07. The different panels show iron lines of different ionization stages from Fe xxiv (log(T/K)=7.3; top left panel) to Fe ix (log(T/K)=5.8; bottom right panel). The curves show 10-s sampling and are normalized to the pre-flare level, as indicated by the red dashed line and labeled in the panel titles. The vertical line indicates the flare peak time in the GOES 1–8 Å soft X-ray band. Image reproduced with permission from Harra et al. (2016), copyright by the author(s)
Fig. 56
Fig. 56
Coronal dimming event associated with the X5.1 flare/CME SOL2012-03-07. SDO/AIA 193 Å direct (a) and logarithmic base-ratio (b) images showing the flare and the coronal dimming. The red box highlights the region over which the flare light curve shown in (d) (top panel) was calculated. Black arrows mark the dimming regions. c Two CMEs associated with this event observed by EUVI and the COR2 coronagraph onboard STEREO-B. Red contours outline the CME fronts. d Top panel: pre-event subtracted SDO/AIA 193 Å light curves derived from the flaring region (red curve) and the dimming region (blue curve). Middle panel: SDO/EVE Sun-as-a-Star broad-band 150–250 Å light curve. Bottom: pre-event subtracted SDO/EVE irradiance spectra integrated over 10 min during the flare peak (red) and over the maximum dimming depth (blue), as indicated by orange and blue vertical lines and shaded regions in the middle panel. A movie of this figure is shown in the online supplement. Image and movie from Veronig et al. (2021), copyright by the author(s)
Fig. 57
Fig. 57
Two examples of post-flare coronal dimmings detected on Proxima Centauri in XMM-Newton data. Top panels: Background-subtracted 0.2–2 keV X-ray light curves together with weighted spline fits (blue). Red horizontal lines show the adopted quiet levels. Dimming and quiet intervals are highlighted by blue and grey shaded areas. Bottom panels: Simultaneous photometric observations in the U-band shown to estimate the overall variability level. Adapted from Veronig et al. (2021)
Fig. 58
Fig. 58
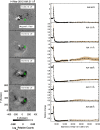
Distributions of characteristic properties of solar (left) and stellar (right) dimmings. From top to bottom: dimming depth, duration, delay between flare peak and dimming start. The solar dimmings are derived from full-Sun SDO/EVE 150–250 Å light curves, the stellar dimmings from XMM-Newton, Chandra and EUVE. Red-coloured dimming duration indicate solar events where the dimming end was not reached within the 12 h observation interval. In the stellar dimmings, most of the durations are lower estimates. Adapted from Veronig et al. (2021)
Fig. 59
Fig. 59
Fe xxi and Fe xii lightcurves of ε Eri from HST observations (February 2015 epoch). Colored data points indicate different methods used to derive the Fe line fluxes. Fitted dimming curves are shown by shaded regions; the solid green line the best fit for Fe xxi. The black light curves (shown for reference) are derived by summing the flux of two of the brightest FUV lines. Image reproduced with permission from Loyd et al. (2022), copyright by the author(s)
Fig. 60
Fig. 60
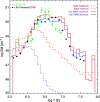
Emission measure distributions of the Sun during the minimum (Apr 1996; blue) and maximum (Dec 1991; red) of the solar cycle; and of ε Eri during the minimum (Feb 2015; blue) and maximum (July 2018; red) of its X-ray cycle based on the analysis of solar magnetic structures (Coffaro et al. 2020). Green and black dots show EM distributions of ε Eri from EUVE spectra of 1993 (Drake et al. 2000) and a Chandra/LETGS spectrum of March 2001 (Sanz-Forcada et al. 2004). Figure reprinted with permission from Coffaro et al. (2020), copyright by ESO
Fig. 61
Fig. 61
Simulation of a Carrington-scale superflare/CME and associated coronal dimming. a ZDI magnetic map of Kappa1 Ceti; b Energized, pre-eruption magnetic field structure; c Area-integrated light curve of mean hot (X-ray) intensity and maximum emissivity; d Total light curve of ambient (EUV) intensity and maximum emissivity. Adapted from Lynch et al. (2019). A movie of the simulation shown in panel (b) can be found in the online supplement (from Lynch et al. 2019)

References

    1. Aarnio AN, Matt SP, Stassun KG (2012) Mass loss in pre-main-sequence stars via coronal mass ejections and implications for angular momentum loss. Astrophys J 760(1):9. 10.1088/0004-637X/760/1/9. arXiv:1209.6410 [astro-ph.SR]
    1. Acton LW (2018) Recalibration of the soft X-ray telescope onboard Yohkoh. Sol Phys 293(10):137. 10.1007/s11207-018-1361-y
    1. Airapetian VS, Barnes R, Cohen O et al (2020) Impact of space weather on climate and habitability of terrestrial-type exoplanets. Int J Astrobiol 19(2):136–194. 10.1017/S1473550419000132. arXiv:1905.05093 [astro-ph.EP]
    1. Alvarado-Gómez JD, Drake JJ, Cohen O et al (2018) Suppression of coronal mass ejections in active stars by an overlying large-scale magnetic field: a numerical study. Astrophys J 862(2):93. 10.3847/1538-4357/aacb7f. arXiv:1806.02828 [astro-ph.SR]
    1. Alvarado-Gómez JD, Drake JJ, Moschou SP et al (2019) Coronal response to magnetically suppressed CME events in M-dwarf stars. Astrophys J Lett 884(1):L13. 10.3847/2041-8213/ab44d0. arXiv:1909.04092 [astro-ph.SR]

LinkOut - more resources