. 2025 Jul 16:16:1559422.
doi: 10.3389/fimmu.2025.1559422. eCollection 2025.

Identification and validation of biomarkers, construction of diagnostic models, and investigation of immunological infiltration characteristics for idiopathic frozen shoulder

Affiliations

Identification and validation of biomarkers, construction of diagnostic models, and investigation of immunological infiltration characteristics for idiopathic frozen shoulder

Han-Tao Jiang et al. Front Immunol. .

Abstract

Background: Idiopathic frozen shoulder (FS) can lead to difficulties in daily activities and significantly impact the quality of life. Early diagnosis and treatment can help alleviate symptoms and restore shoulder function. Therefore, we aimed to explore the diagnostic biomarkers and potential mechanisms of FS from a transcriptomics perspective.

Methods: Total RNA was extracted from tissue samples of 15 FS and 11 controls. At the outset, we conducted differential expression analysis, weighted gene co-expression network analysis (WGCNA), and utilized the cytoHubba plugin, complemented by two machine learning algorithms, receiver operating characteristic (ROC) analysis, and expression level evaluation to identify biomarkers for FS. Subsequently, a nomogram was constructed based on the biomarkers. Additionally, we conducted enrichment and immune infiltration analyses to explore the mechanisms associated with these biomarkers. Finally, we confirmed the expression patterns of the biomarkers at the clinical level through reverse transcription-quantitative polymerase chain reaction (RT-qPCR).

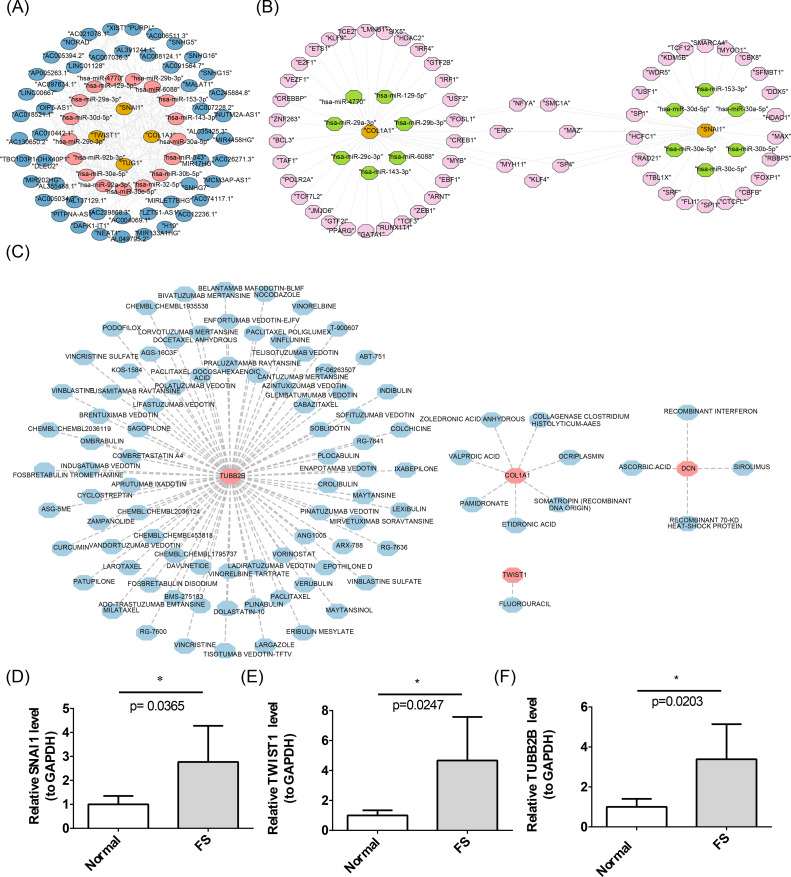
Results: SNAI1, TWIST1, COL1A1, TUBB2B, and DCN were identified as biomarkers for FS. The nomogram constructed based on them had a good predictive value for the occurrence of FS. Except for DCN, the other four genes were upregulated in FS samples, and the expression of SNAI1, TWIST1, and TUBB2B was also observed to be significantly upregulated in RT-qPCR. Moreover, these genes played important roles in pathways such as "ECM receptor interaction" and "lysosome". We also found that the infiltration abundances of 11 types of immune cells were significantly upregulated in the FS samples, and they were positively correlated with each other. Our biomarkers showed strong correlations with these immune cells; DCN generally displayed a negative correlation, while the other four genes were generally positively correlated.

Conclusion: This study established a link between FS biomarkers that have strong diagnostic potential and specific immune responses, highlighting possible targets for diagnosing and treating FS.

Keywords: bioinformatics; frozen shoulder; immune infiltration; nomogram; transcriptomics.


Conflict of interest statement

The authors declare that the research was conducted in the absence of any commercial or financial relationships that could be construed as a potential conflict of interest.

Figures

Figure 1
Figure 1
Identification of DEGs and key module genes. (A) Volcano plot of differentially expressed genes. Red indicates upregulated genes, and green indicates downregulated genes. Each dot represents a gene. The genes marked in the volcano map were the top 10 up-regulated genes and the top 10 down-regulated genes sorted by log2FC. (B) Heatmap of differentially expressed genes. The blue color indicated low expression, and the red color indicated high expression. The bluer the blue color was, the lower the expression was, and the redder the red color was, the higher the expression was. (C) Hierarchical clustering analysis. (D) Selection of the optimal soft threshold power value. The optimal soft threshold power was 9. (D-1) The left panel shows the scale-free model fit index. (D-2) The right panel shows the mean connectivity of these values. (E) Cluster dendrogram of genes enriched based on dissimilarity measure and assigned modules. Clustered into 20 co-expression modules. (F) Heatmap showing the correlation between module genes and FS. The blue color represented a negative correlation, and the red color represented a positive correlation. The darker the color, the stronger the correlation.
Figure 2
Figure 2
Acquisition and enrichment analysis of candidate genes. A total of 1,298 candidate genes were screened out. (A) Identification of candidate genes. (B) GO enrichment analysis of candidate genes. (C) KEGG enrichment analysis of candidate genes. (D) PPI network of candidate genes. (E) Identification of hub genes. A total of 10 hub genes were screened out.
Figure 3
Figure 3
Acquisition of candidate biomarkers. (A, B) Results of the LASSO analysis. Five genes were screened when lambda.min was equal to 0.08578354 and log(lambda) was equal to -2.455928. (C) Results of the Boruta method analysis. Ten genes were screened out. (D) Identification of candidate biomarkers. A total of five candidate biomarkers were obtained.
Figure 4
Figure 4
Prognostic analysis of biomarkers. (A) ROC analysis of candidate biomarkers. (B) Expression analysis of candidate biomarkers. “**” represents P < 0.01, and “***” represents P < 0.001. (C) Construction of the nomogram. (D) Calibration curve for the nomogram. (E) ROC analysis of the nomogram.
Figure 5
Figure 5
Results of GSEA enrichment analysis of biomarkers. (A) Correlation between biomarkers. The blue color represented a negative correlation, and the red color represented a positive correlation. The darker the color, the stronger the correlation. (B) GSEA enrichment analysis results for SNAI1. (C) GSEA enrichment analysis results for TWIST1. (D) GSEA enrichment analysis results for COL1A1. (E) GSEA enrichment analysis results for TUBB2B. (F) GSEA enrichment analysis results for DCN.
Figure 6
Figure 6
Immune cell infiltration. (A) Abundance of 28 immune cell infiltrates in FS and control samples. (B) Differences in immune cell infiltration between FS and control samples. “ns” represents P > 0.05, “*” represents P < 0.05, “**” represents P < 0.01, “***” represents P < 0.001, and “****” represents P < 0.0001. (C) Correlation between differential immune cells. “*” represents P < 0.05, “**” represents P < 0.01, “***” represents P < 0.001. (D) Correlation between biomarkers and differential immune cells. “*” represents P < 0.05, “**” represents P < 0.01, “***” represents P < 0.001.
Figure 7
Figure 7
Construction of molecular networks. (A) The lncRNA-miRNA-mRNA network. The yellow color represents biomarkers, the pink color represents target miRNAs, and the blue color represents lncRNAs. (B) Construction of the TF-mRNA-miRNA network. In the figure, the yellow color represents biomarkers, the pink color represents TFs, and the green color represents miRNAs. (C) Networks of biomarkers and targeted drugs. The pink color represents biomarkers, and the blue color represents drugs. (D-F) Results of RT-qPCR analysis of biomarkers. The error bars in the figure represent the standard deviation. “*” represents P < 0.05.

Similar articles

References

    1. Le HV, Lee SJ, Nazarian A, Rodriguez EK. Adhesive capsulitis of the shoulder: review of pathophysiology and current clinical treatments. Shoulder Elbow. (2017) 9:75–84. doi: 10.1177/1758573216676786, PMID: - DOI - PMC - PubMed
    1. Buchbinder R, Green S, Youd JM, Johnston RV, Cumpston M. Arthrographic distension for adhesive capsulitis (frozen shoulder). Cochrane Database Syst Rev. (2008). doi: 10.1002/14651858.CD007005, PMID: - DOI - PubMed
    1. Wong CK, Levine WN, Deo K, Kesting RS, Mercer EA, Schram GA, et al. Natural history of frozen shoulder: fact or fiction? A systematic review. Physiotherapy. (2017) 103:40–7. doi: 10.1016/j.physio.2016.05.009, PMID: - DOI - PubMed
    1. Walmsley S, Osmotherly PG, Rivett DA. Clinical identifiers for early-stage primary/idiopathic adhesive capsulitis: are we seeing the real picture? Phys Ther. (2014) 94:968–76. doi: 10.2522/ptj.20130398, PMID: - DOI - PubMed
    1. Chan HBY, Pua PY, How CH. Physical therapy in the management of frozen shoulder. Singapore Med J. (2017) 58:685–89. doi: 10.11622/smedj.2017107, PMID: - DOI - PMC - PubMed