

Lactylation-related gene signatures identify glioma molecular subtypes with prognostic, immunological, and therapeutic implications
- PMID: 40740857
- PMCID: PMC12307187
- DOI: 10.3389/fonc.2025.1613423
Lactylation-related gene signatures identify glioma molecular subtypes with prognostic, immunological, and therapeutic implications
Abstract
Introduction: Lactic acid is a by-product of energy metabolism and a signaling molecule that influences tumor progression by regulating immune cell function, angiogenesis, and epigenetic modifications.
Methods: This study analyzed data from the TCGA database on gliomas to systematically elucidate the expression patterns, prognostic value, and functional regulatory networks of lactylation-related genes.
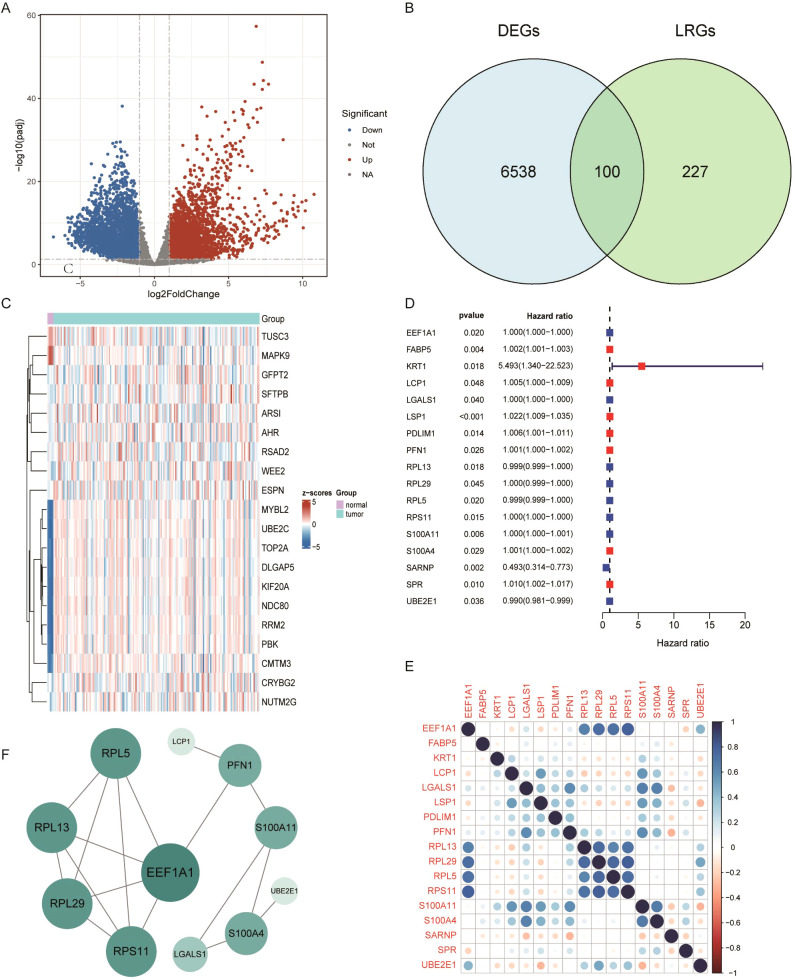
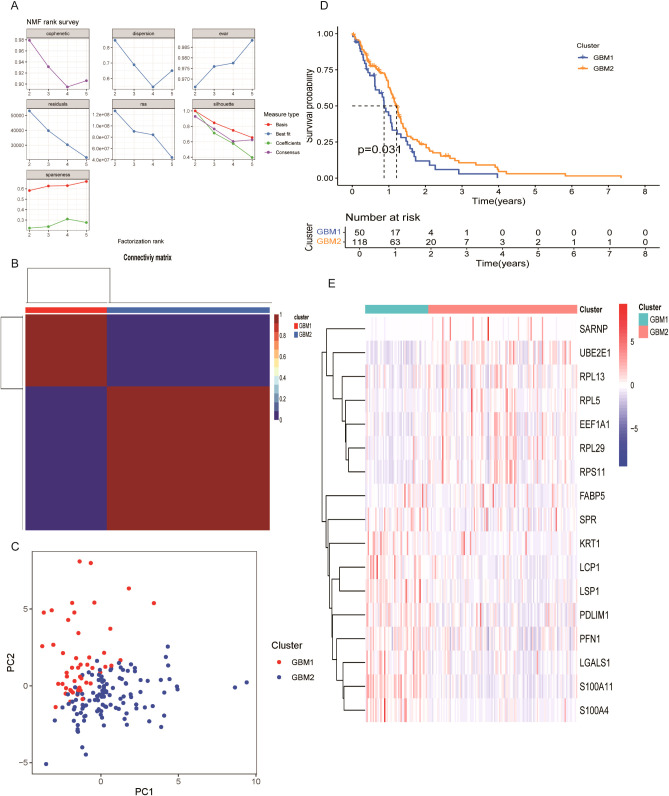
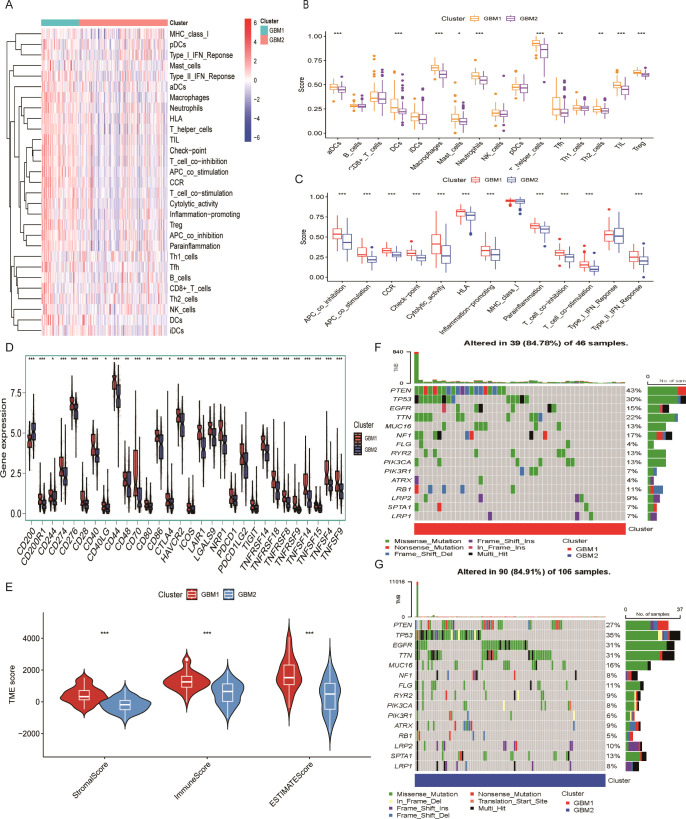
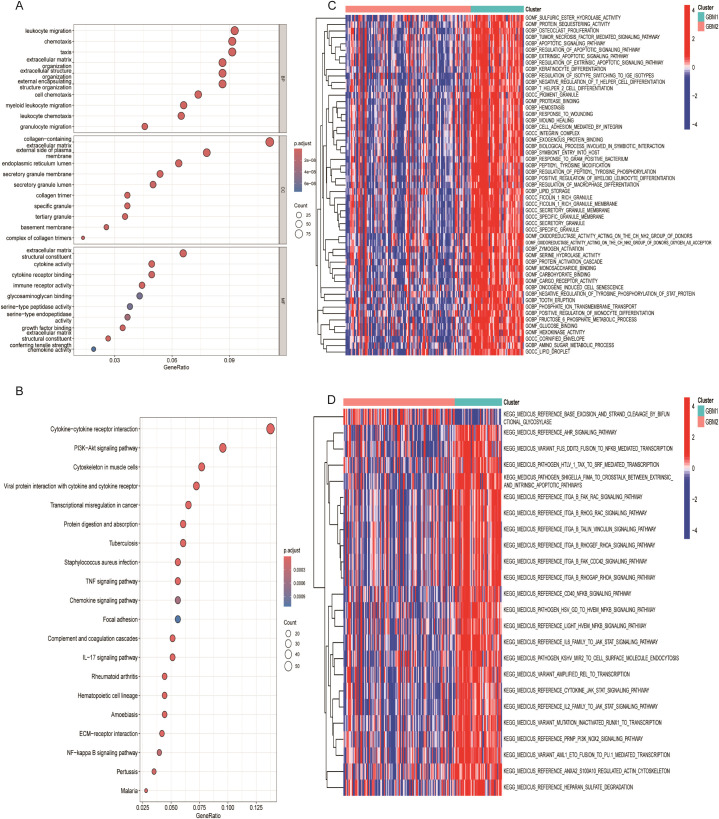
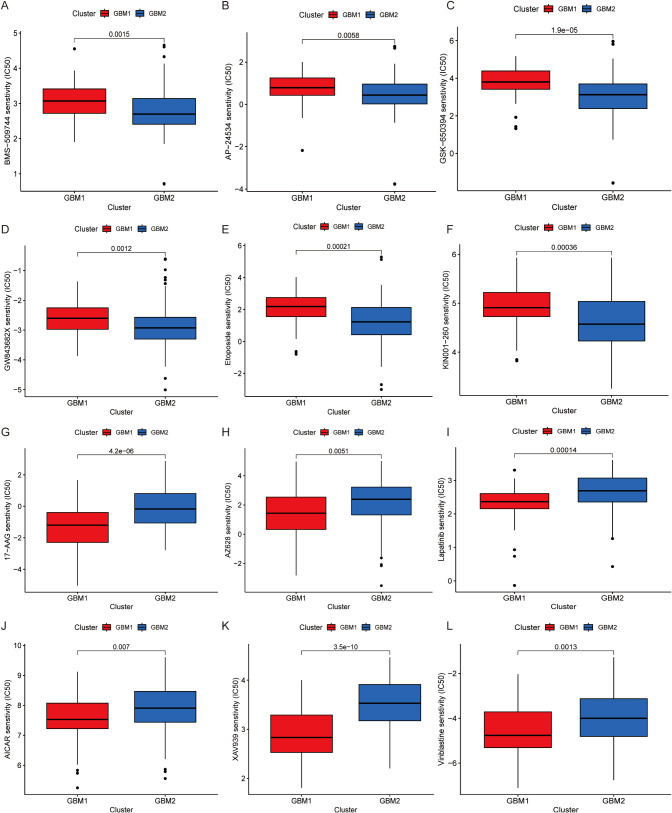
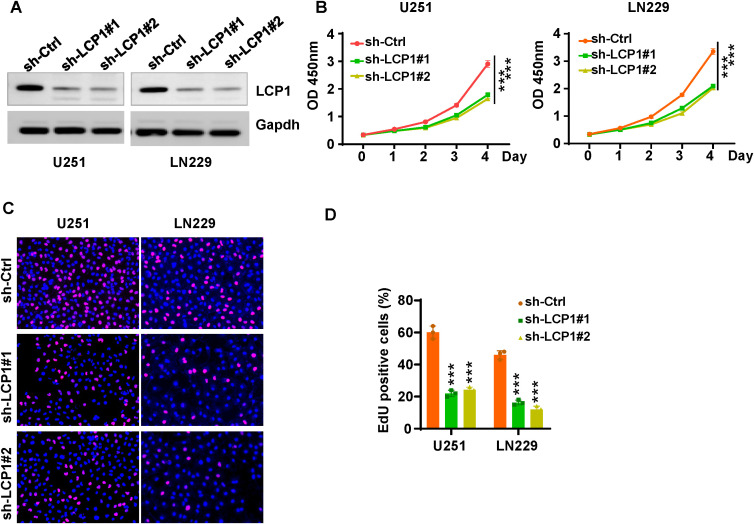
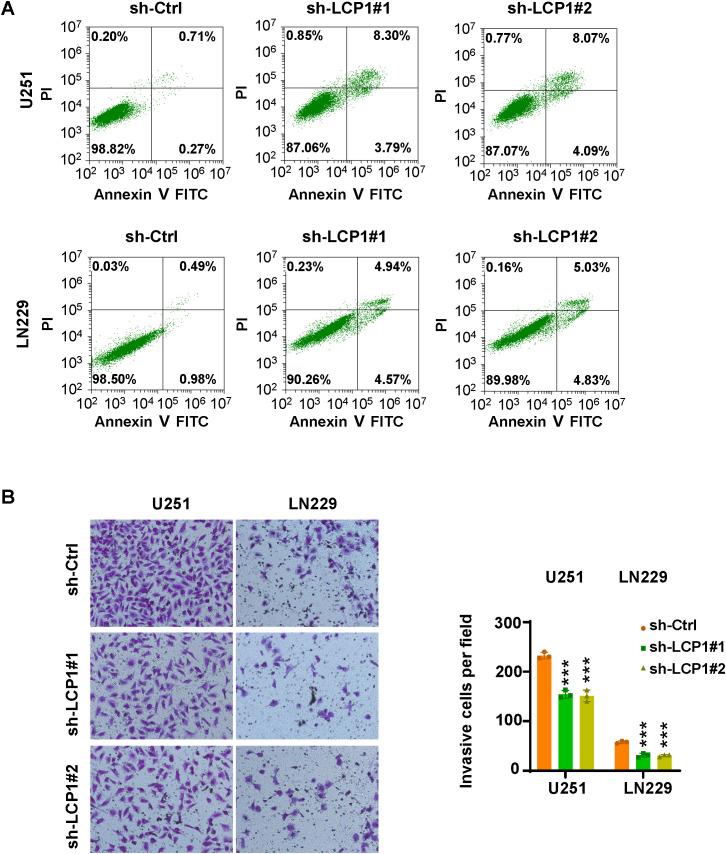
Results: In this study, 17 lactylation-related prognostic genes were identified through the analysis of TCGA-GBM data. Using non- negative matrix factorization (NMF), two GBM subtypes based on lactylation- related genes (LRGs), termed GBM1 and GBM2, were identified. Survival analysis revealed that the overall survival (OS) of the GBM1 group was significantly lower than that of GBM2 group. Furthermore, notable differences were observed in the expression of key GBM-associated molecular markers between the two subtypes. Tumor microenvironment (TME) analysis demonstrated distinct immune landscapes and genomic characteristics between GBM1 and GBM2. The GBM1 group exhibited higher immune cell infiltration and immune function scores compared to GBM2. Drug sensitivity analysis further revealed differences in response to chemotherapy and targeted therapies between the two subtypes. In vitro data demonstrated that LCP1 knockdown suppressed cell proliferation and invasion, and promoted apoptosis in glioma cells.
Conclusion: In conclusion, our study systematically uncovers the significant role of LRGs in GBM molecular subtyping, prognosis evaluation, and therapeutic guidance. These findings offer new insights and potential strategies for the personalized treatment of GBM.
Keywords: glioblastoma; infiltration; lactylation; prognosis; subtype.
Copyright © 2025 Tang, Zhang, Tang, Yuan and Wang.
Conflict of interest statement
The authors declare that the research was conducted in the absence of any commercial or financial relationships that could be construed as a potential conflict of interest.
Figures
Similar articles
-
Unlocking the secret of glioblastoma multiforme: the role of lactylation in tumor progression, drug resistance and immune microenvironment.Cancer Cell Int. 2025 Aug 7;25(1):299. doi: 10.1186/s12935-025-03933-5. Cancer Cell Int. 2025. PMID: 40770332 Free PMC article.
-
New insights for precision treatment of glioblastoma from analysis of single-cell lncRNA expression.J Cancer Res Clin Oncol. 2021 Jul;147(7):1881-1895. doi: 10.1007/s00432-021-03584-9. Epub 2021 Mar 11. J Cancer Res Clin Oncol. 2021. PMID: 33693962 Free PMC article.
-
Lactylation prognostic signature identifies DHCR7 as a modulator of chemoresistance and immunotherapy efficacy in bladder cancer.Front Immunol. 2025 Jul 15;16:1585727. doi: 10.3389/fimmu.2025.1585727. eCollection 2025. Front Immunol. 2025. PMID: 40735323 Free PMC article.
-
Systemic treatments for metastatic cutaneous melanoma.Cochrane Database Syst Rev. 2018 Feb 6;2(2):CD011123. doi: 10.1002/14651858.CD011123.pub2. Cochrane Database Syst Rev. 2018. PMID: 29405038 Free PMC article.
-
Treatment options for progression or recurrence of glioblastoma: a network meta-analysis.Cochrane Database Syst Rev. 2021 May 4;5(1):CD013579. doi: 10.1002/14651858.CD013579.pub2. Cochrane Database Syst Rev. 2021. PMID: 34559423 Free PMC article.
References
-
- Stupp R, Taillibert S, Kanner A, Read W, Steinberg DM, Lhermitte B, et al. Effect of tumor-treating fields plus maintenance temozolomide vs maintenance temozolomide alone on survival in patients with glioblastoma. Jama. (2017) 318:2306–16. doi: 10.1001/jama.2017.18718, PMID: , PMID: - DOI - PMC - PubMed
LinkOut - more resources
Full Text Sources
Miscellaneous