. 2025 Jul 16:12:1618947.
doi: 10.3389/fmed.2025.1618947. eCollection 2025.

The dysbiosis of gut microbiota and dysregulation of metabolites in IgA nephropathy and membranous nephropathy

Affiliations

The dysbiosis of gut microbiota and dysregulation of metabolites in IgA nephropathy and membranous nephropathy

Lei Zhang et al. Front Med (Lausanne). .

Abstract

Introduction: Immunoglobulin A nephropathy (IgAN) and membranous nephropathy (MN) are among the most common forms of primary glomerular diseases, with a rising global incidence. Despite their clinical importance, the underlying pathogenesis of these diseases and the development of reliable non-invasive diagnostic tools remain inadequately understood. Accumulating evidence suggests that gut microbiota and its associated metabolites may play a crucial role in the development of kidney diseases via the gut-kidney axis. However, comprehensive studies integrating both microbiome and metabolomic data in IgAN and MN are still limited.

Methods: In this study, we performed integrated metagenomic sequencing and untargeted metabolomic profiling to investigate alterations in gut microbial composition and systemic metabolic changes associated with IgAN and MN. Fecal samples were collected from 24 patients with IgAN, 20 patients with MN, and 17 healthy controls. Microbial diversity and composition were assessed using metagenomic analysis, while metabolic profiles were evaluated through untargeted LC -MS-based metabolomics. Multivariate statistical analyses and biomarker modeling were employed to identify discriminative features and evaluate diagnostic performance. Microbiota-metabolite correlation networks were constructed to explore potential mechanistic links.

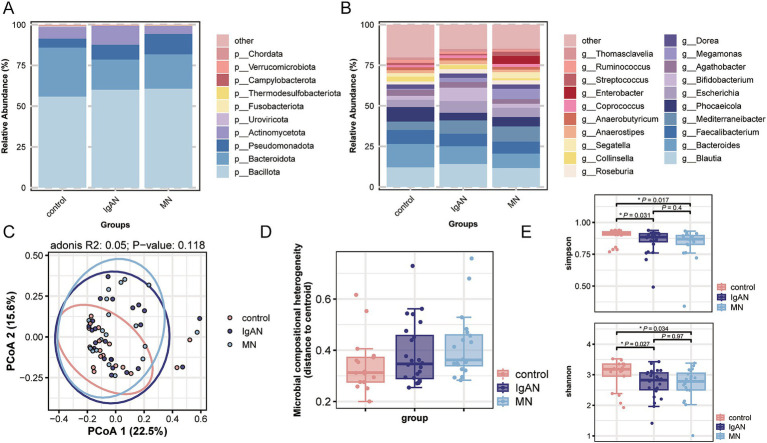
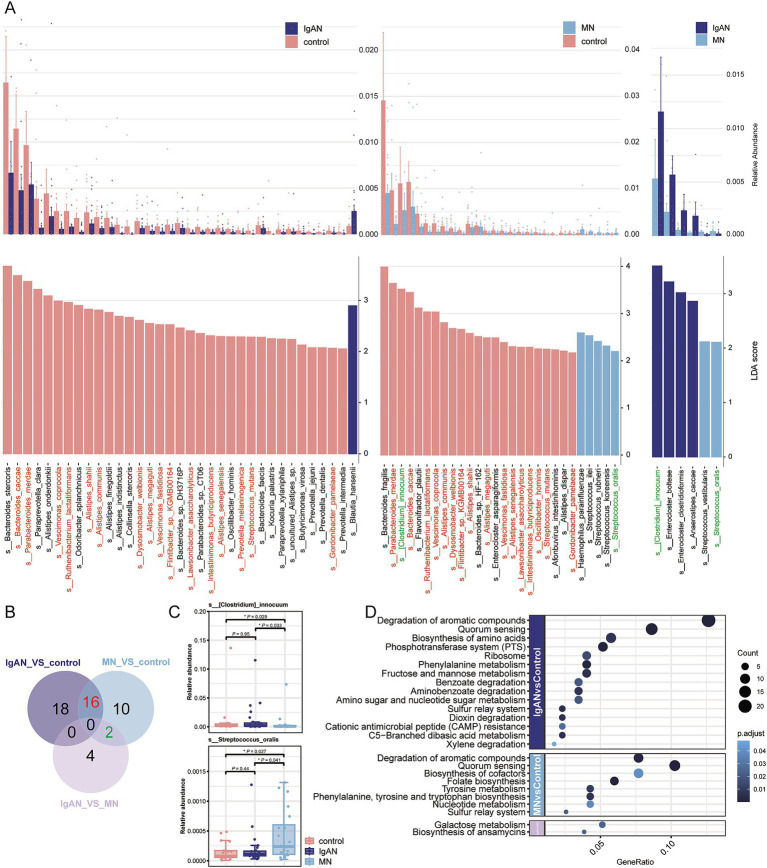
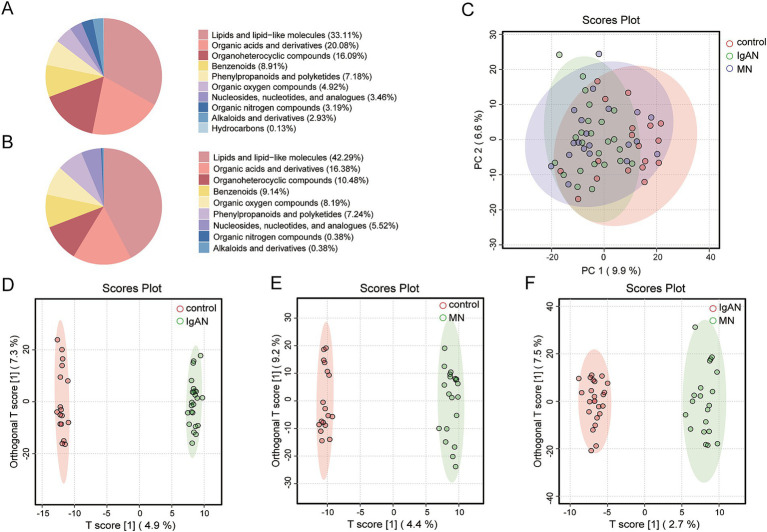
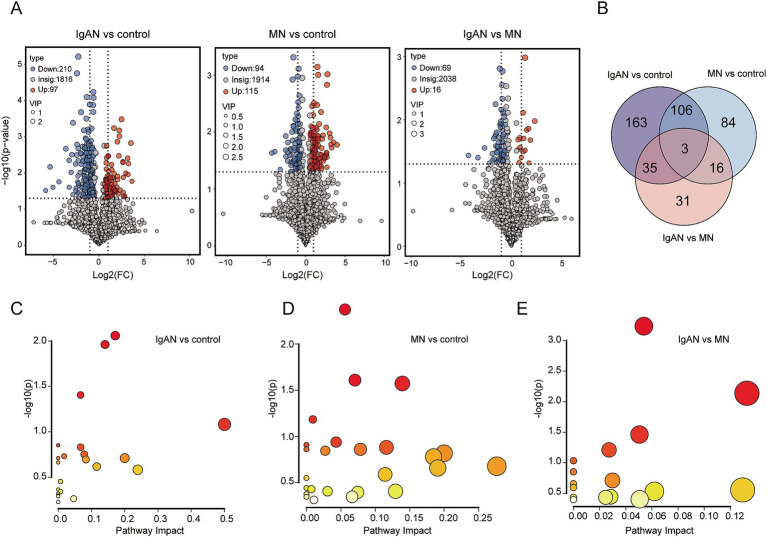
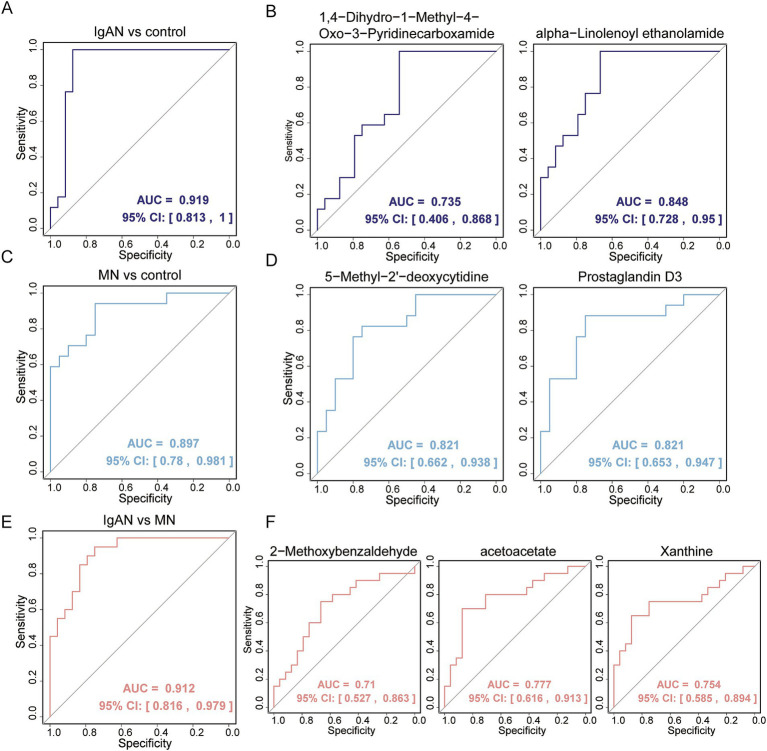
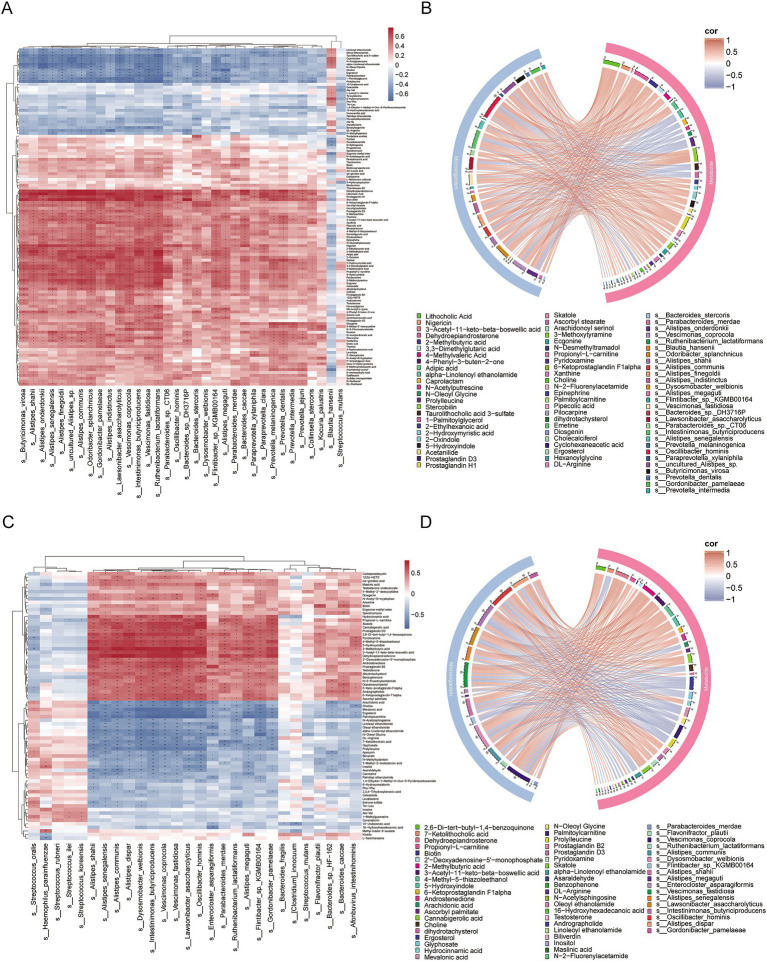
Results: Metagenomic analysis showed that both the IgAN and MN groups had significantly reduced α-diversity. Although β-diversity analysis did not reveal significant differences between the three groups, the IgAN and MN groups exhibited higher sample dispersion than the control group. Notably, both IgAN and MN patients showed a decrease in the abundance of certain specific microbial taxa. A total of 34 and 28 differentially abundant microbial species were identified in IgAN and MN, respectively, compared to healthy controls, with 16 taxa consistently downregulated in both disease groups. Notably, Streptococcus oralis was significantly enriched in the MN group, while [Clostridium] innocuum was markedly depleted. Metabolomic profiling identified 307 and 209 differentially abundant metabolites in IgAN and MN, respectively. Dipeptides (e.g., prolylleucine) were consistently upregulated, while the levels of certain short-chain fatty acids (SCFA) were reduced. Multivariate biomarker models demonstrated excellent diagnostic performance, achieving area under the curve (AUC) of 0.919 (IgAN vs. control), 0.897 (MN vs. control) and 0.912 (IgAN vs. MN), surpassing individual metabolite markers.

Discussion: Our findings highlight significant alterations in gut microbial composition and systemic metabolite profiles in both IgAN and MN patients compared to healthy individuals. The consistent reduction in microbial diversity and SCFA-producing taxa, along with characteristic changes in metabolic signatures, supports the involvement of the gut-kidney axis in disease pathogenesis. The diagnostic models developed in this study provide promising non-invasive biomarkers for distinguishing IgAN and MN with high accuracy. These results contribute novel insights into the microbe-metabolite interplay in glomerular diseases and offer potential targets for future diagnostic and therapeutic strategies.

Keywords: IgA nephropathy; biomarker; gut microbiota; membranous nephropathy; metabolomics.


Conflict of interest statement

The authors declare that the research was conducted in the absence of any commercial or financial relationships that could be construed as a potential conflict of interest.

Figures

Figure 1
Figure 1
Metagenomic species annotation. (A) Stacked bar chart showing the average relative abundance of the top 10 phyla in each group, reflecting the phylum-level microbiota composition across IgAN, MN and controls; (B) Stacked bar chart showing the average relative abundance of the top 20 genera in each group, reflecting the genus-level microbiota composition across IgAN, MN and controls; (C) PCoA based on genus-level microbial composition, with group differences assessed by PERMANOVA. The adonis results showed R2 = 0.05 and p-value = 0.118; (D) Box plot of β-diversity (Beta-dispersion) at the genus level (no significant differences between groups); (E) Box plot of α-diversity (Simpson and Shannon index) at the genus level.
Figure 2
Figure 2
Metagenomic differential analysis. (A) LEfSe analysis results showing significantly different taxa among the IgAN vs. control, MN vs. control, and IgAN vs. MN groups (LDA score > 2, p < 0.05). The upper panel displays the relative abundance bar plots, while the lower panel shows the corresponding LDA scores. (B) Venn diagram summarizing the overlap of significantly different taxa among the three pairwise comparisons. Shared taxa between IgAN and MN (vs. controls) are highlighted in red, suggesting potentially common microbial alterations. Taxa shared between MN vs. control and IgAN vs. MN are marked in green. These taxa are consistently color-coded in panel A for cross-reference; (C) Box plots showing the relative abundance of two representative taxa with disease-specific alterations: Streptococcus oralis, significantly enriched in MN, and [Clostridium] innocuum, significantly depleted in MN, compared to controls and IgAN. (D) Bubble plot illustrating KEGG pathway enrichment analysis of differentially abundant KO genes. Bubble size represents the number of enriched KO terms within each pathway, while color intensity reflects the statistical significance of enrichment (p value), revealing distinct functional disturbances in the gut microbiome across disease groups.
Figure 3
Figure 3
Metabolite classification and multivariate statistical analysis. (A) Pie chart of Class I metabolite classification in positive ion mode; (B) Pie chart of Class I metabolite classification in negative ion mode; (C) PCA score plot for IgAN, MN and control groups. The figure illustrates the distribution of samples among the IgAN, MN and control groups, with IgAN represented in green, MN in blue, and controls in red; (D) OPLS-DA score plot for IgAN vs. control. This model was employed to identify metabolite-level differences between the IgAN and control groups. The model’s goodness-of-fit metrics were R2X = 0.198 and R2Y = 0.998, with a predictive ability of Q2 = 0.478; (E) OPLS-DA score plot for MN vs. control. This model was employed to identify metabolite-level differences between the MN and control groups. The model’s goodness-of-fit metrics were R2X = 0.232 and R2Y = 0.995, with a predictive ability of Q2 = 0.32; (F) OPLS-DA score plot for IgAN vs. MN. This model was employed to identify metabolite-level differences between the IgAN and MN groups. The model’s goodness-of-fit metrics were R2X = 0.142 and R2Y = 0.981, with a predictive ability of Q2 = 0.156.
Figure 4
Figure 4
Differential metabolite analysis and enriched metabolic pathway analysis. (A) Volcano plots of metabolites between IgAN vs. control, MN vs. control and IgAN vs. MN. The highlighted points in the figure represent significantly differential metabolites selected based on the criteria of Variable Importance in Projection (VIP) > 1.0, log2 fold change (Log2 FC) ≥ 1 and statistical significance with p- value < 0.05. Blue represents downregulated differential metabolites, and red represents upregulated differential metabolites; (B) Venn diagram of differential metabolites. The numbers in the diagram represent the number of overlapping differential metabolites between groups or the unique differential metabolites in each group; (C) Metabolic pathway topology map for IgAN vs. control. The y-axis represents the -log(p) value from pathway enrichment analysis, and the x-axis represents the impact factor from topology analysis; (D) Metabolic pathway topology map for MN vs. control; (E) Metabolic pathway topology map for IgAN vs. MN.
Figure 5
Figure 5
Evaluation of fecal metabolic biomarkers in distinguishing disease patients from healthy controls and in differentiating between two kidney different diseases. (A) ROC analysis of multivariable biomarker combinations for distinguishing IgAN from control, with an AUC value of 0.919; (B) ROC analysis of univariable biomarkers for distinguishing IgAN from control, including 1,4-Dihydro-1-Methyl-4-Oxo-3-Pyridinecarboxamide and alpha-Linolenoyl ethanolamide, with AUC values of 0.735 and 0.848, respectively; (C) ROC analysis of multivariable biomarker combinations for distinguishing MN from control, with an AUC value of 0.897; (D) ROC analysis of univariable biomarkers for distinguishing MN from control, including 5-Methyl-2′-deoxycytidine and Prostaglandin D3, both with AUC values of 0.821; (E) ROC analysis of multivariable biomarker combinations for distinguishing IgAN from MN, with an AUC value of 0.912; (F) ROC analysis of univariable biomarkers for distinguishing IgAN from MN, including 2-Methoxybenzaldehyde, acetoacetate and Xanthine, with AUC values of 0.71, 0.777 and 0.754, respectively.
Figure 6
Figure 6
Correlation analysis between differentially abundant microorganisms and differentially abundant metabolites. (A) Heatmap of correlations between differentially abundant microorganisms and differentially abundant metabolites in IgAN vs. control. The colors in the heatmap represent the strength and direction of correlations, with red indicating positive correlations and blue indicating negative correlations. Statistical significance of the correlations is indicated by asterisks: an asterisk ‘*’ indicates 0.01 < p < 0.05, while two asterisks ‘**’ indicate p < 0.01. No significance is marked with an empty space; (B) Chord diagram of the correlation between differentially abundant microorganisms and differentially abundant metabolites in IgAN vs. control, based on FDR-corrected significance (p < 0.05) and strong correlation (|r| > 0.6). The chord colors indicate the strength and direction of correlations, with red representing positive correlations and blue representing negative correlations, thereby facilitating the identification of key microbe-metabolite interaction pairs; (C) Heatmap of correlations between differentially abundant microorganisms and differentially abundant metabolites in MN vs. control; (D) Chord diagram of the correlation between differentially abundant microorganisms and differentially abundant metabolites in MN vs. control, based on FDR-corrected significance (p < 0.05) and strong correlation (|r| > 0.6).

Similar articles

References

    1. Tao P, Huo J, Chen L. Bibliometric analysis of the relationship between gut microbiota and chronic kidney disease from 2001–2022. Integr Med Nephrol Androl. (2024) 11:17. doi: 10.1097/IMNA-D-23-00017 - DOI
    1. Chu C, Behera TR, Huang Y, Qiu W, Chen J, Shen Q. Research progress of gut microbiome and diabetic nephropathy. Front Med (Lausanne). (2024) 11:1490314. doi: 10.3389/fmed.2024.1490314, PMID: - DOI - PMC - PubMed
    1. Lin W, Mousavi F, Blum BC, Heckendorf CF, Moore J, Lampl N, et al. Integrated metabolomics and proteomics reveal biomarkers associated with hemodialysis in end-stage kidney disease. Front Pharmacol. (2023) 14:1243505. doi: 10.3389/fphar.2023.1243505, PMID: - DOI - PMC - PubMed
    1. Wang YN, Zhang ZH, Liu HJ, Guo ZY, Zou L, Zhang YM, et al. Integrative phosphatidylcholine metabolism through phospholipase A(2) in rats with chronic kidney disease. Acta pharmacologica Sinica. (2023) 44:393–405., PMID: - PMC - PubMed
    1. Zhao H, Zhao T, Li P. Gut microbiota-derived metabolites: a new perspective of traditional Chinese medicine against diabetic kidney disease. Integr Med Nephrol Androl. (2024) 11:24. doi: 10.1097/IMNA-D-23-00024 - DOI

LinkOut - more resources