Review
. 2025 Jul 16:12:1551894.
doi: 10.3389/fmed.2025.1551894. eCollection 2025.

A state-of-the-art review of diffusion model applications for microscopic image and micro-alike image analysis

Affiliations
Review

A state-of-the-art review of diffusion model applications for microscopic image and micro-alike image analysis

Yan Liu et al. Front Med (Lausanne). .

Abstract

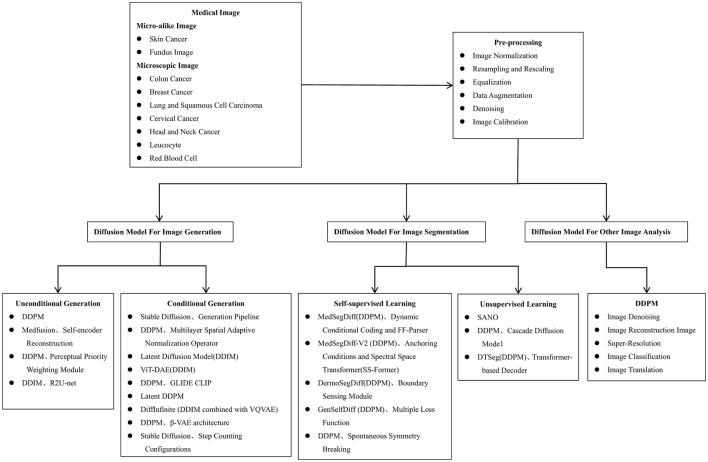
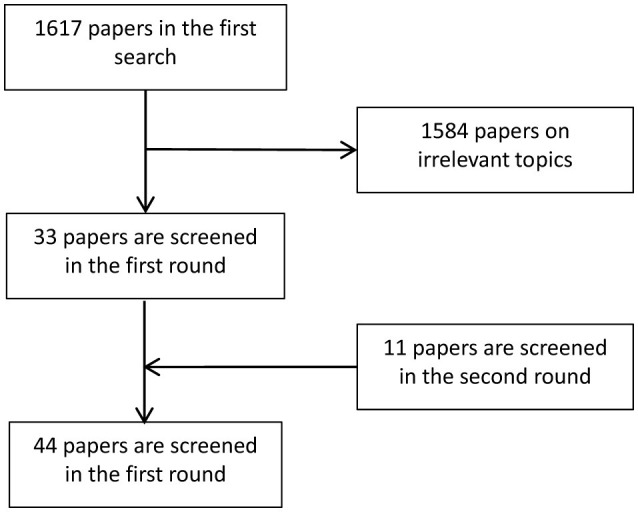
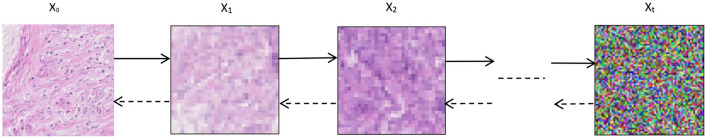
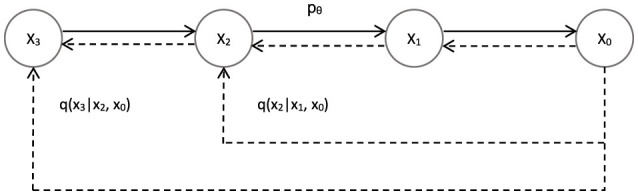
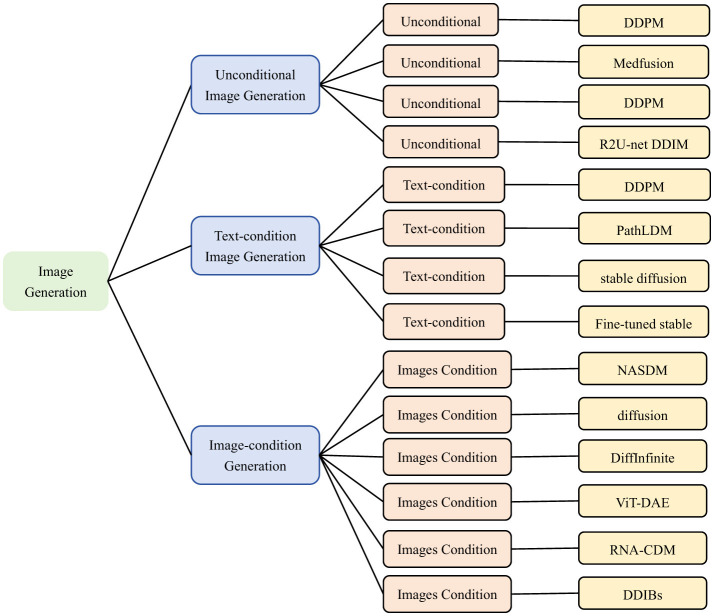
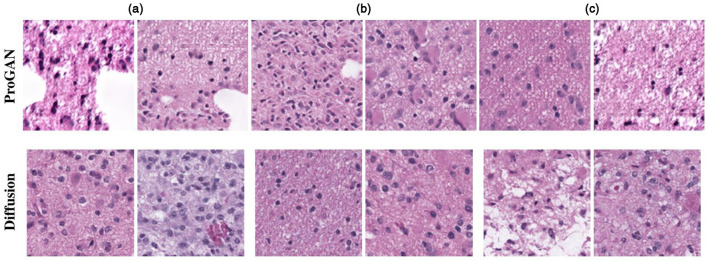
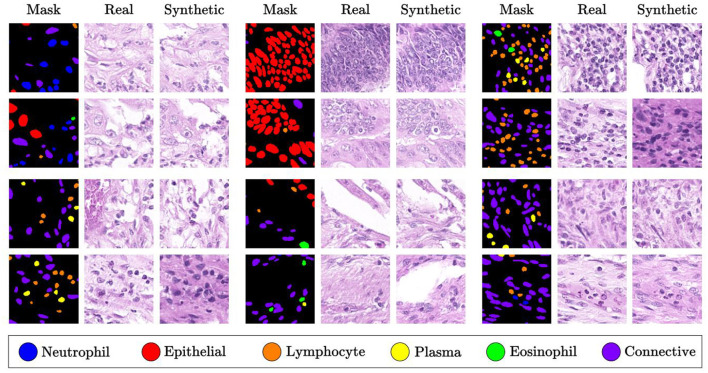
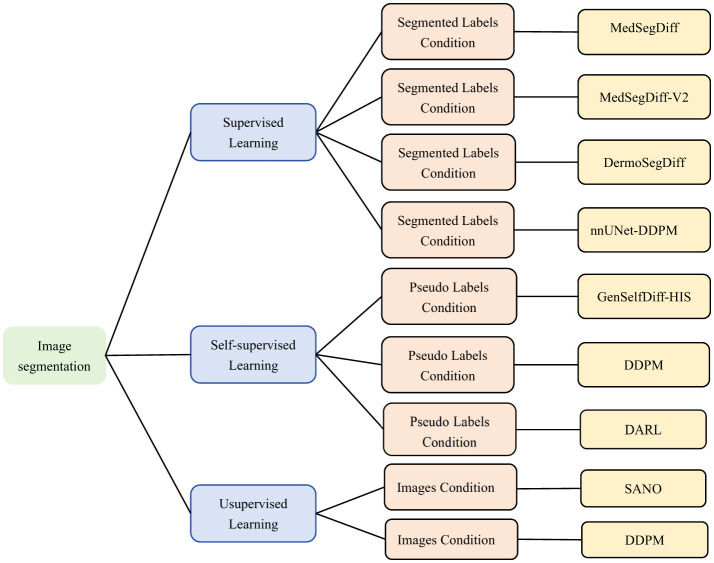
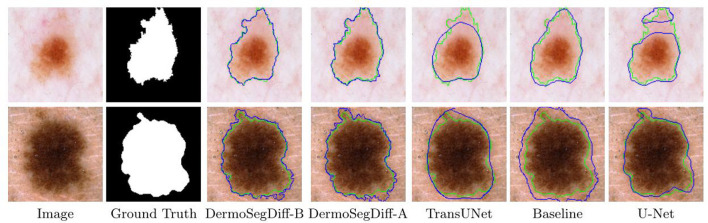
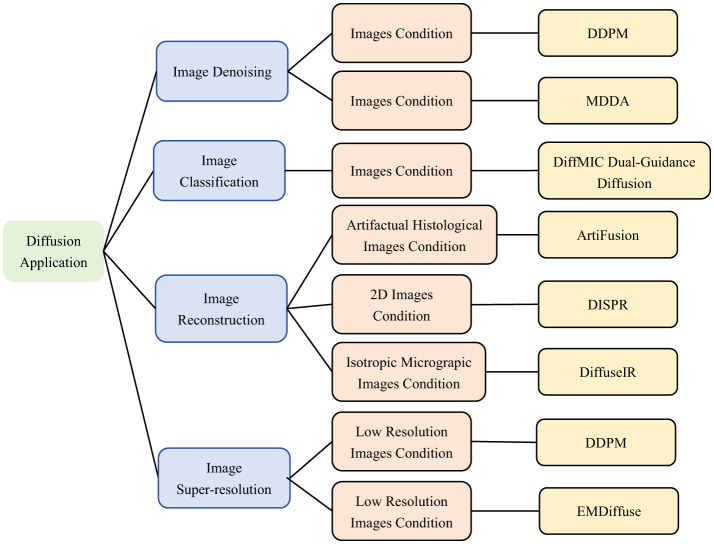
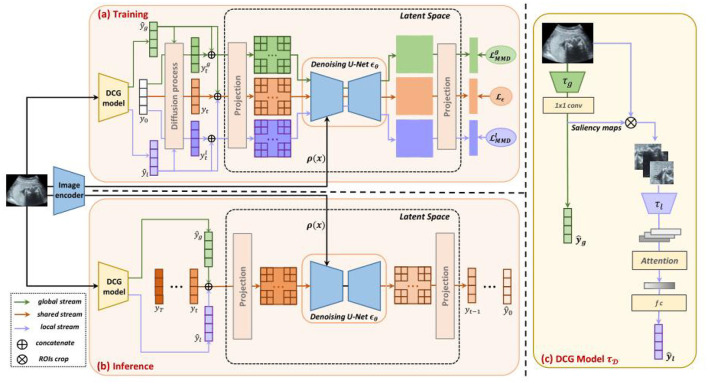
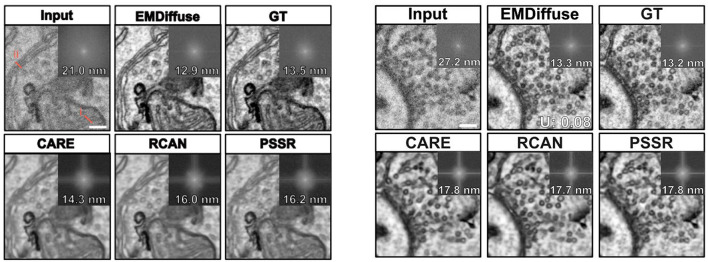
Diffusion models, a class of deep learning models based on probabilistic generative processes, progressively transform data into noise and then reconstruct the original data through an inverse process. Recently, diffusion models have gained attention in microscopic image analysis for their ability to process complex data, extract valuable information, and enhance image quality. This review provides an overview of diffusion models in microscopic images and micro-alike images, focusing on three commonly used models: DDPM, DDIM, and SDEs. We explore their applications in image generation, segmentation, denoising, classification, reconstruction and super-resolution. It shows their notable advantages, particularly in image generation and segmentation. Through simulating the imaging process of biological samples under the microscope, diffusion model can generate high-quality synthetic microscopic images. The generated images serve as a powerful tool for data augmentation when training deep learning models. Diffusion model also excels in microscopic image segmentation. It enables to accurately segment different cellular regions and tissue structures by simulating the interactions between pixels in an image. The review includes 31 papers, with 13 on image generation, nine on segmentation, and the remainder on other applications. We also discuss the strengths, limitations, and future directions for diffusion models in biomedical image processing.

Keywords: diffusion model; image analysis; image generation; image segmentation; micro-alike image; microscopic image.


Conflict of interest statement

The authors declare that the research was conducted in the absence of any commercial or financial relationships that could be construed as a potential conflict of interest. The author(s) declared that they were an editorial board member of Frontiers, at the time of submission. This had no impact on the peer review process and the final decision.

Figures

Figure 1
Figure 1
Histopathologic image of intestines tissue sections observed under the microscope.
Figure 2
Figure 2
Examples of cellular images displaying various abnormalities. From left to right these are hypersegmentation, D..ohle bodies and hypergranulation of neutrophil. Reproduced with permission from “Examples of images of cells with different abnormalities” by Louise Zettergren and Fanny Nilsson, licensed under CC BY 4.0.
Figure 3
Figure 3
Representative images of various melanoma, highlighting differences in lesion appearance, including variations in type, size, color, and shape. Reproduced with permission from “Synthetic melanoma images generated by the stable diffusion model after fine-tuning it with melanoma images using the input text prompt “melanoma””, by Mohamed Akrout, Bálint Gyepesi, Péter Holló, Adrienn Poór, Blága Kincsõ, Stephen Solis, Katrina Cirone, Jeremy Kawahara, Dekker Slade, Latif Abid, Máté Kovács and István Fazekas, licensed under CC BY 4.0.
Figure 4
Figure 4
Fundus images of a 70-year-old woman with an ERM. (A) The retinal nerve fiber layer (RNFL) defect is difficult to detect in the ocular fundus image obtained by a conventional fundus camera (A). (B)Epiretinal membrane can be seen in OCT images. Adapted with permission from “Fundus images of a 70-year-old woman with an ERM” by Hiroto Terasaki, Shozo Sonoda, Masatoshi Tomita and Taiji Sakamoto, licensed under CC BY 4.0.
Figure 5
Figure 5
The algorithmic process of using diffusion models for microscopic image analysis, encompassing stages such as image acquisition, pre-processing, image generation, segmentation, and other image analysis methods.
Figure 6
Figure 6
Flow chart illustrating the screening process for selecting relevant papers.
Figure 7
Figure 7
Denoising Diffusion Probabilistic Models. x0xt is the forward process of DDPM, xtx0 is the reverse process of DDPM.
Figure 8
Figure 8
Skip-step sampling of DDIM: non-Markov chain. Breaking the Markov assumption of the model's original forward model, a specific backward model is found that makes that backward process deterministic.
Figure 9
Figure 9
Classification of microscopic image generation based on diffusion model. Unconditional Image Generation: (3, 52, 55, 56). Text-condition Image Generation: (59, 62, 67, 70). Images-condition Image Generation: (24, 73, 78, 82, 85). We use the following abbreviations in the architecture column: Medfusion, Medical Image Fusion; PathLDM, Pathology Latent Diffusion Model; NASDM, Nuclei-Aware Semantic Diffusion Models; DiffInfinite(Diffusion-based Infinite Mask-Image Synthesis; ViT-DAE, Vision Transformer-driven Diffusion Autoencoder; RNA-CDM, RNA-Conditional Diffusion Mode; DDIBs, Dual Diffusion Implicit Bridges.
Figure 10
Figure 10
Results of histopathological image generation using the algorithm presented in (52). Reproduced with permission from “Selection of generated patches with diffusion and ProGAN models” by Puria Azadi Moghadam, Sanne Van Dalen, Karina C. Martin, Jochen Lennerz, Stephen Yip, Hossein Farahani and Ali Bashashati, licensed under arXiv.org perpetual, non-exclusive license 1.0.
Figure 11
Figure 11
Synthetic images generated from masks for each type of nuclei, as described in (73). Reproduced with permission from “Qualitative Analysis” by Aman Shrivastava and P. Thomas Fletcher, licensed under CC BY 4.0.
Figure 12
Figure 12
Classification of microscopic image segmentation based on diffusion model. Supervised Learning (93, 96, 98), (100), Self-supervised Learning (104, 108, 110), Unsupervised Learning (112, 113). We use the following abbreviations in the architecture column: MedSegDiff, Medical Image Segmentation with Diffusion Probabilistic Model; MedSegDiff-V2, Diffusion-based Medical Image Segmentation with Transformer; DermoSegDiff, A Boundary-aware Segmentation Diffusion Model; GenSelfDiff-HIS, Generative Self-Supervision Diffusion Model; DARL, Diffusion Adversarial Representation Learning.
Figure 13
Figure 13
Visual comparisons of different methods on the ISIC 2018 skin lesion dataset. Reproduced with permission from “Visual comparisons of different methods on the ISIC 2018 skin lesion dataset. Ground truth boundaries are shown in green, and predicted boundaries are shown in blue” by Afshin Bozorgpour, Yousef Sadegheih, Amirhossein Kazerouni, Reza Azad and Dorit Merhof, licensed under CC BY 4.0.
Figure 14
Figure 14
Classification of Diffusion based model Applications.Including image Denoising (26, 119), image Classification (121), image Reconstruction (122, 125, 129), image Super-Resolution (131, 133). We use the following abbreviations in the architecture column: MDDA, Multiscale Diffusive and Denoising Aggregation Mechanism; DiffMIC, Dual-Guidance Mechanism; ArtiFusion, Artifact Restoration with Diffusion Probabilistic Models; DISPR, Diffusion-Based Image Shape Prediction and Reconstruction; DiffuseIR, Diffusion Models for Isotropic Reconstruction of 3D Microscopic Images; EMDiffuse, Expectation-Maximization Diffusion Model.
Figure 15
Figure 15
Dual-guidance mechanism of DiffMIC. Reproduced with permission from “Overview of our DiffMIC framework” by Yijun Yang, Huazhu Fu, Angelica I. Aviles-Rivero, Carola-Bibiane Schönlieb and Lei Zhu, licensed under CC BY 4.0.
Figure 16
Figure 16
Left: Comparison of the denoising ability of EMDiffus-n with CARE, PSSR and RCAN. Right: Comparison of EMDiffus-r super-resolution with CARE, PSSR and RCAN. Top-right of each panel is the Fourier power spectrum. Adapted with permission from “EMDiffuse exhibits excellent denoising capability and generates images with high-resolution ultrastructural details” by Chixiang Lu, Kai Chen, Heng Qiu, Xiaojun Chen, Gu Chen, Xiaojuan Qi and Haibo Jiang licensed under CC BY 4.0.

Similar articles

References

    1. Gurcan MN, Boucheron LE, Can A, Madabhushi A, Rajpoot NM, Yener B. Histopathological image analysis: A review. IEEE Rev Biomed Eng. (2009) 2:147–71. 10.1109/RBME.2009.2034865 - DOI - PMC - PubMed
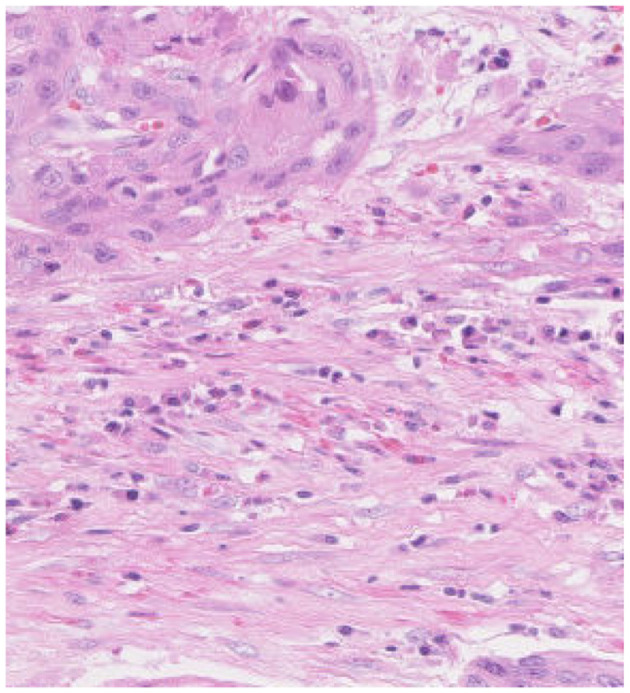
    1. Basavanhally A, Agner S, Alexe G, Bhanot G, Ganesan S, Madabhushi A. Manifold learning with graph-based features for identifying extent of lymphocytic infiltration from high grade, her2+ breast cancer histology. New York: Image Anal Appl Biol (in Conjunction MICCAI). (2008). Available online at: http://www.miaab.org/miaab-2008-papers/27-miaab-2008-paper-21.pdf (accessed March, 2024).
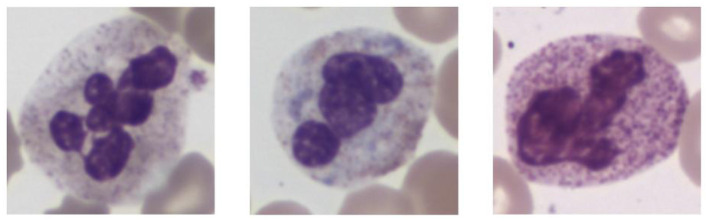
    1. Zettergren L, Nilsson F. Generation of synthetic white blood cell images using denoising diffusion (Master's Theses in Mathematical Sciences: ). Lund University (2023).
    1. Nketia TA, Sailem H, Rohde G, Machiraju R, Rittscher J. Analysis of live cell images: Methods, tools and opportunities. Methods. (2017) 115:65–79. 10.1016/j.ymeth.2017.02.007 - DOI - PubMed
    1. Santhi N, Pradeepa C, Subashini P, Kalaiselvi S. Automatic identification of algal community from microscopic images. Bioinform Biol Insights. (2013) 7:BBI-S12844. 10.4137/BBI.S12844 - DOI - PMC - PubMed

LinkOut - more resources