Topographic associations of hyperreflective materials in diabetic retinopathy: a multimodal correlation with microvascular pathology, structural remodeling and systemic metabolic dysregulation
- PMID: 40740946
- PMCID: PMC12307468
- DOI: 10.3389/fmed.2025.1619819
Topographic associations of hyperreflective materials in diabetic retinopathy: a multimodal correlation with microvascular pathology, structural remodeling and systemic metabolic dysregulation
Abstract
Background: Hyperreflective materials (HRMs), enigmatic biomarkers observed in diabetic retinopathy (DR), exhibit poorly characterized pathophysiological origins and clinical implications.
Methods: This retrospective cross-sectional study investigates the spatial distribution patterns of HRMs subtypes and their integrative relationships with retinal microvascular architecture, structural remodeling, and systemic metabolic parameters in 205 DR eyes. HRMs were systematically classified via multimodal optical coherence tomography angiography (OCTA) analysis, incorporating topographic localization (inner vs. outer retinal), reflectivity profiles, morphometric dimensions, posterior shadowing artifacts, and decorrelation signal. Quantitative correlations were established between HRMs subtypes and OCTA-derived vascular parameters (intraretinal microvascular abnormalities [IRMA], non-perfusion [NP] areas, microaneurysms), diabetic macular edema (DME) status, and systemic metabolic indices (glycemic control, lipid profiles, renal function, inflammatory markers).
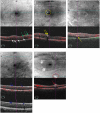
Results: Six distinct HRMs phenotypes were identified: inner retinal hyperreflective spots (IRHFs), outer retinal hyperreflective spots (ORHFs), intraretinal hard exudates (IRHE), outer retinal hard exudates (ORHE), decorrelation-positive HRMs, and cotton-wool spots. Spatial mapping revealed predominant HRMs colocalization with IRMA territories (75.4% IRHFs, 89.5% ORHFs, 90.8% IRHE, 94% ORHE), while 19% of IRHFs and 8.7% of ORHFs overlapped NP zones. Decorrelation-positive HRMs demonstrated dual associations with IRMA (77.6%) and microaneurysms (21.0%). DME eyes exhibited significantly elevated HRMs density within IRMA and NP regions (P < 0.001). Multivariate analysis identified dyslipidemia as a strong predictor of HRMs burden.
Conclusions: These findings establish HRMs as spatially resolved biomarkers of diabetic retinal pathophysiology, reflecting compartment specific interactions between microvascular incompetence (IRMA-associated barrier failure), ischemic remodeling (NP zones), and systemic metabolic dysregulation. The colocalization of HRMs subtypes with IRMA walls and leakage-prone microaneurysms supports their putative role as optical signatures of lipoprotein extravasation and inflammatory lipidotoxicity in DR progression.
Keywords: diabetic macular edema; diabetic retinopathy; hyperreflective materials; lipid metabolism; optical coherence tomography angiography.
Copyright © 2025 Zhou, Sun, Li, Luo, Meng, Wen, Chen, Hu and Yang.
Conflict of interest statement
The authors declare that the research was conducted in the absence of any commercial or financial relationships that could be construed as a potential conflict of interest.
Figures


Similar articles
-
Clinical and imaging characteristics associated with foveal neovascularization in proliferative diabetic retinopathy.Graefes Arch Clin Exp Ophthalmol. 2025 Mar;263(3):679-687. doi: 10.1007/s00417-024-06660-1. Epub 2024 Nov 15. Graefes Arch Clin Exp Ophthalmol. 2025. PMID: 39542876
-
Predictive Role of Complete Blood Count-Derived Inflammation Indices and Optical Coherence Tomography Biomarkers for Early Response to Intravitreal Anti-VEGF in Diabetic Macular Edema.Biomedicines. 2025 May 27;13(6):1308. doi: 10.3390/biomedicines13061308. Biomedicines. 2025. PMID: 40564027 Free PMC article.
-
Optical coherence tomography (OCT) for detection of macular oedema in patients with diabetic retinopathy.Cochrane Database Syst Rev. 2015 Jan 7;1(1):CD008081. doi: 10.1002/14651858.CD008081.pub3. Cochrane Database Syst Rev. 2015. PMID: 25564068 Free PMC article.
-
Systemic inflammatory markers and neurovascular changes in the retina and choroid of diabetic patients without retinopathy: insights from wide-field SS-OCTA.Front Med (Lausanne). 2025 Jun 4;12:1566047. doi: 10.3389/fmed.2025.1566047. eCollection 2025. Front Med (Lausanne). 2025. PMID: 40534690 Free PMC article.
-
Optical coherence tomography (OCT) for detection of macular oedema in patients with diabetic retinopathy.Cochrane Database Syst Rev. 2011 Jul 6;(7):CD008081. doi: 10.1002/14651858.CD008081.pub2. Cochrane Database Syst Rev. 2011. Update in: Cochrane Database Syst Rev. 2015 Jan 07;1:CD008081. doi: 10.1002/14651858.CD008081.pub3. PMID: 21735421 Updated.
References
-
- Cao D, Leong B, Messinger JD, Kar D, Ach T, Yannuzzi LA, et al. Hyperreflective foci, optical coherence tomography progression indicators in age-related macular degeneration, include transdifferentiated retinal pigment epithelium. Invest Ophthalmol Vis Sci. (2021) 62:34. 10.1167/iovs.62.10.34 - DOI - PMC - PubMed
LinkOut - more resources
Full Text Sources
Miscellaneous

