

Altered Nasal Microbiota-Metabolome Interactions in Allergic Rhinitis: Implications for Inflammatory Dysregulation
- PMID: 40740973
- PMCID: PMC12309570
- DOI: 10.2147/JIR.S526181
Altered Nasal Microbiota-Metabolome Interactions in Allergic Rhinitis: Implications for Inflammatory Dysregulation
Abstract
Objective: The aim of this study was to investigate the correlation between nasal microbiome, metabolites, and their potential contribution to the pathogenesis of allergic rhinitis (AR), a widespread chronic inflammatory disorder that poses a considerable healthcare burden worldwide. Immune dysregulation and environmental factors are key in the development of allergic responses, but the importance of host-microbiota interactions in influencing these responses is gaining recognition.
Methods: 32 AR patients and 20 healthy controls underwent 16S rDNA sequencing and untargeted metabolomics analysis. Microbial diversity, composition, and functional pathways were compared between groups. Metabolomic alterations were evaluated using LC-MS/MS, and correlations between microbiota and metabolites were analyzed.
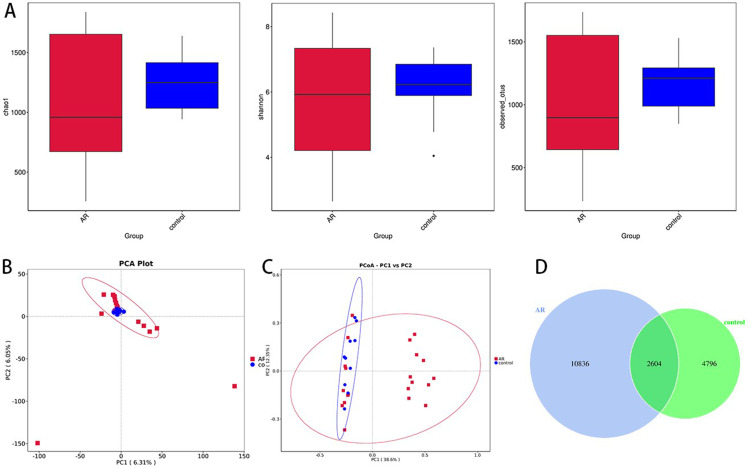
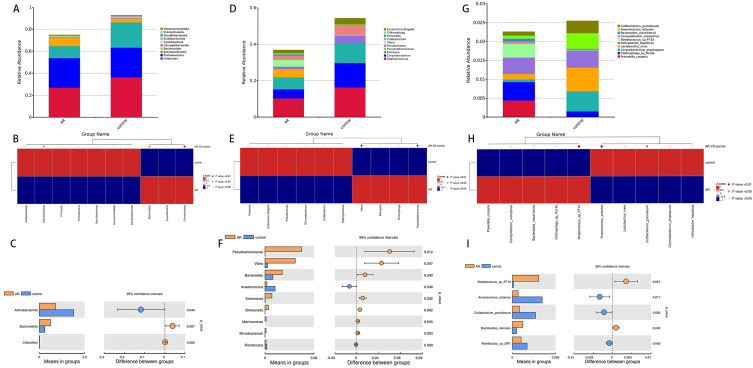
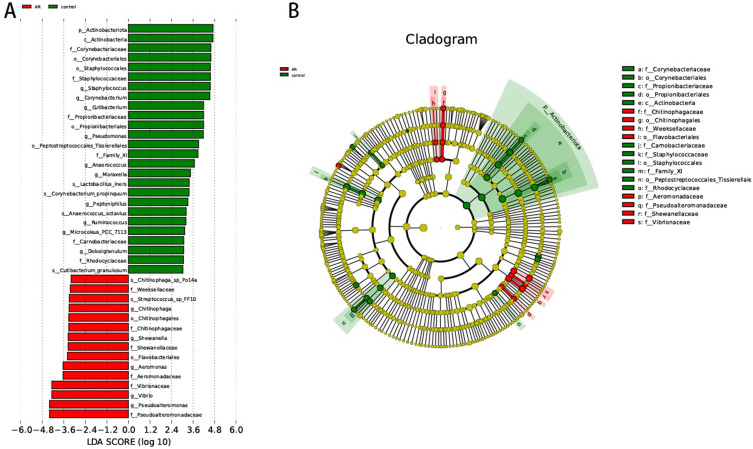
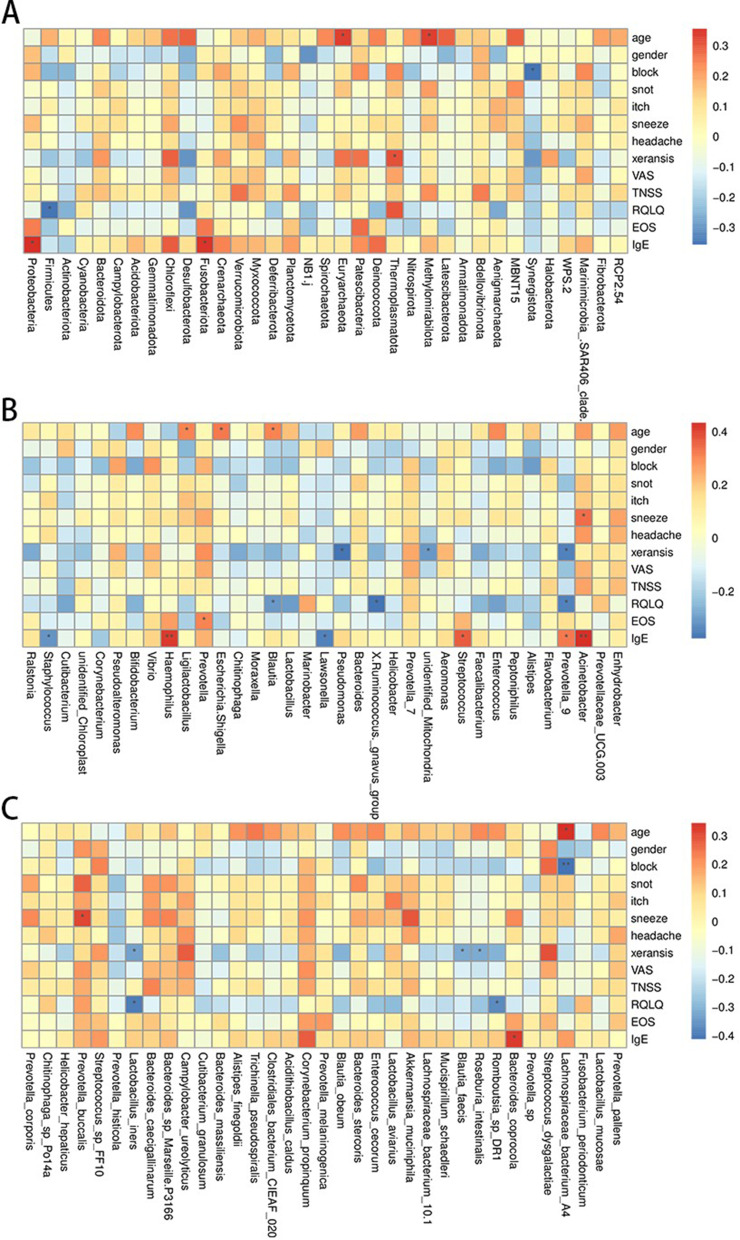
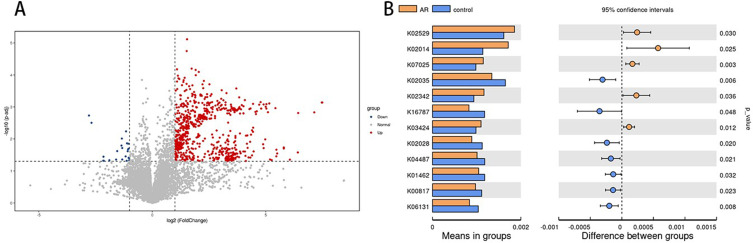
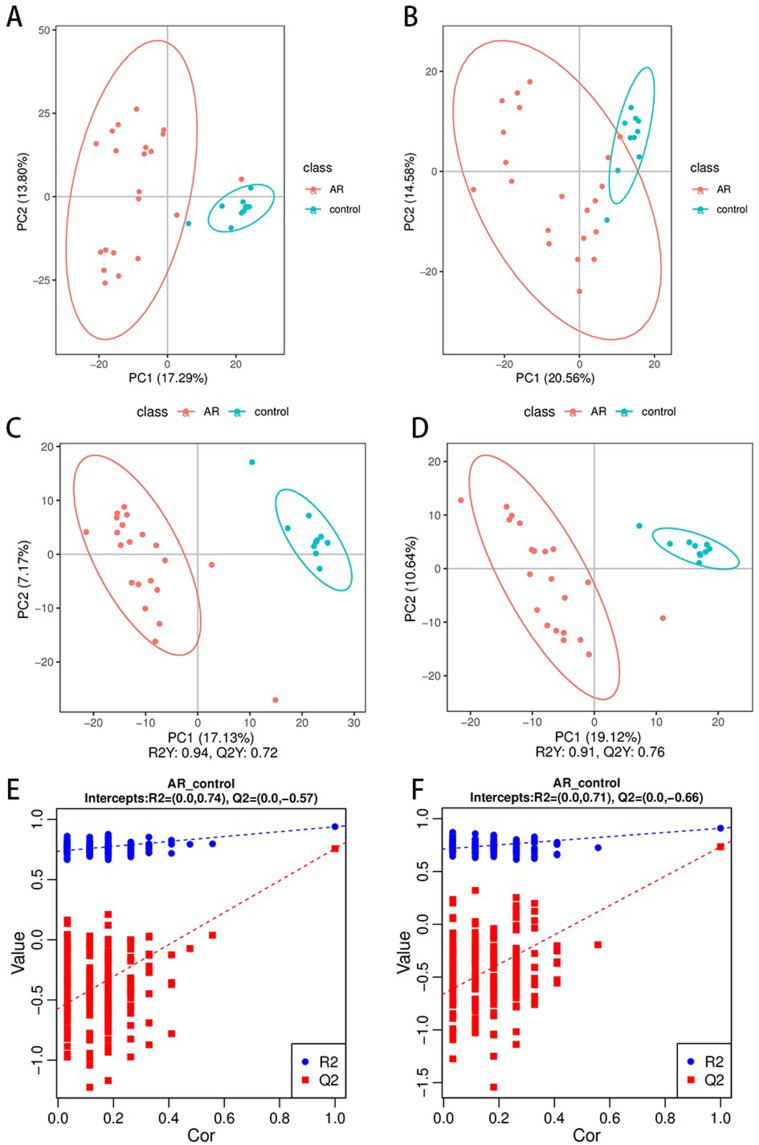
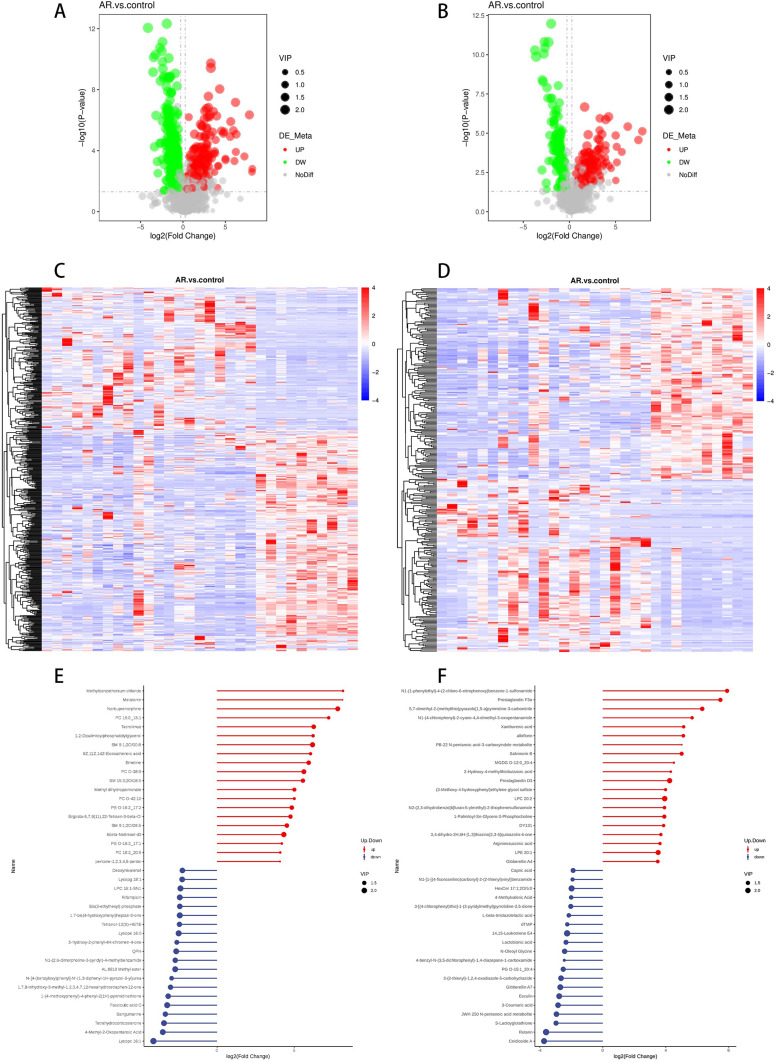
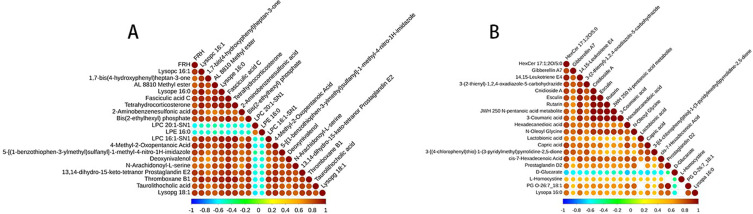
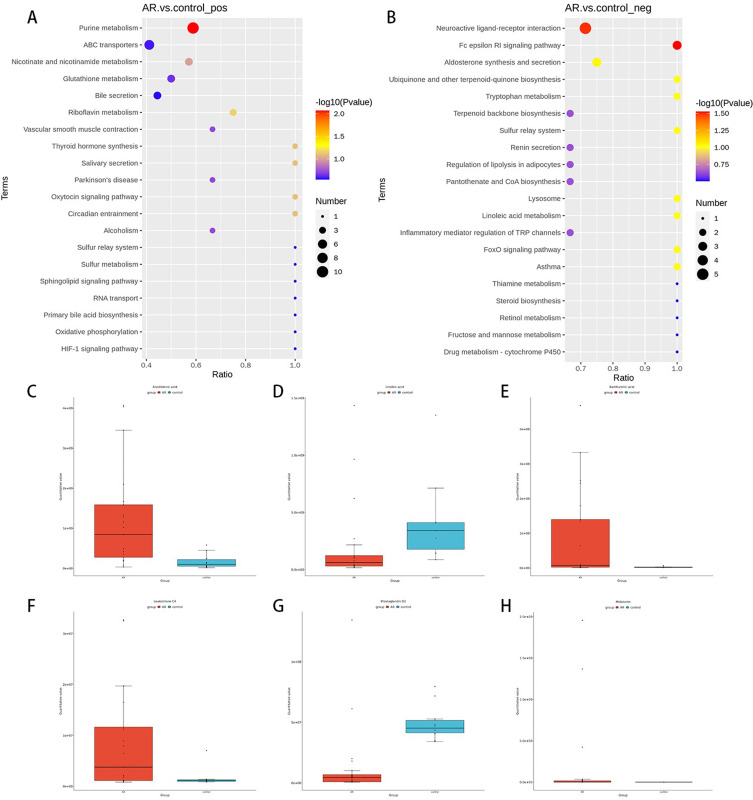
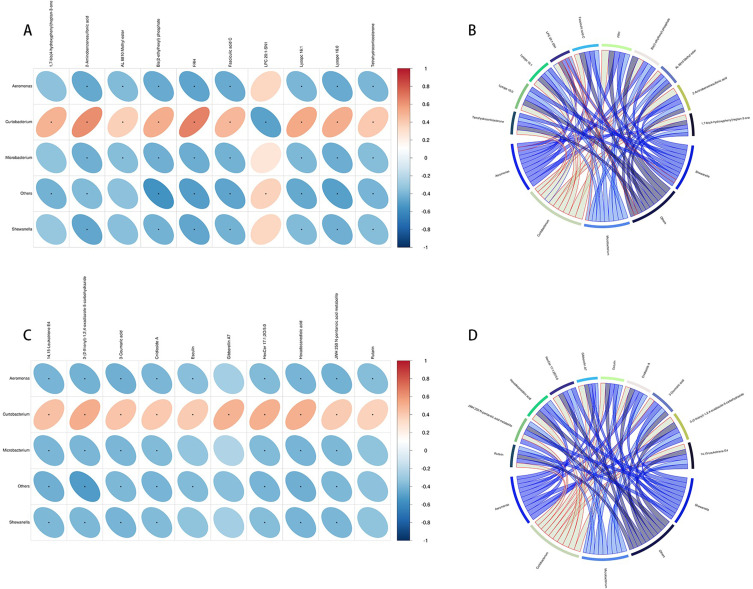
Results: While α-diversity did not differ significantly between groups, β-diversity analysis revealed distinct microbial community shifts in AR patients. Specifically, Actinobacteria and Bacteroidetes abundances were increased, and genera Vibrio and Aeromonas were significantly enriched. Metabolomic profiling identified 528 differential metabolites, including altered levels of LPC, and pathway analysis highlighted disrupted linoleic acid metabolism, arachidonic acid metabolism, and tryptophan metabolism. Correlation analysis revealed significant associations between specific microbial taxa (eg, Aeromonas, Vibrio) and metabolites (eg, LPC, arachidonic acid), suggesting a potential link between microbiota-derived metabolic shifts and inflammatory responses in AR.
Conclusion: The perturbation of nasal microbiota-metabolite interactions may play a role in the pathogenesis of AR, emphasizing the need for future investigations into potential pathophysiological mechanisms.
Keywords: allergic rhinitis; inflammation; metabolomics; nasal microbiota.
© 2025 Ma et al.
Conflict of interest statement
The authors report no conflicts of interest in this work.
Figures
Similar articles
-
The dysbiosis of gut microbiota and dysregulation of metabolites in IgA nephropathy and membranous nephropathy.Front Med (Lausanne). 2025 Jul 16;12:1618947. doi: 10.3389/fmed.2025.1618947. eCollection 2025. Front Med (Lausanne). 2025. PMID: 40740937 Free PMC article.
-
Microbial characterization of the nasal cavity in patients with allergic rhinitis and non-allergic rhinitis.Front Cell Infect Microbiol. 2023 Apr 25;13:1166389. doi: 10.3389/fcimb.2023.1166389. eCollection 2023. Front Cell Infect Microbiol. 2023. PMID: 37180436 Free PMC article.
-
Distinct metabolomic signatures in allergic rhinitis with concurrent chronic spontaneous urticaria: an untargeted metabolomics analysis reveals novel biomarkers and pathway alterations.Front Immunol. 2025 Jun 10;16:1555664. doi: 10.3389/fimmu.2025.1555664. eCollection 2025. Front Immunol. 2025. PMID: 40557142 Free PMC article.
-
Saline irrigation for allergic rhinitis.Cochrane Database Syst Rev. 2018 Jun 22;6(6):CD012597. doi: 10.1002/14651858.CD012597.pub2. Cochrane Database Syst Rev. 2018. PMID: 29932206 Free PMC article.
-
Association between gut microbiota and allergic rhinitis: a systematic review and meta-analysis.PeerJ. 2025 May 26;13:e19441. doi: 10.7717/peerj.19441. eCollection 2025. PeerJ. 2025. PMID: 40444284 Free PMC article.
References
LinkOut - more resources
Full Text Sources
Research Materials
