. 2025 Jul 26:18:10029-10049.
doi: 10.2147/JIR.S519114. eCollection 2025.

Multi-Omics Analysis Combined with Machine Learning Identified FABP4 in Smooth Muscle Cells as a Pathogenic Factor in Atherosclerosis

Affiliations

Multi-Omics Analysis Combined with Machine Learning Identified FABP4 in Smooth Muscle Cells as a Pathogenic Factor in Atherosclerosis

Yinyu Wang et al. J Inflamm Res. .

Abstract

Background: Atherosclerosis is the pathological basis of coronary heart disease, stroke, and peripheral arterial disease. Smooth muscle cells (SMCs) play a crucial role in atherosclerotic pathogenesis. However, effective drugs and therapy targeting SMCs for treating atherosclerosis are still lacking.

Methods: We utilized single-cell RNA sequencing (scRNA-seq) (GSE155512 and GSE159677) and array data (GSE43292 and GSE125771) to identify Scissor+ SMCs (SMCs positively associated with atherosclerosis) and Scissor- SMCs (SMCs negatively associated with atherosclerosis) by using Scissor package. We analyzed their functional changes, cell-cell communication, and differentiation potential. Machine learning techniques were employed to analyze the marker in SMCs of atherosclerosis. qRT-PCR was used to examine the expression of these genes in MOVAS stimulated by ox-LDL. Potential inhibitors of the identified proteins were predicted, and their binding sites were analyzed.

Results: We identified 475 Scissor+ SMCs and 1363 Scissor- SMCs. Functional enrichment analysis revealed that Scissor+ SMCs exhibited downregulation of Rho-related pathways, while pro-inflammatory pathways were upregulated. Cell-cell communication analysis indicated tighter interactions between SMCs and endothelial cells. Differential expression analysis identified 20 genes highly expressed in both scRNA-seq and array data. The LASSO regression, random forest, support vector machine and receiver operating characteristic curve suggested a strong correlation between fatty acid-binding protein 4 (FABP4) and atherosclerosis. The qRT-PCR results showed that FABP4 was highly expressed in MOVAS stimulated by ox-LDL. Drug prediction revealed that (S)-RP-6306 acted as an inhibitor, via forming a polar bond with Arg-126. In vitro experiments confirmed that (S)-RP-6306 significantly reduced the expression of FABP4.

Conclusion: Scissor+ SMCs differed significantly from Scissor- SMCs in cellular function, cell-cell communication, and differentiation potential. The high expression of FABP4 in this subgroup of SMCs presented a promising therapeutic target for atherosclerosis, with (S)-RP-6306 showing potential as a drug targeting FABP4.

Keywords: atherosclerosis; machine learning; molecular docking; smooth muscle cell.


Conflict of interest statement

The authors declare that they have no competing interests in this work.

Figures

None
Graphical abstract
Figure 1
Figure 1
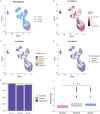
Identification of Scissor+ SMCs and Scissor- SMCs. (A) UMAP plot of 44281 cells which were separated into 25 clusters. (B) The expression of cell markers in 25 clusters. (C) The UMAP plot of cells after annotation. (D) The UMAP plot of cell annotation after T / NK cells being re-clustered and re-annotated. (E) The histogram of counts for various cell types. (F) The UMAP plot of Scissor+ cells and Scissor- cells. (G) The balloonplot showing the proportion of each cell type in Scissor+, Scissor-, and Scissor0 subgroups.
Figure 2
Figure 2
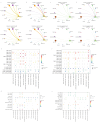
Cell-cell communication network. (A) Scissor+ SMCs as source in the cell communication network. (B) Scissor+ SMCs as target in the cell communication network. (C) Scissor- SMCs as source in the cell communication network. (D) Scissor- SMCs as target in the cell communication network. (E and F) The pathway with the most significant differences between Scissor+ cells and Scissor- cells when SMCs act as source. (G and H) The pathway with the most significant differences between Scissor+ cells and Scissor- cells when SMCs act as target.
Figure 3
Figure 3
Cellular function enrichment. (A) The top 10 signaling pathways exhibiting the most significant upregulation and the top 10 signaling pathways demonstrating the most significant downregulation. (B) The violin plot of three most significantly downregulated pathways in Scissor+ SMC. (C) The violin plot of three most significantly upregulated pathways in Scissor+ SMC. (D) The bubble plot of the metabolic signaling pathway with the most significant differential expression. (E) The boxplot of channel pathways in Scissor+ SMCs and Scissor- SMCs. (F) The histogram of protein post-translational modification pathways.
Figure 4
Figure 4
Cellular potency prediction. (A) The UMAP plot of the SMCs identified by Scissor package. (B) The UMAP plot of the relative order for SMCs. (C) The UMAP plot of potency score for SMCs. (D) The UMAP plot of potency category for SMCs. (E) The proportion of each potency category in three subgroups of SMCs. (F) The statistics of potency score for the three subgroups of SMCs and the statistical analysis between Scissor+ SMCs and Scissor- SMCs using Wilcox.
Figure 5
Figure 5
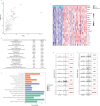
The differentially expressed genes in scRNA-seq and array data. (A) The Log2FC of gene symbols in scRNA-seq and array data, and the 20 most upregulated symbols in both scRNA-seq and array were marked in red. (B) The information of the 20 most upregulated symbols. (C) The relative expression of the 20 DEGs in array data. (D and E) The expression of the 20 DEGs in Scissor+ SMCs and Scissor- SMCs. (F) The GO enrichment results of all upregulated DEGs, the top 5 entries with the smallest P values were selected from each category.
Figure 6
Figure 6
Machine learning. (A) The confusion matrix of RF. (B) The error rate plot of RF. In the plot, the red line represented the model error rate of the atherosclerosis group, the green line represented that of the healthy control group, and the black line represented the overall error rate. (C) The cross validation of RF (D) The top 10 features in RF ranking by MeanDecreaseGini values. (E) The cross validation of LASSO regression. (F) The plot of regularization path in LASSO regression. (G) The accuracy of model with the number of features changing in SVM. (H) The features associated atherosclerosis in the three models. (I) The intersection of the three models. (J) ROC curves of FABP4. (K) ROC curves of IFITM1. (L) ROC curves of MZB1. (M) ROC curves of TNFRSF17.
Figure 7
Figure 7
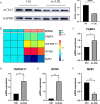
The validation result of DEGs. (A) The expression of ACTA2 was detected by Western blot. (B) The relative expression of the qRT-PCR result. (CF) The statistical analysis of FABP4 (B), TNFRSF17 (C), IFITM1 (D) and MZB1 (E). *: P value < 0.05, **: P value < 0.01, ***: P value < 0.001, ****: P value < 0.0001.
Figure 8
Figure 8
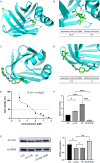
The drug prediction and validation. (A and B) The binding sites and binding energies of (S)-RP-6306 interacting with FABP4. (C and D) The binding sites and binding energies of PD166285 interacting with FABP4. (E). IC50 curve, with log10 (drug concentration) on the x-axis and cell viability on the y-axis. (F). The mRNA expression of FABP4 in MOVAS cells after stimulation with ox-LDL and (S)-RP-6306. (G) The protein expression of ACTA2 in MOVAS cells after stimulation with ox-LDL and (S)-RP-6306. *: P value < 0.05, **: P value < 0.01, ****: P value < 0.0001.

Similar articles

References

    1. Libby P. The changing landscape of atherosclerosis. Nature. 2021;592(7855):524–533. doi: 10.1038/s41586-021-03392-8 - DOI - PubMed
    1. Libby P, Buring JE, Badimon L, et al. Atherosclerosis. Nat Rev Dis Primers. 2019;5(1):56. doi: 10.1038/s41572-019-0106-z - DOI - PubMed
    1. Pattarabanjird T, Li C, McNamara C. B cells in atherosclerosis: mechanisms and potential clinical applications. JACC Basic Transl Sci. 2021;6(6):546–563. doi: 10.1016/j.jacbts.2021.01.006 - DOI - PMC - PubMed
    1. Hou P, Fang J, Liu Z, et al. Macrophage polarization and metabolism in atherosclerosis. Cell Death Dis. 2023;14(10):691. doi: 10.1038/s41419-023-06206-z - DOI - PMC - PubMed
    1. Wang Y, Wang C, Li J. Neutrophil extracellular traps: a catalyst for atherosclerosis. Mol Cell Biochem. 2024;479(12):3213–3227. doi: 10.1007/s11010-024-04931-3 - DOI - PubMed

LinkOut - more resources