. 2025 Jul 21;31(27):106166.
doi: 10.3748/wjg.v31.i27.106166.

Myeloperoxidase, extracellular DNA and neutrophil extracellular trap formation in the animal models of metabolic dysfunction-associated steatotic liver disease

Affiliations

Myeloperoxidase, extracellular DNA and neutrophil extracellular trap formation in the animal models of metabolic dysfunction-associated steatotic liver disease

Andrej Feješ et al. World J Gastroenterol. .

Abstract

Background: Metabolic dysfunction-associated steatotic liver disease (MASLD) is a prevalent chronic liver disorder driven by obesity and metabolic dysfunction. MASLD progresses to metabolic dysfunction-associated steatohepatitis, which is characterized by inflammation, hepatocyte injury, and fibrosis, increasing the risk of cirrhosis and liver failure. Recent studies suggest that neutrophil extracellular traps (NETs) and extracellular DNA (ecDNA) contribute to liver inflammation and fibrogenesis. However, their role in MASLD pathogenesis remains incompletely understood.

Aim: To investigate the dynamics of circulating NETs and ecDNA as potential biomarkers of liver injury in MASLD.

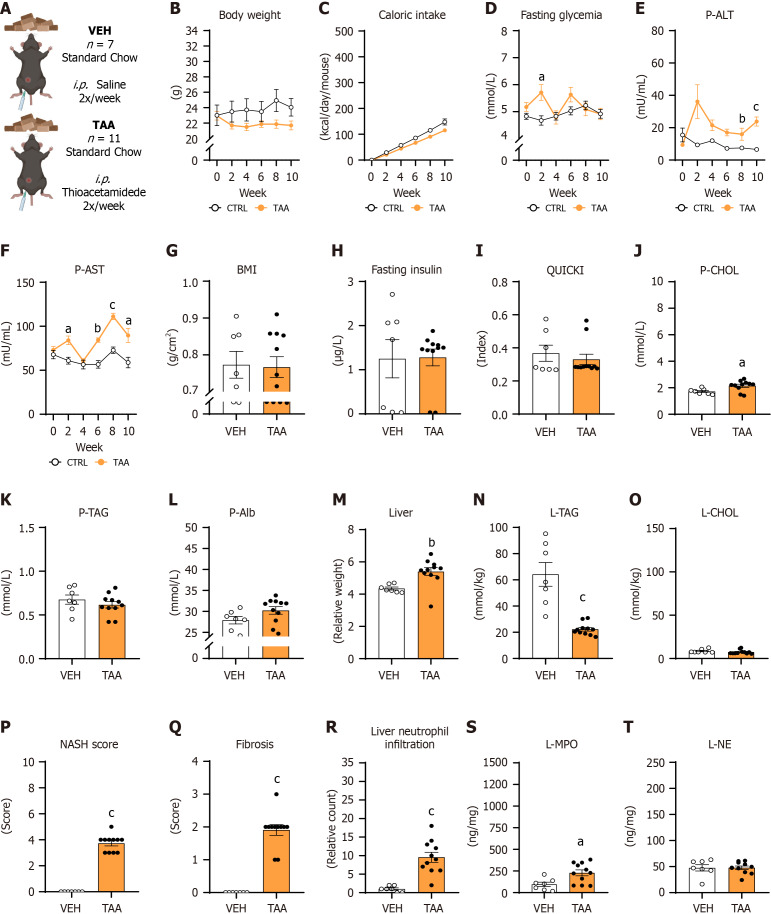
Methods: Using three complementary mouse models, thioacetamide (TAA)-induced fibrosis, choline-deficient L-amino acid-defined (CDAA) diet-induced metabolic dysfunction-associated steatohepatitis, and cafeteria (CAF) diet-induced MASLD, we assessed the association between NET-related markers and liver damage. Blood samples were collected biweekly to analyze ecDNA and NET markers, including myeloperoxidase (MPO) and MPO-DNA complexes, using ELISA and real-time PCR. Liver histopathology was assessed for inflammation, fibrosis, and neutrophil infiltration.

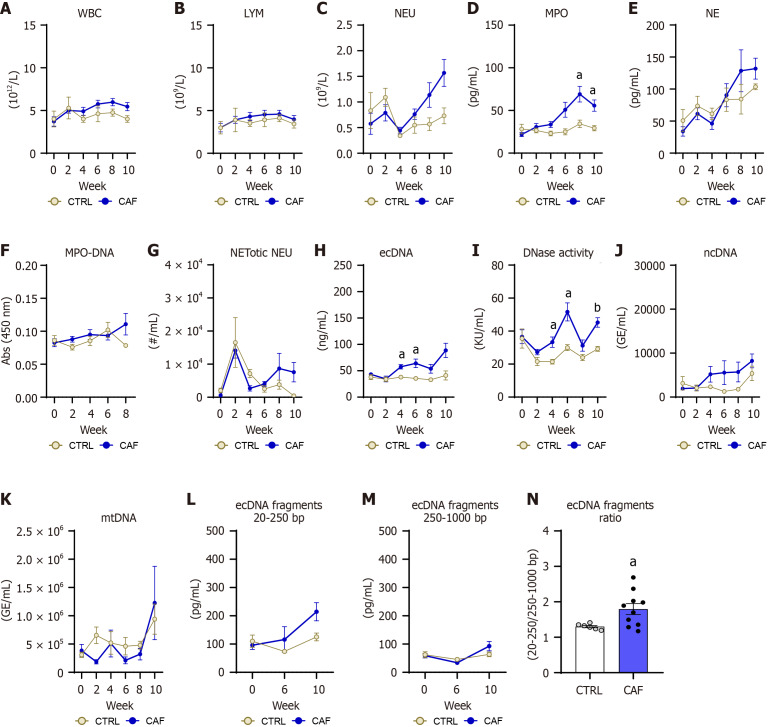
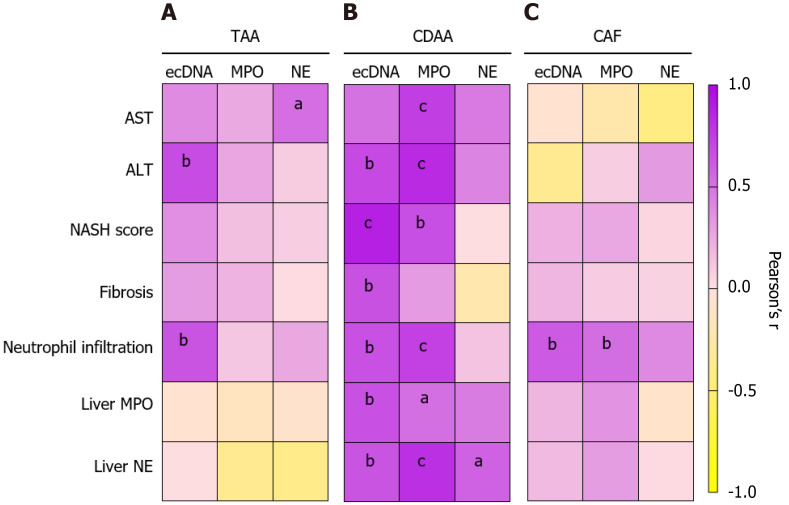
Results: The TAA and CDAA models exhibited significant liver injury, characterized by increased plasma alanine aminotransferase and aspartate aminotransferase levels, hepatocellular damage, and fibrosis. Elevated circulating NET markers (MPO and ecDNA) were observed in these models, with a strong correlation between NET formation and liver pathology. The CAF diet model induced steatosis but failed to elicit significant liver fibrosis or an increase in NET markers, suggesting that NETosis is associated with more severe liver damage. Notably, ecDNA and MPO levels correlated with neutrophil infiltration and fibrosis scores, indicating their potential as biomarkers of MASLD progression.

Conclusion: NETosis and ecDNA levels reflect liver injury severity in MASLD. NET markers and liver fibrosis were strongly associated in TAA and CDAA models, whereas CAF model showed minimal NET involvement.

Keywords: Cell-free DNA; Metabolic dysfunction-associated steatotic liver disease; Mouse models; Myeloperoxidase; Neutrophil elastase; Neutrophil extracellular traps; Steatohepatitis.


Conflict of interest statement

Conflict-of-interest statement: The authors declare no conflicts of interest.

Figures

Figure 1
Figure 1
Experimental design. A: Timeline and summary of measured parameters of all three animal models; B: Visual representation of increasing dosage of thioacetamide in the thioacetamide model. BMI: Body mass index; WBC: White blood cell; LYM: Lymphocytes; AST: Aspartate aminotransferase; ALT: Alanine aminotransferase; ncDNA: Nuclear DNA; mtDNA: Mitochondrial DNA; ecDNA: Extracellular DNA; MPO: Myeloperoxidase; NE: Neutrophil elastase. Graphical abstract and figures created by BioRender.com.
Figure 2
Figure 2
Liver damage-associated and metabolic parameters for the thioacetamide-induced model. A: Experimental design; B: Dynamics of body weight; C: Dynamics of cumulative caloric intake; D: Dynamics of fasting glycemia; E: Dynamics of plasma alanine aminotransferase activity; F: Dynamics of plasma aspartate aminotransferase activity; G: Body mass index; H: Concentration of fasting insulin; I: Quantitative insulin sensitivity check index; J: Concentration of cholesterol; K: Concentrations of triacylglycerols; L: Concentrations of albumin; M: Relative liver weight; N: Concentrations of liver triacylglycerides; O: Concentrations of liver cholesterol; P: Nonalcoholic steatohepatitis score; Q: Fibrotic score; R: Neutrophil infiltration into the liver; S: Concentration of myeloperoxidase in the liver; T: Concentration of neutrophil elastase in the liver. Data shown in G-T are after 10 weeks of the thioacetamide-induced model. Data are presented as mean ± SE. aP < 0.05; bP < 0.01; cP < 0.001; B-F: Repeated two-way analysis of variance and Bonferroni post-hoc test; G-T: Independent Student’s t-test. VEH: Control group of females (n = 7); TAA: Experimental liver fibrosis group of females (n = 11).
Figure 3
Figure 3
Representative pictures of liver histology. A: Hematoxylin and eosin staining (H/E) in the liver of vehicle-injected mouse; B: H/E in liver of thioacetamide (TAA)-injected mouse; C: Van Gieson’s staining (VG) in the liver of vehicle-injected mouse; D: VG in the liver of TAA-injected mouse; E: Naphthol-AS-D-chloroacetate esterase staining (CHAE) in the liver of vehicle-injected mouse; F: CHAE in the liver of TAA-injected mouse; G: H/E in the liver of choline-sufficient L-amino acid-defined control (CTRL CSAA) diet-fed mouse; H: H/E in the liver of choline-deficient L-amino acid-defined (CDAA) diet-fed mouse; I: VG in the liver of CTRL CSAA diet-fed mouse; J: VG in the liver of CDAA diet-fed mouse; K: CHAE in the liver of CTRL CSAA diet-fed mouse L: CHAE in the liver of CDAA diet-fed mouse; M: H/E in the liver of control (CTRL) diet-fed mouse; N: H/E in the liver of cafeteria (CAF) diet-fed mouse; O: VG in the liver of CTRL diet-fed mouse; P: VG in the liver of CAF diet-fed mouse; Q: CHAE in the liver of CTRL diet-fed mouse; R: CHAE in the liver of CAF diet-fed mouse. The blue arrow points to the lobular inflammation. The green arrow points to the steatotic hepatocytes. The orange arrow points to the ballooning of hepatocytes. The white arrow points to the fibrotic tissue. The red arrow points to the neutrophils that infiltrate the liver. H/E: Hematoxylin and eosin staining; TAA: Thioacetamide; VG: Van Gieson’s staining; CHAE: Chloroacetate esterase staining; CTRL CSAA: Choline-sufficient L-amino acid-defined control; CDAA: Choline-deficient L-amino acid-defined; CAF: Cafeteria.
Figure 4
Figure 4
Choline-deficient L-amino acid-defined diet-induced model liver damage-associated and metabolic parameters. A: Experimental design; B: Dynamics of body weight; C: Dynamics of cumulative caloric intake; D: Dynamics of fasting glycemia; E: Dynamics of alanine aminotransferase activity; F: Dynamics of aspartate aminotransferase activity; G: Body mass index; H: Concentrations of fasting insulin; I: Quantitative index of insulin sensitivity; J: Concentrations of cholesterol; K: Concentrations of triacylglycerols; L: Concentrations of albumin; M: Relative liver weight; N: Concentration of liver triacylglycerides; O: Concentration of liver cholesterol; P: Nonalcoholic steatohepatitis score; Q: Fibrotic score; R: Neutrophil infiltration into the liver; S: Concentration of myeloperoxidase in the liver; T: Concentration of neutrophil elastase in the liver. Data shown in G-T are after 10 weeks of the choline-deficient L-amino acid-defined (CDAA) model. Data are presented as mean ± SE. aP < 0.05; bP < 0.01; cP < 0.001; B-F: Repeated two-way analysis of variance and Bonferroni post-hoc test; G-T: Independent Student’s t-test. CTRL CSAA: Control group (n = 7); CDAA: Experimental liver steatosis group (n = 10). CTRL CSAA: Choline-sufficient L-amino acid-defined control; CDAA: Choline-deficient L-amino acid-defined. MPO: Myeloperoxidase; ALT: Alanine aminotransferase; AST: Aspartate aminotransferase; BMI: Body mass index; NASH: Nonalcoholic steatohepatitis; NE: Neutrophil elastase.
Figure 5
Figure 5
Cafeteria diet-induced model liver damage-associated and metabolic parameters. A: Experimental design; B: Dynamics of body weight; C: Dynamics of cumulative caloric intake; D: Dynamics of fasting glycemia; E: Dynamics of alanine aminotransferase activity in plasma; F: Dynamics of aspartate aminotransferase activity in plasma; G: Body mass index; H: Concentrations of fasting insulin; I: Quantitative index of insulin sensitivity; J: Concentrations of cholesterol; K: Concentrations of triacylglycerols; L: Concentrations of albumin; M: Relative liver weight; N: Concentration of liver cholesterol; O: Concentration of liver triacylglycerides; P: Nonalcoholic steatohepatitis score; Q: Fibrotic score; R: Neutrophil infiltration into the liver; S: Concentration of myeloperoxidase in the liver; T: Concentration of neutrophil elastase in the liver. Data shown in G-T are after 10 weeks of the cafeteria (CAF) diet-induced model. Data are presented as mean ± SE. aP < 0.05; bP < 0.01; cP < 0.001; B-F: Repeated two-way analysis of variance and Bonferroni post-hoc test; G-T: Independent Student’s t-test. CTRL: Control group (n = 5); CAF: Experimental diet-induced liver steatosis group (n = 10). MPO: Myeloperoxidase; ALT: Alanine aminotransferase; AST: Aspartate aminotransferase; BMI: Body mass index; NASH: Nonalcoholic steatohepatitis; NE: Neutrophil elastase.
Figure 6
Figure 6
Thioacetamide-induced model blood cell count and neutrophil extracellular trap-associated peripheral markers. A: White blood cell count; B: Lymphocyte count; C: Neutrophil count; D: Concentration of myeloperoxidase; E: Concentration of neutrophil elastase; F: Myeloperoxidase-DNA complex count; G: NETotic neutrophil count; H: Concentration of extracellular DNA (ecDNA); I: DNase activity; J: Concentration of nuclear DNA; K: Concentration of mitochondrial DNA; L: Concentration of small (20-250 bp) fragments of circulating ecDNA; M: Concentration of large (250-1000 bp) fragments of circulating ecDNA; N: Ratio between small and large fragments of circulating ecDNA after 10 weeks. Data are presented as mean ± SE (A-M) or standard deviation (N). aP < 0.05; bP < 0.01; cP < 0.001; A-M: Repeated two-way analysis of variance and Bonferroni post-hoc test; N: Independent Student’s t-test. VEH: Control group receiving intraperitoneal saline injections (n = 7); TAA: Experimental liver fibrosis group receiving intraperitoneal thioacetamide injections (n = 11). WBC: White blood cell; LYM: Lymphocytes; NEU: Neutrophils; MPO: Myeloperoxidase; NE: Neutrophil elastase; NET: Neutrophil extracellular trap; ecDNA: Extracellular DNA; ncDNA: Nuclear DNA; mtDNA: Mitochondrial DNA; TAA: Thioacetamide; CTRL: Control group.
Figure 7
Figure 7
Choline-deficient L-amino acid-defined diet-induced model blood count and neutrophil extracellular trap-associated peripheral markers. A: White blood cell count; B: Lymphocyte count; C: Neutrophil count; D: Concentration of myeloperoxidase; E: Concentration of neutrophil elastase; F: Myeloperoxidase-DNA complex count; G: NETotic neutrophil count; H: Concentration of extracellular DNA (ecDNA); I: DNase activity; J: Concentration of nuclear DNA; K: Concentration of mitochondrial DNA; L: Concentration of small (20-250 bp) fragments of circulating ecDNA; M: Concentration of large (250-1000 bp) fragments of circulating ecDNA; N: Ratio between small and large fragments of circulating ecDNA. Data are presented as mean ± SE (A-M) or standard deviation (N). aP < 0.05; bP < 0.01; cP < 0.001; A-M: Repeated two-way analysis of variance and Bonferroni post-hoc test; N: Independent Student’s t-test. CTRL CSAA: Control group (n = 7); CDAA: Experimental liver steatosis group (n = 10). WBC: White blood cell; LYM: Lymphocytes; NEU: Neutrophils; MPO: Myeloperoxidase; NE: Neutrophil elastase; NET: Neutrophil extracellular trap; ecDNA: Extracellular DNA; ncDNA: Nuclear DNA; mtDNA: Mitochondrial DNA; TAA: Thioacetamide; CTRL CSAA: Choline-sufficient L-amino acid-defined control; CDAA: Choline-deficient L-amino acid-defined.
Figure 8
Figure 8
Cafeteria diet-induced model blood count and neutrophil extracellular trap-associated peripheral markers. A: White blood cell count; B: Lymphocyte count; C: Neutrophil count; D: Concentration of myeloperoxidase; E: Concentration of neutrophil elastase; F: Myeloperoxidase-DNA complex count; G: NETotic neutrophil count; H: Concentration of extracellular DNA (ecDNA); I: DNase activity; J: Concentration of nuclear DNA; K: Concentration of mitochondrial DNA; L: Concentration of small (20-250 bp) fragments of circulating ecDNA; M: Concentration of large (250-1000 bp) fragments of circulating ecDNA; N: Ratio between small and large fragments of circulating ecDNA. Data are presented as mean ± SE (A-M) and standard deviation (N); aP < 0.05; bP < 0.01; cP < 0.001; A-M: Repeated two-way analysis of variance and Bonferroni post-hoc test; N: Independent Student’s t-test. CTRL: Control group (n = 5); CAF: Experimental diet-induced liver steatosis group (n = 10). WBC: White blood cell; LYM: Lymphocytes; NEU: Neutrophils; MPO: Myeloperoxidase; NE: Neutrophil elastase; NET: Neutrophil extracellular trap; ecDNA: Extracellular DNA; ncDNA: Nuclear DNA; mtDNA: Mitochondrial DNA; TAA: Thioacetamide; CTRL: Control group; CAF: Cafeteria.
Figure 9
Figure 9
Correlation matrix of peripheral neutrophil extracellular trap-associated markers and liver damage markers. A: Thioacetamide model; B: Choline-deficient L-amino acid-defined diet-induced model; C: Cafeteria diet model. Aspartate aminotransferase activity in plasma, alanine aminotransferase activity in plasma, extracellular DNA concentrations in plasma, myeloperoxidase concentrations in plasma, neutrophil elastase concentrations in plasma, score of nonalcoholic steatohepatitis, fibrosis score, neutrophil infiltration into the liver, liver myeloperoxidase concentration, and liver neutrophil elastase concentration. Data are presented Pearson’s r; aP < 0.05, bP < 0.01, cP < 0.001. TAA: Thioacetamide; CAF: Cafeteria; CDAA: Choline-deficient L-amino acid-defined; ecDNA: Extracellular DNA; MPO: Myeloperoxidase; NE: Neutrophil elastase; AST: Aspartate aminotransferase; ALT: Alanine aminotransferase; NASH: Nonalcoholic steatohepatitis.

Similar articles

References

    1. Younossi ZM, Koenig AB, Abdelatif D, Fazel Y, Henry L, Wymer M. Global epidemiology of nonalcoholic fatty liver disease-Meta-analytic assessment of prevalence, incidence, and outcomes. Hepatology. 2016;64:73–84. - PubMed
    1. Cholongitas E, Pavlopoulou I, Papatheodoridi M, Markakis GE, Bouras E, Haidich AB, Papatheodoridis G. Epidemiology of nonalcoholic fatty liver disease in Europe: a systematic review and meta-analysis. Ann Gastroenterol. 2021;34:404–414. - PMC - PubMed
    1. Rinella ME, Lazarus JV, Ratziu V, Francque SM, Sanyal AJ, Kanwal F, Romero D, Abdelmalek MF, Anstee QM, Arab JP, Arrese M, Bataller R, Beuers U, Boursier J, Bugianesi E, Byrne CD, Narro GEC, Chowdhury A, Cortez-Pinto H, Cryer DR, Cusi K, El-Kassas M, Klein S, Eskridge W, Fan J, Gawrieh S, Guy CD, Harrison SA, Kim SU, Koot BG, Korenjak M, Kowdley KV, Lacaille F, Loomba R, Mitchell-Thain R, Morgan TR, Powell EE, Roden M, Romero-Gómez M, Silva M, Singh SP, Sookoian SC, Spearman CW, Tiniakos D, Valenti L, Vos MB, Wong VW, Xanthakos S, Yilmaz Y, Younossi Z, Hobbs A, Villota-Rivas M, Newsome PN NAFLD Nomenclature consensus group. A multisociety Delphi consensus statement on new fatty liver disease nomenclature. Ann Hepatol. 2024;29:101133. - PubMed
    1. Mooli RGR, Ramakrishnan SK. Liver Steatosis is a Driving Factor of Inflammation. Cell Mol Gastroenterol Hepatol. 2022;13:1267–1270. - PMC - PubMed
    1. Dömer D, Walther T, Möller S, Behnen M, Laskay T. Neutrophil Extracellular Traps Activate Proinflammatory Functions of Human Neutrophils. Front Immunol. 2021;12:636954. - PMC - PubMed

MeSH terms