. 2025 Jul 21;31(27):109239.
doi: 10.3748/wjg.v31.i27.109239.

Translocator protein facilitates neutrophil-mediated mucosal inflammation in inflammatory bowel diseases

Affiliations

Translocator protein facilitates neutrophil-mediated mucosal inflammation in inflammatory bowel diseases

Qiong He et al. World J Gastroenterol. .

Abstract

Background: Inflammatory bowel diseases (IBD), including ulcerative colitis (UC) and Crohn's disease (CD), are chronic gastrointestinal disorders with an increasing global prevalence and significant healthcare impact. The exact etiology of this condition remains unclear. Neutrophils play a critical role in IBD pathogenesis. Translocator protein (TSPO), a mitochondrial protein linked to immune responses, has demonstrated potential as an inflammatory marker. However, its role in IBD remains underexplored.

Aim: To investigate the role of TSPO in IBD pathogenesis, particularly in neutrophils.

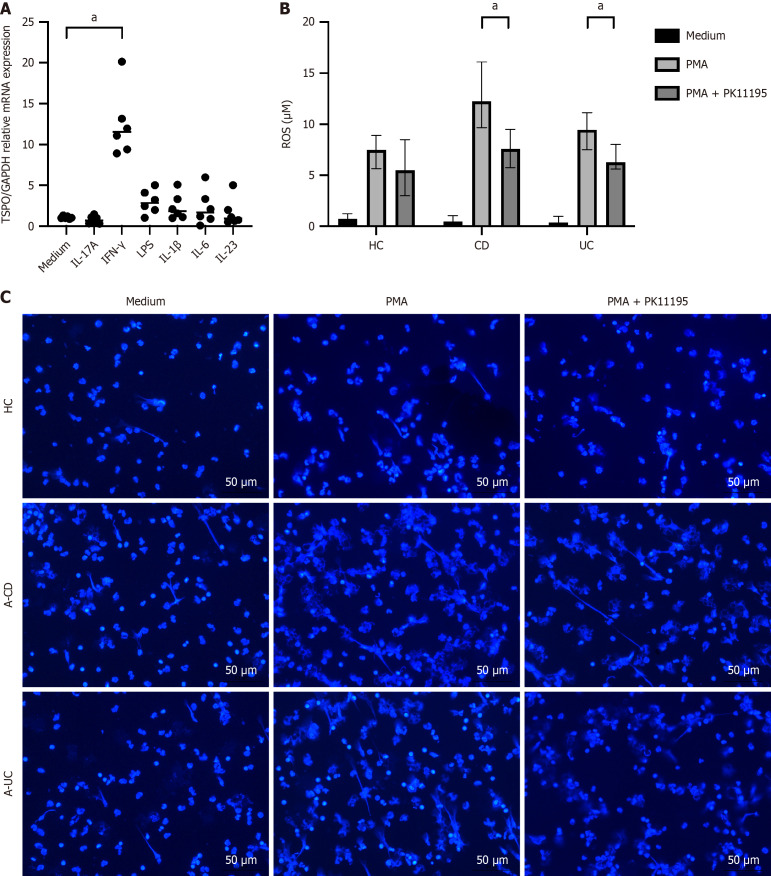
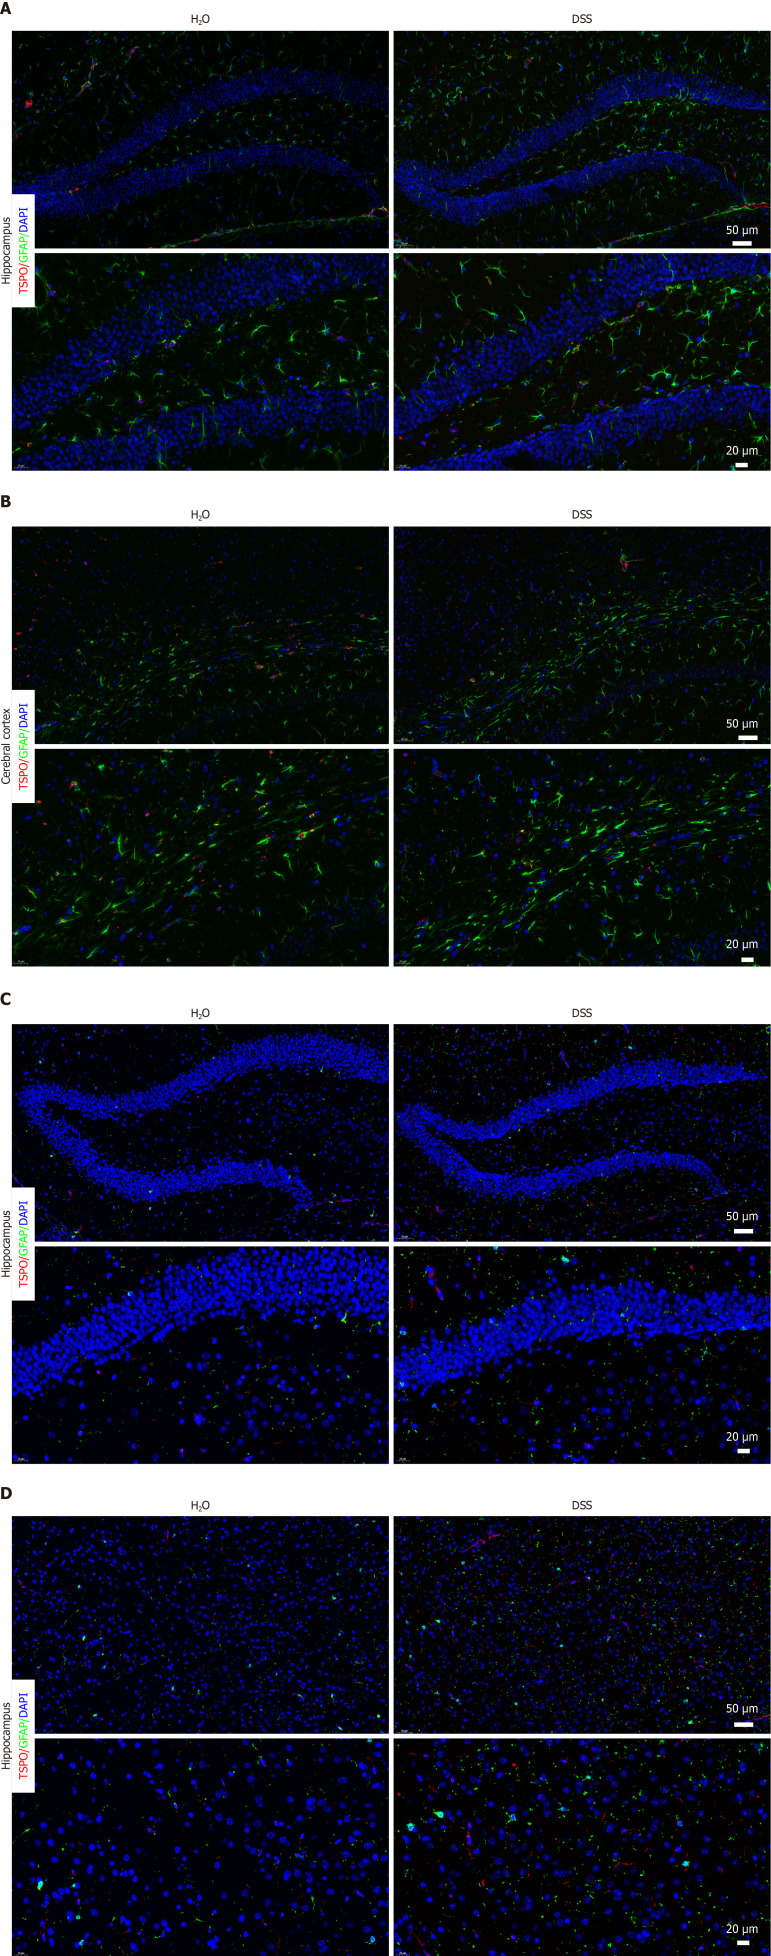
Methods: Bioinformatics analyses of Gene Expression Omnibus datasets (GE75214, GSE94648, GSE156776) assessed TSPO expression in IBD patients. TSPO expression was evaluated in human IBD samples, neutrophiles and a chronic colitis mouse model. Neutrophil function was examined in 18 samples using reactive oxygen species (ROS) production and neutrophil extracellular trap (NET) formation assays. Positron emission tomography-computed tomography (PET-CT) imaging and histology from 12 mice revealed TSPO expression in colitis. PET-CT and immunofluorescence staining assessed TSPO expression in brain under neuroinflammation condition.

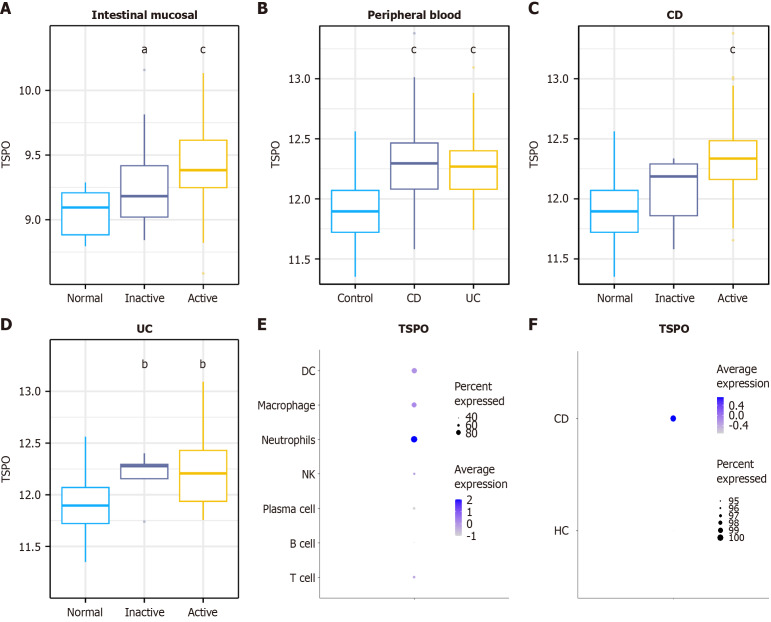
Results: Bioinformatics analysis revealed elevated TSPO expression in the intestinal mucosa and peripheral blood of patients with IBD, especially in neutrophils. This was confirmed by quantitative real-time polymerase chain reaction and immunohistochemical staining, which showed a significant upregulation of TSPO in active IBD. Neutrophils from patients with UC and CD exhibited higher TSPO expression, which correlated with increased ROS production and NET formation. In a mouse model of dextran sodium sulfate-induced chronic colitis, TSPO was upregulated in the colonic neutrophils and brain tissues, indicating its systemic involvement. PET-CT imaging showed enhanced TSPO uptake in the inflamed colon and brain regions, particularly in the microglia, highlighting neuroinflammation.

Conclusion: TSPO is significantly upregulated in neutrophils in IBD and contributes to intestinal inflammation. Its elevated expression in gut highlights its potential as a promising therapeutic target for IBD.

Keywords: Crohn's disease; Expression; Gut-brain axis; Inflammatory bowel disease; Intestinal inflammation; Neuroinflammation; Neutrophil; Positron emission tomography-computed tomography; Translocator protein; Ulcerative colitis.


Conflict of interest statement

Conflict-of-interest statement: All the authors report no relevant conflicts of interest for this article.

Figures

Figure 1
Figure 1
Bioinformatics analysis of translocator protein expression in inflammatory bowel diseases. A: Gene Expression Omnibus (GEO) dataset GSE75214 uses gene microarray technology to analyze gene expression profiles of endoscopic biopsy specimens from patients with inflammatory bowel diseases. For Crohn's disease (CD), ileal mucosal data comprising 11 healthy controls (HC), 16 remission stage, and 51 active stage specimens, were used, while for ulcerative colitis (UC), colon mucosal data were analyzed, including 11 HC, 23 remission stage, and 74 active stage specimens; B-D: GEO dataset GSE94648 includes 22 HC, 25 patients with UC, and 50 patients with CD, the gene expression profile of peripheral whole blood is analyzed using gene microarray technology; E and F: The single-cell sequencing dataset (GSE156776) includes crawling adipose tissue samples from 2 patients with CD and mesenteric adipose tissue samples from 2 HC. The Seurat package was used to perform dimensionality reduction and clustering on the original data, and the subpopulations corresponding to immune cells (including T cells, natural killer cells, B cells, plasma cells, neutrophils, macrophages, and dendritic cells) are then extracted and analyzed; the expression of TSPO is compared in CD and HC neutrophils. aP < 0.05, bP < 0.01, cP < 0.001. CD: Crohn's disease; DC: Dendritic cells; HC: Healthy controls; NK: Natural killer; TSPO: Translocator protein; UC: Ulcerative colitis.
Figure 2
Figure 2
Expression of translocator protein in the intestinal mucosa of patients with inflammatory bowel diseases. A: Intestinal mucosa samples are collected from healthy controls (n = 35), patients with active Crohn's disease (CD) (n = 47), those with CD in remission (n = 18), those with active ulcerative colitis (UC) (n = 40), and those with UC in remission (n = 25). Total RNA is extracted and translocator protein (TSPO) mRNA expression is analyzed using quantitative real-time polymerase chain reaction; B and C: Correlation analysis of TSPO intestinal mucosa expression with endoscopic scores for inflammatory bowel diseases (Simple Endoscopic Score for CD/Ulcerative Colitis Endoscopic Index of Severity); D: Immunohistochemical assessment of TSPO expression in the intestinal mucosa. Original magnification 400 ×. n: The biologically independent replicates used in the statistical analyses. aP < 0.05, bP < 0.01, cP < 0.001. A-CD: Active Crohn's disease; A-UC: Active ulcerative colitis; CD: Crohn's disease; CD-SES: Simple Endoscopic Score for Crohn's disease; HC: Healthy controls; R-CD: Crohn's disease in remission; R-UC: Ulcerative colitis in remission; TSPO: Translocator protein; UC: Ulcerative colitis; UCEIS: Ulcerative Colitis Endoscopic Index of Severity.
Figure 3
Figure 3
Expression of translocator protein in the neutrophils of patients with inflammatory bowel diseases. A: Peripheral blood samples are collected from 6 healthy controls (HC), and various immune cell types are isolated using magnetic bead sorting. Translocator protein (TSPO) expression is assessed via quantitative real-time polymerase chain reaction (qRT-PCR); B: Peripheral blood samples are collected from HC (n = 17), patients with active Crohn's disease (A-CD) (n = 19), those with Crohn's disease (CD) in remission (R-CD) (n = 11), those with active ulcerative colitis (A-UC) (n = 12), and those with ulcerative colitis (UC) in remission (R-UC) (n = 12). Neutrophils are isolated from these samples using immunomagnetic beads, and TSPO expression is analyzed using qRT-PCR in each group; C and D: Peripheral blood samples from HC, patients with A-CD, those in R-CD, those with A-UC, and those in R-UC are collected (n = 8 per group). Neutrophils are isolated using immunomagnetic beads, and TSPO expression is measured by flow cytometry; E: Immunofluorescence staining is performed to evaluate TSPO expression in neutrophils present in the intestinal mucosa of HC and patients with active inflammatory bowel diseases (CD and UC). Myeloperoxidase (MPO): Red; TSPO: Green; MPO+TSPO+: Yellow. Original magnification 400 ×. n: The biologically independent replicates used in the statistical analyses. aP < 0.05, bP < 0.01, cP < 0.001. A-CD: Active Crohn's disease; A-UC: Active ulcerative colitis; CD: Crohn's disease; CD-inflamed: Intestinal mucosa from inflammatory sites in patients with Crohn's disease; HC: Healthy controls; Healthy control: Intestinal mucosa from healthy individuals; MFI: Measured by flow cytometry; MPO: Myeloperoxidase; R-CD: Crohn's disease in remission; R-UC: Ulcerative colitis in remission; TSPO: Translocator protein; UC: Ulcerative colitis; UC-inflamed: Intestinal mucosa from inflammatory sites in patients with ulcerative colitis.
Figure 4
Figure 4
Regulation of neutrophil function by translocator protein. A: Neutrophils are isolated from the peripheral blood of 6 healthy controls (HC) using immunomagnetic beads. After stimulation with interleukin-17A, interferon-γ, and lipopolysaccharide for 3 hours, total RNA is extracted, and translocator protein mRNA expression is assessed using quantitative real-time polymerase chain reaction; B and C: Neutrophils from HC (n = 6), patients with active Crohn's disease (n = 6), and those with active ulcerative colitis (n = 6) are stimulated with phorbol 12-myristate 13-acetate (PMA) and PMA+PK11195 for 3 hours. The levels of reactive oxygen species release and neutrophil extracellular trap formation are subsequently analyzed. n: The biologically independent replicates used in the statistical analyses. aP < 0.05, bP < 0.01, cP < 0.001. A-CD: Active Crohn's disease; A-UC: Active ulcerative colitis; CD: Crohn's disease; IFN, Interferon; IL: Interleukin; LPS: Lipopolysaccharide; PMA: Phorbol 12-myristate 13-acetate; ROS: Reactive oxygen species; TSPO: Translocator protein; UC: Ulcerative colitis.
Figure 5
Figure 5
Translocator protein expression is significantly upregulated in mice with colitis, n = 6 in each group. A: The body weight of mice receiving H2O or dextran sodium sulfate (DSS) is monitored weekly. Changes in body weight are expressed as a percentage of the original weight at the beginning of the experiments. aP < 0.05, bP < 0.01 vs mice those received H2O at the end of the 8th week; B: Changes in disease activity index score between the two groups during the experiment; C: Gross morphology of the large bowels at the end of the 8th week after receiving DSS; D: Colon length is measured and recorded. bP < 0.01 vs mice those received H2O; E: Histological appearance of colonic sections after hematoxylin and eosin. Original magnification 200 ×; F: Pathological scores of colonic sections are shown in the chart; G: Representative immunofluorescent images of the colonic mucosa for staining with 4'-6-diamidino-2-phenylindole (blue), anti-TSPO (red), and anti-myeloperoxidase (MPO) (green). The white arrows indicate representative TSPO+ MPO+ cells. Original magnification 400 ×; H: Representative [18F] labeled N,N-diethyl-2-(2-[4-(2-fluoroethoxy)phenyl]-5,7-dimethylpyrazolo[1,5-alpha]pyrimidine-3-yl)acetamide (DPA-714) uptake according to micro-positron emission tomography-computed tomography imaging in wild-type (WT) mice with H2O and those with DSS treatment. Colon [18F]DPA-714 uptake is higher in the WT mice with DSS treatment than in those with H2O treatment. Regions of interest drawn in the colon tissue are showed as white arrows on each image. n: The biologically independent replicates used in the statistical analyses. DSS: Dextran sodium sulfate; TSPO: Translocator protein; MPO: Myeloperoxidase; DAPI: 4'-6-diamidino-2-phenylindole.
Figure 6
Figure 6
Translocator protein expression is significantly increased in the mouse brain after dextran sodium sulfate treatment. A: For patients with Alzheimer's disease (AD), the AlzData database is utilized, which includes integrated analysis of gene expression profiles from 684 patients with AD and 562 control brain tissues. This analysis generates a comprehensive gene expression profile of brain tissues and a catalog of susceptibility genes associated with AD. Separate analyses are conducted for four distinct brain regions affected by AD, including the entorhinal cortex, hippocampus, temporal cortex, and frontal cortex. The results reveal a significant increase in translocator protein (TSPO) expression in the temporal cortex of patients with AD compared with healthy controls. In other brain regions, TSPO expression in patients with AD shows an increasing trend, although the differences do not reach statistical significance; B and C: Immunohistochemical staining for TSPO of representative sections from the brain of two groups (original magnification 200 ×), and the numbers of TSPO+ cells in each high-power field view are shown in the bar chart (aP < 0.05); D: Representative [18F]DPA-714 uptake according to micro-PET-CT imaging in wild-type (WT) mice with H2O those with DSS treatment. Brain [18F]DPA-714 uptake is higher in the WT mice with DSS treatment than in those with H2O treatment. Regions of interest drawn in the brain tissue are showed as throng white arrows on each image; E: Statistical analysis and comparison of the brain standardized uptake value in WT mice with H2O and those with DSS treatment are shown (bP < 0.01). n: The biologically independent replicates used in the statistical analyses. AD: Alzheimer's disease; DSS: Dextran sodium sulfate; TSPO: Translocator protein; SUV: Standardized uptake value.
Figure 7
Figure 7
Dextran sodium sulfate-induced colitis leads to changes in translocator protein expression and several types of neural cells in the brain. A and B: Representative immunofluorescent images for staining with 4'-6-diamidino-2-phenylindole (DAPI) (blue), anti-translocator protein (TSPO) (red), and anti-glial fibrillary acidic protein (green) in the hippocampus and cerebral cortex of representative sections from the brain of two groups. Original magnification: (1) Up 200 ×; and (2) Down 400 ×; C and D: Representative immunofluorescent images for staining with DAPI (blue), anti-TSPO (red), and anti-IBA1 (green) in the hippocampus and cerebral cortex of representative sections from the brain of two groups. Original magnification: (1) Up 200 ×; and (2) Down 400 ×. n: The biologically independent replicates used in the statistical analyses. DAPI: 4'-6-diamidino-2-phenylindole; DSS: Dextran sodium sulfate; GFAP: Glial fibrillary acidic protein; TSPO: Translocator protein.

Similar articles

References

    1. Kaplan GG. The global burden of IBD: from 2015 to 2025. Nat Rev Gastroenterol Hepatol. 2015;12:720–727. - PubMed
    1. Petagna L, Antonelli A, Ganini C, Bellato V, Campanelli M, Divizia A, Efrati C, Franceschilli M, Guida AM, Ingallinella S, Montagnese F, Sensi B, Siragusa L, Sica GS. Pathophysiology of Crohn's disease inflammation and recurrence. Biol Direct. 2020;15:23. - PMC - PubMed
    1. Kobayashi T, Siegmund B, Le Berre C, Wei SC, Ferrante M, Shen B, Bernstein CN, Danese S, Peyrin-Biroulet L, Hibi T. Ulcerative colitis. Nat Rev Dis Primers. 2020;6:74. - PubMed
    1. Ballesteros I, Rubio-Ponce A, Genua M, Lusito E, Kwok I, Fernández-Calvo G, Khoyratty TE, van Grinsven E, González-Hernández S, Nicolás-Ávila JÁ, Vicanolo T, Maccataio A, Benguría A, Li JL, Adrover JM, Aroca-Crevillen A, Quintana JA, Martín-Salamanca S, Mayo F, Ascher S, Barbiera G, Soehnlein O, Gunzer M, Ginhoux F, Sánchez-Cabo F, Nistal-Villán E, Schulz C, Dopazo A, Reinhardt C, Udalova IA, Ng LG, Ostuni R, Hidalgo A. Co-option of Neutrophil Fates by Tissue Environments. Cell. 2020;183:1282–1297.e18. - PubMed
    1. Gao H, Peng K, Shi Y, Zhu S, Sun R, Xu C, Liu P, Pang Z, Zhu L, Chen W, Feng B, Wu H, Zhou G, Li M, Li J, Ding B, Liu Z. Development and validation of a novel criterion of histologic healing in ulcerative colitis defined by inflammatory cell enumeration in lamina propria mucosa: A multicenter retrospective cohort in China. Chin Med J (Engl) 2024;137:1316–1323. - PMC - PubMed

MeSH terms