

Comparative transcriptomic and genomic analysis of tumor cells in the marginal and center regions of tumor nests in human hepatocellular carcinoma
- PMID: 40741331
- PMCID: PMC12307378
- DOI: 10.3389/fcell.2025.1611951
Comparative transcriptomic and genomic analysis of tumor cells in the marginal and center regions of tumor nests in human hepatocellular carcinoma
Abstract
Background: The tumor nests in solid tumors, including hepatocellular carcinoma (HCC), possess tumor-initiating potential, with the capacity to metastasize and form new metastatic lesions. However, the biological characteristics and heterogeneity of tumor cells at the central and marginal regions of these tumor nests remain poorly understood.
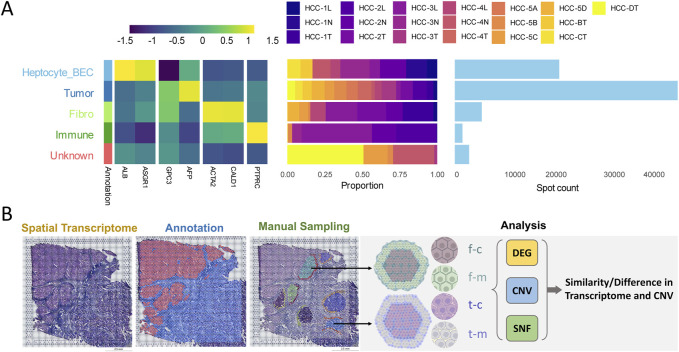
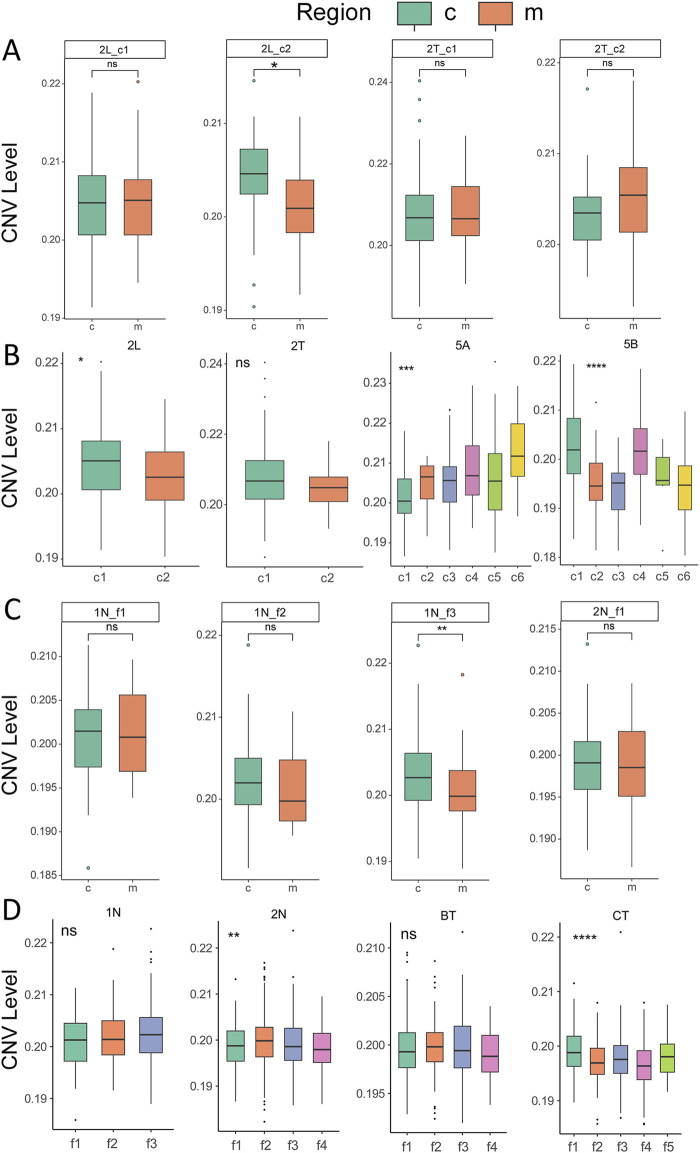
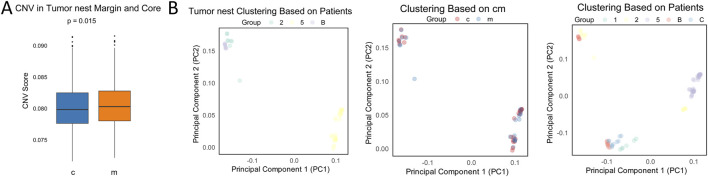
Method: Based on pathological tissue sections, data integration and dimensionality reduction, we defined the boundaries and centers of tumor nests and fibrous nodules within 19 spatial transcriptomics (ST) samples from 8 HCC patients. Differential gene expression was analyzed at the single-unit, sample, patient, and pseudobulk levels, followed by Gene Ontology (GO) enrichment analysis. Additionally, spatial copy number variation (CNV) was inferred using inferCNV, and comparisons were made at the single-unit, sample, patient, and pseudobulk levels.
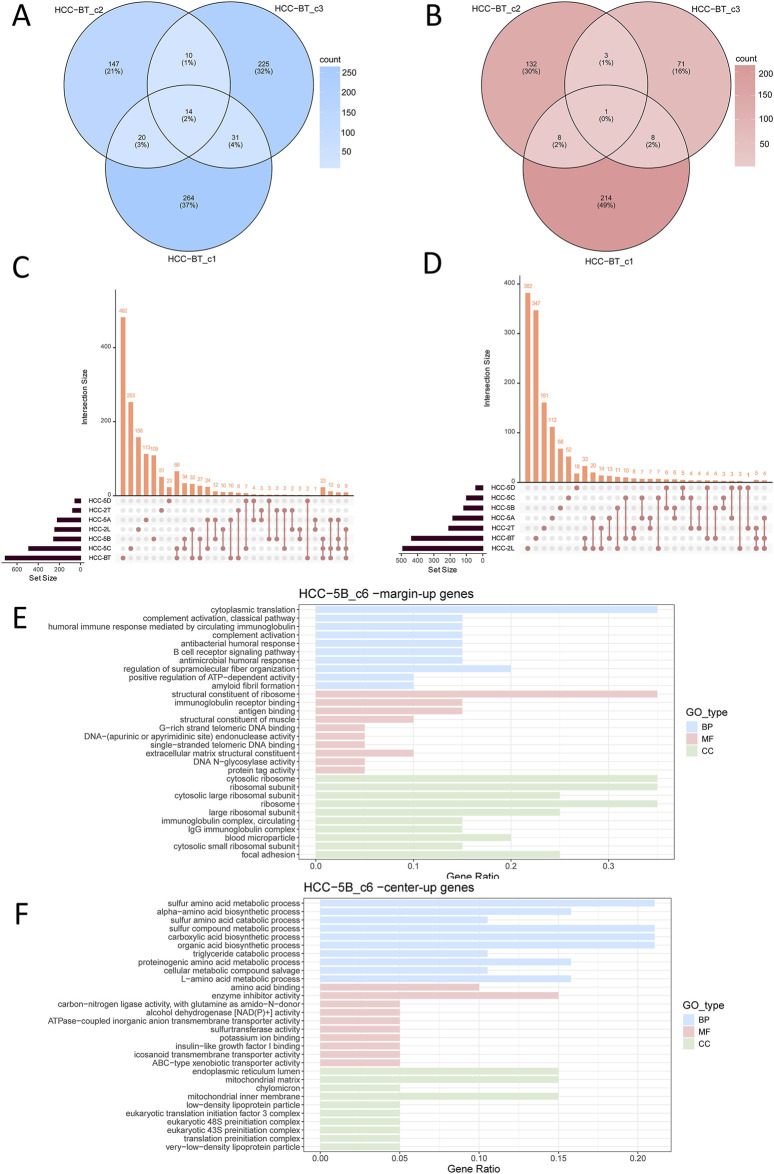
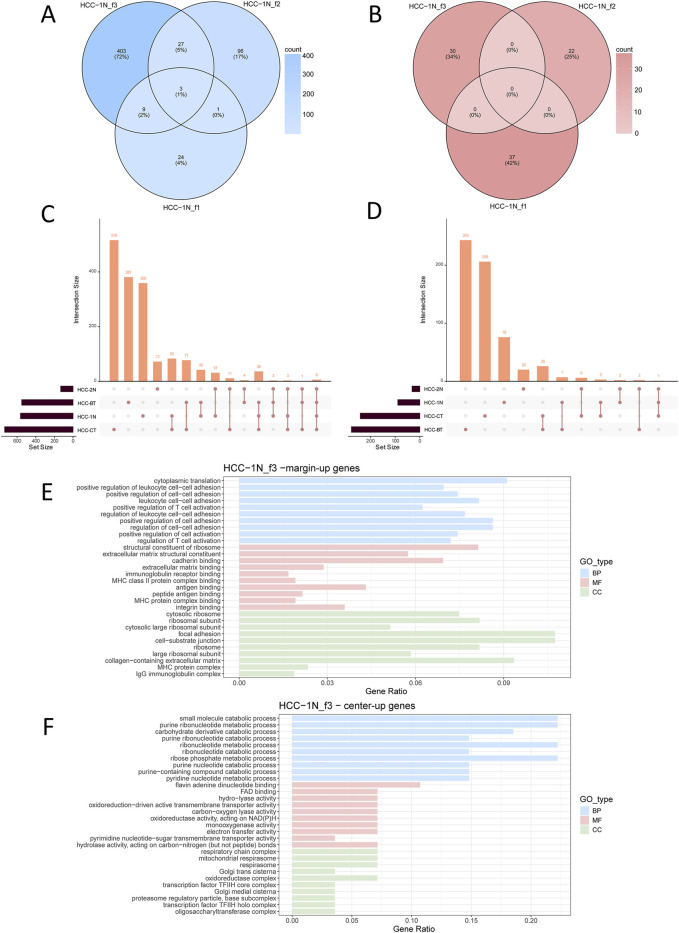
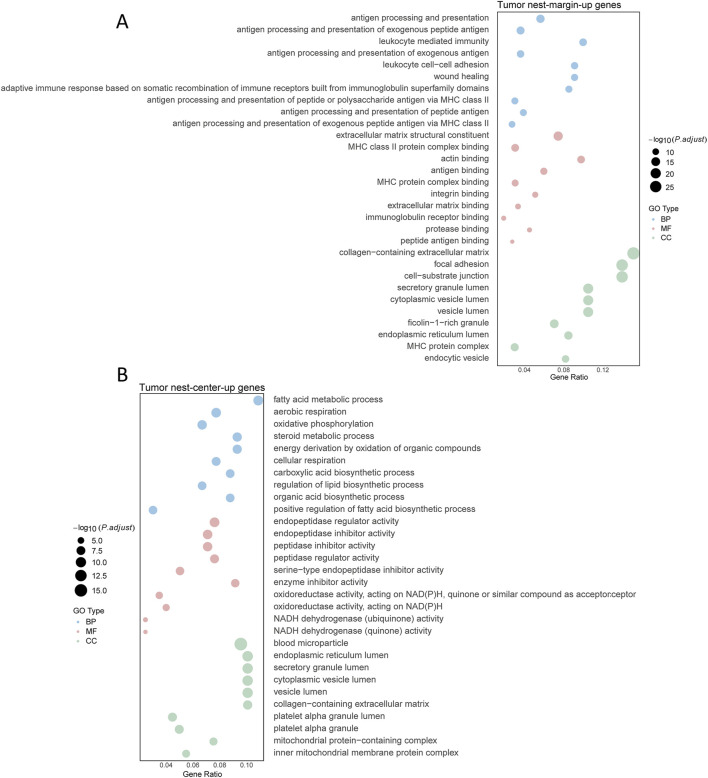
Results: Ultimately, 24 tumor nests and 15 liver fibrosis nodules were analyzed. The spatial gene expression patterns of the tumor nests exhibited significant heterogeneity, with gene enrichment analysis revealing upregulation of immune-related pathways (e.g., humoral immune response mediated by circulating immunoglobulin; B cell receptor signaling pathway, etc.) at the tumor nest margins and growth/metabolism-related pathways (e.g., sulfur amino acid metabolic process; proteinogenic amino acid metabolic process, etc.) within the tumor nest center. Similar expression patterns were also observed in liver fibrous nodule samples. CNV and clustering analyses demonstrated transcriptional differences between tumor nests within individual patients, suggesting the evolutionary diversity, or heterogeneity, of tumor nests within the same tumor.
Conclusion: Tumor nests exhibit significant transcriptional differentiation along spatial axes: the central regions show high expression of metabolism-related genes, while the marginal regions are enriched in immune-regulatory genes. This pattern is also observed in liver fibrotic nodules. This center-margin functional division may inform rational design of therapeutics that simultaneously modulate metabolism and immune responses.
Keywords: fibrotic nodules; hepatocellular carcinoma; heterogeneity; spatial transcriptomic; tumor nest.
Copyright © 2025 Li, Hu, He, Xu, Wang and He.
Conflict of interest statement
The authors declare that the research was conducted in the absence of any commercial or financial relationships that could be construed as a potential conflict of interest.
Figures
Similar articles
-
Can a Liquid Biopsy Detect Circulating Tumor DNA With Low-passage Whole-genome Sequencing in Patients With a Sarcoma? A Pilot Evaluation.Clin Orthop Relat Res. 2025 Jan 1;483(1):39-48. doi: 10.1097/CORR.0000000000003161. Epub 2024 Jun 21. Clin Orthop Relat Res. 2025. PMID: 38905450
-
Systemic pharmacological treatments for chronic plaque psoriasis: a network meta-analysis.Cochrane Database Syst Rev. 2021 Apr 19;4(4):CD011535. doi: 10.1002/14651858.CD011535.pub4. Cochrane Database Syst Rev. 2021. Update in: Cochrane Database Syst Rev. 2022 May 23;5:CD011535. doi: 10.1002/14651858.CD011535.pub5. PMID: 33871055 Free PMC article. Updated.
-
Systemic pharmacological treatments for chronic plaque psoriasis: a network meta-analysis.Cochrane Database Syst Rev. 2020 Jan 9;1(1):CD011535. doi: 10.1002/14651858.CD011535.pub3. Cochrane Database Syst Rev. 2020. Update in: Cochrane Database Syst Rev. 2021 Apr 19;4:CD011535. doi: 10.1002/14651858.CD011535.pub4. PMID: 31917873 Free PMC article. Updated.
-
Does Augmenting Irradiated Autografts With Free Vascularized Fibula Graft in Patients With Bone Loss From a Malignant Tumor Achieve Union, Function, and Complication Rate Comparably to Patients Without Bone Loss and Augmentation When Reconstructing Intercalary Resections in the Lower Extremity?Clin Orthop Relat Res. 2025 Jun 26. doi: 10.1097/CORR.0000000000003599. Online ahead of print. Clin Orthop Relat Res. 2025. PMID: 40569278
-
Systemic pharmacological treatments for chronic plaque psoriasis: a network meta-analysis.Cochrane Database Syst Rev. 2017 Dec 22;12(12):CD011535. doi: 10.1002/14651858.CD011535.pub2. Cochrane Database Syst Rev. 2017. Update in: Cochrane Database Syst Rev. 2020 Jan 9;1:CD011535. doi: 10.1002/14651858.CD011535.pub3. PMID: 29271481 Free PMC article. Updated.
References
LinkOut - more resources
Full Text Sources