

Osteoarthritis Progression, Pain, and Function in Early Carpometacarpal Osteoarthritis: A Six-Year Longitudinal Study
- PMID: 40741515
- PMCID: PMC12308023
- DOI: 10.1016/j.jhsg.2025.100795
Osteoarthritis Progression, Pain, and Function in Early Carpometacarpal Osteoarthritis: A Six-Year Longitudinal Study
Abstract
Purpose: The purpose of this study was to examine the 6-year progression of modified Eaton staging, pain scores, and hand strength in patients with early carpometacarpal osteoarthritis (OA) and healthy controls, illustrating the differences between OA groups and controls. Osteoarthritis patients were stratified into stable and progressing groups using three-dimensional computed tomography imaging to identify clinical and radiographic markers differentiating progressing OA from stable disease and healthy controls.
Methods: Data were collected from 86 early carpometacarpal OA patients, classified as stable or progressing OA based on trapezial osteophyte volume (progression defined as >150 mm3 at any visit or a growth rate >14.6 mm3/y), and from 22 healthy controls. Osteoarthritis patients were assessed at baseline and at 1.5-year intervals up to 6 years, whereas controls were evaluated at baseline and year 6. We analyzed modified Eaton stage, patient-rated wrist/hand evaluation, Australian/Canadian OA hand index pain and function scores, and key pinch and grip strengths across groups over 6 years. Tukey honestly significant difference tests evaluated intergroup differences, and fixed effects models assessed the effects of time and OA progression on outcomes, with statistical significance set at P < .05.
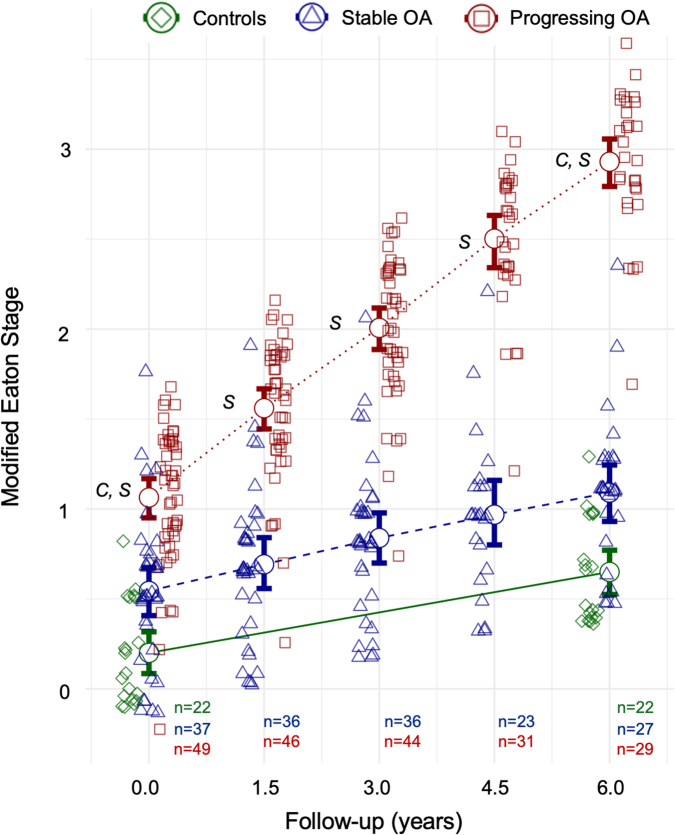
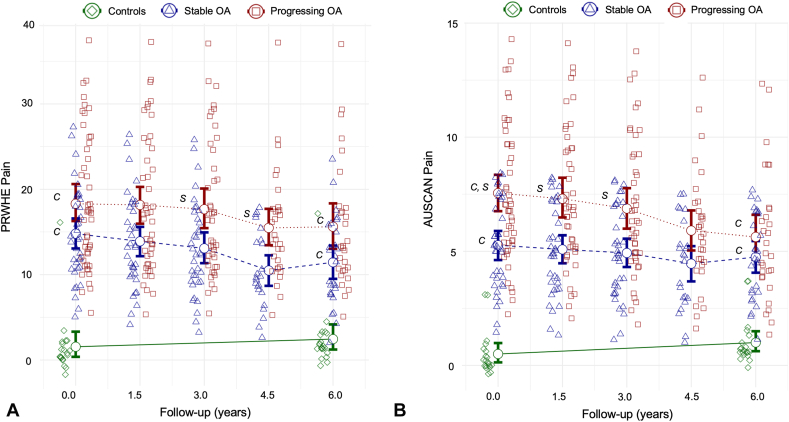
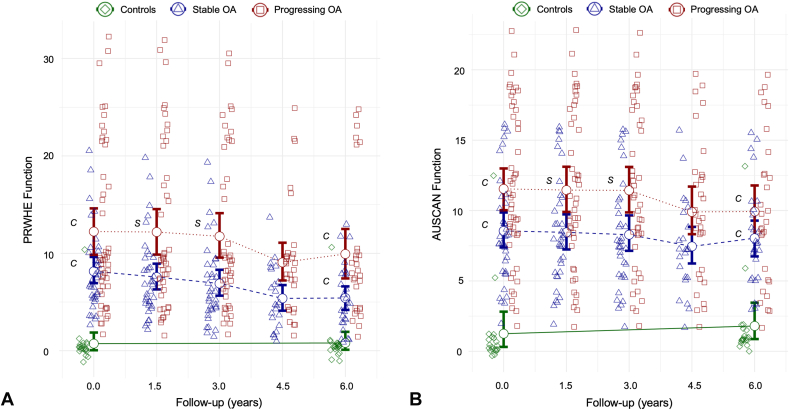
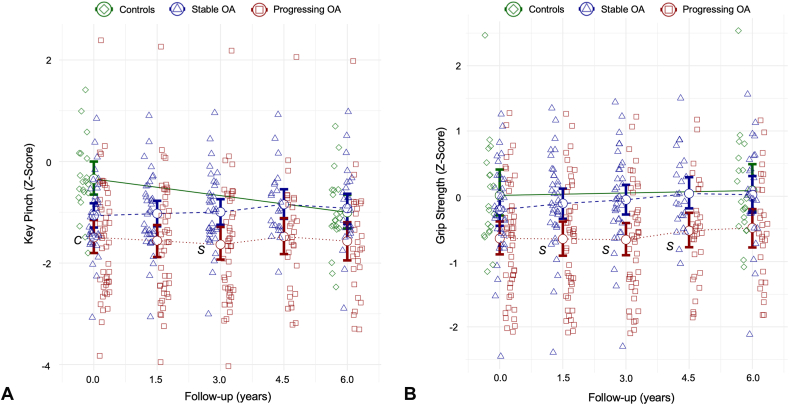
Results: Progressing OA demonstrated an increase in modified Eaton score, with clear progression by year 6. Patient-rated wrist/hand evaluation and Australian/Canadian OA hand index pain scores were elevated in both stable and progressing OA groups at baseline and year 6 compared with controls (P < .05), although minimal differences existed between stable and progressing OA. Functional scores were similarly higher in OA groups, whereas key pinch and grip strength showed little trend over time, with minor differences between stable and progressing OA.
Conclusions: Marked radiographic differences in modified Eaton score distinguish progressing from stable OA, indicating that structural progression is a key marker of disease advancement. Minimal differences in pain, functional scores, and hand strength between OA groups suggest that radiographic changes are more distinct indicators of OA progression than subjective or objective functional measures. These findings emphasize radiographic monitoring as the major parameter for OA progression.
Type of study/level of evidence: Prognostic III.
Keywords: CMC osteoarthritis; Hand strength; Modified Eaton score; Pain assessment; Radiographic progression.
© 2025 The Authors.
Conflict of interest statement
No benefits in any form have been received or will be received related directly to this article.
Figures
Similar articles
-
Dorsal Subluxation of the First Metacarpal During Thumb Flexion is an Indicator of Carpometacarpal Osteoarthritis Progression.Clin Orthop Relat Res. 2023 Jun 1;481(6):1224-1237. doi: 10.1097/CORR.0000000000002575. Epub 2023 Mar 6. Clin Orthop Relat Res. 2023. PMID: 36877171 Free PMC article.
-
Total Arthroplasty Versus Trapeziectomy With Ligamentoplasty for Trapeziometacarpal Osteoarthritis: 5-year Outcomes.Clin Orthop Relat Res. 2025 Feb 7;483(7):1312-22. doi: 10.1097/CORR.0000000000003404. Online ahead of print. Clin Orthop Relat Res. 2025. PMID: 39982026
-
What Are the Most Clinically Effective Nonoperative Interventions for Thumb Carpometacarpal Osteoarthritis? An Up-to-date Systematic Review and Network Meta-analysis.Clin Orthop Relat Res. 2025 Apr 1;483(4):719-736. doi: 10.1097/CORR.0000000000003300. Epub 2024 Nov 19. Clin Orthop Relat Res. 2025. PMID: 39560669
-
Statistical Groupings of Mental Health and Osteoarthritis Severity Correlate With 10-year Trajectories of Levels of Capability and Comfort Among People With Hip Pain: A Nationwide Prospective Cohort Study (CHECK).Clin Orthop Relat Res. 2025 Jul 16. doi: 10.1097/CORR.0000000000003612. Online ahead of print. Clin Orthop Relat Res. 2025. PMID: 40668158
-
Hyaluronic acid and other conservative treatment options for osteoarthritis of the ankle.Cochrane Database Syst Rev. 2015 Oct 17;2015(10):CD010643. doi: 10.1002/14651858.CD010643.pub2. Cochrane Database Syst Rev. 2015. PMID: 26475434 Free PMC article.
References
-
- MacDermid J.C., Grewal R., MacIntyre N.J. Using an evidence-based approach to measure outcomes in clinical practice. Hand Clin. 2009;25(1):97–111. - PubMed
-
- Hamasaki T., Choiniere M., Harris P.G., Bureau N.J., Gaudreault N., Patenaude N. Biopsychosocial factors associated with pain severity and hand disability in trapeziometacarpal osteoarthritis and non-surgical management. J Hand Ther. 2023;36(3):647–657. - PubMed
-
- Bellamy N., Campbell J., Haraoui B., et al. Dimensionality and clinical importance of pain and disability in hand osteoarthritis: development of the Australian/Canadian (AUSCAN) Osteoarthritis Hand Index. Osteoarthritis Cartil. 2002;10(11):855–862. - PubMed
-
- Packham T., MacDermid J.C. Measurement properties of the Patient-Rated Wrist and Hand Evaluation: rasch analysis of responses from a traumatic hand injury population. J Hand Ther. 2013;26(3):216–223. - PubMed
LinkOut - more resources
Full Text Sources
Research Materials
