. 2025 Sep 1;329(3):C834-C847.
doi: 10.1152/ajpcell.00357.2025. Epub 2025 Jul 31.

Hypothalamic gliosis as a potential mediator of improved glucose tolerance induced by time-restricted feeding in obese mice

Affiliations

Hypothalamic gliosis as a potential mediator of improved glucose tolerance induced by time-restricted feeding in obese mice

Camila Astudillo-Guerrero et al. Am J Physiol Cell Physiol. .

Abstract

Time-restricted feeding (TRF) has been shown to improve glycemic control, reduce liver fat, and decrease cardiovascular risk in humans and diet-induced obese (DIO) mice. However, the mechanisms associated with this improvement are not completely understood. High-fat diet (HFD)-associated hypothalamic inflammation and glial activation promote obesity and metabolic dysfunction, raising the possibility that TRF mitigates these factors. Specifically, TRF increases circulating levels of β-hydroxybutyrate (BHB), a ketone body that crosses the blood-brain barrier and has anti-inflammatory properties. Here, we evaluated whether the beneficial effects of TRF are associated with changes in hypothalamic inflammation and gliosis. Furthermore, we assessed the ability of peripheral or central administration of BHB to mimic the metabolic phenotype of TRF. Consistent with prior studies in HFD-fed mice, weight loss induced by TRF was modest, due to a transient decrease in food intake offset by a persistent reduction in energy expenditure. Despite the limited effect on body weight and adiposity, TRF markedly improved glucose tolerance in DIO mice, restoring glucose homeostasis to the level of chow-fed controls. Unexpectedly, TRF increased hypothalamic markers of gliosis in DIO mice. Finally, although TRF induced the predicted rise in circulating BHB levels, chronic systemic or ICV administration of BHB had no effect on glucose tolerance and hypothalamic gliosis. Together, these data suggest that increased hypothalamic gliosis may contribute to the improvement of glucose tolerance induced by TRF in DIO mice.NEW & NOTEWORTHY This study shows that time-restricted feeding (TRF) improves glucose tolerance in obese mice independently of weight loss. Surprisingly, this benefit is linked to increased hypothalamic gliosis, challenging the view that gliosis is solely detrimental in obesity. Although TRF elevates circulating β-hydroxybutyrate (BHB), peripheral and central BHB delivery fails to mimic TRF's glycemic benefits or affect hypothalamic gliosis. These findings suggest gliosis may play a previously unrecognized role in mediating TRF's metabolic benefits.

Keywords: hypothalamic inflammation; obesity; time-restricted feeding; β-hydroxybutyrate.


Conflict of interest statement

Declaration of competing interest

The authors state that they have no potential conflicts of interest, whether financial or otherwise.

Figures

Figure 1:
Figure 1:. The effect of TRF on body weight and body composition.
(A) Experimental design. Time restricted feeding (TRF) was conducted from ZT16 to ZT24. (B) Average body weight of mice on a chow diet (CD) and high fat diet (HFD) with ad-libitum (AD) access to food compared to those subjected to TRF. The segmented line indicates the onset of TRF at week 12. (C) Delta body weight during TRF (calculated as body weight at week 18 minus body weight at week 12). (D-G) Weekly body weight changes during TRF are displayed for CD-AD (D), CD-TRF (E), HFD-AD (FG) and HFD-TRF (G) groups. (H) Tibialis muscle, (I) Gastrocnemius muscle, (J) Epididymal white adipose tissue (epWAT), and (K) retroperitoneal white adipose tissue (rpWAT) weight measured at study termination (week 18). Data are presented as mean ± SEM from 19–20 mice per group for body weight and 15 mice per group for tissue weight (5 animals per group were intracardially perfused and tissues were not weighed). The statistical analyses used were two-way ANOVA with a Tukey post-hoc test and paired T-tests for D-G. Asterisks indicate significance levels: *p < 0.05, **p < 0.01, ***p < 0.001, ****p < 0.0001, and #p < 0.05 (comparing HFD TRF to HFD AD).
Figure 2:
Figure 2:. TRF induces a persistent reduction in energy expenditure in HFD-fed mice.
(A-D) Cumulative food intake, (E-H) energy expenditure, (I-L) respiratory exchange ratio (RER), and (M-P) ambulatory activity in HFD-fed mice subjected to TRF or with ad libitum (AD) access to food (HFD-AD, HFD-TRF) at week 1 and 4 of TRF. Grey areas in graphs indicate dark cycles and dashed lines denote food availability period in TRF mice. Data are presented as mean ± SEM from 4 mice per group. The statistical analyses used were two-way ANOVA with a Tukey post-hoc test and unpaired t-test. Asterisks indicate significance levels: *p < 0.05, **p < 0.01, ***p < 0.001, ****p < 0.0001.
Figure 3:
Figure 3:. TRF restores glucose tolerance in DIO mice.
(A) Fasting glucose levels, (B) intraperitoneal glucose tolerance test (ipGTT), and (C) the area under the curve (AUC) from the ipGTT in mice fed CD or HFD at baseline (CD Ad and CD TRF: n=20; HFD Ad: n=16; HFD TRF: n=15). (D) Fasting glucose levels, (E) ipGTT, and (F) AUC from the GTT in CD and HFD-fed mice after week 4 of TRF or continued ad-libitum access to food (CD Ad and CD TRF: n=20; HFD Ad and HFD TRF: n=19). (G) Basal insulin levels after week 6 of TRF (CD Ad and CD TRF: n=10; HFD Ad: n=9; HFD TRF: n=8). Data are presented as mean ± SEM. The statistical analyses performed were two-way ANOVA with a Tukey post-hoc test. Significant results are indicated by ****p < 0.0001, ##p < 0.01, ###p < 0.001, and ####p < 0.0001. In the GTT curves, asterisks represent comparisons with the CD-Ad group, while hash marks indicate comparisons between the HFD-Ad and HFD-TRF groups.
Figure 4:
Figure 4:. TRF 16/8 promotes an increase in circulating BHB levels during the fasting period.
Blood BHB levels were measured hourly between ZT12 and ZT17 in (A) CD and (B) HFD-fed mice subjected to TRF or maintained with ad libitum food access (n = 5 per group). Panel (C) shows BHB levels measured at ZT16 before the onset of TRF (Pre-TRF) and at the end of week 1 to 4 of TRF (n = 13 per group). Data are presented as mean ± SEM. The statistical analyses performed include unpaired T-tests for panels A and B, and two-way ANOVA with a Tukey post-hoc test for panel C. Asterisks indicate significance levels: *p < 0.05, **p < 0.01, ***p < 0.001, ****p < 0.0001.
Figure 5:
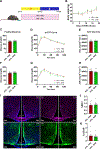
Figure 5:. Effects of TRF on markers of hypothalamic inflammation and gliosis.
Gene expression levels of (A) Tnf, (B) Il1b, (C) Il6, (D) Emr1, (E) Cd68, and (F) Gfap in HFD-fed mice with either TRF or ad libitum (AD) food access (n=9 per group). Representative immunohistochemistry images of astrocytes (GFAP) and microglia (Iba1) in the ARC of HFD-fed mice comparing animals with ad libitum (AD) food access to those with 6 weeks of TRF (G). Quantitative analysis of (I) GFAP and (H) Iba1-positive area percentage in the arcuate nucleus (ARC) was performed using six sections per animal (n=4 per group). Abbreviations: 3V, third ventricle. Data are presented as mean ± SEM. The statistical analysis performed was an unpaired t-test. Asterisks indicate significance levels: *p < 0.05
Figure 6:
Figure 6:. Peripheral administration of BHB has no impact on body weight and glucose tolerance in DIO mice.
(A) Experimental design illustrating the 6-week protocol of daily intraperitoneal (ip) injections at ZT16 of BHB or PBS vehicle into DIO mice. (B) Body weight curves during the 6 weeks of treatment. (C-E) Fasting glucose (C), ipGTT (D), and area under the curve (AUC) from the ipGTT (E) in HFD-PBS and HFD-BHB groups before starting the treatment (n=12 per group). (F-H) Fasting glucose (F), ipGTT (G), and AUC (H) at week 6 of BHB or PBS daily ip injections (HFD-PBS: n=12, HFD-BHB: n=11). (I) Experimental design featuring subcutaneous infusion of BHB or vehicle into DIO mice using an osmotic minipump for 28 days. (J) Body weight curves during the 28-day treatment. (K-M) Fasting glucose (K), ipGTT (L), and AUC (M) at baseline, prior to minipump implantation (n=5 per group). (N-P) Fasting glucose levels (N), ipGTT (O), and AUC (P) in HFD-fed mice infused with BHB or PBS for 28 days (n=5 per group). Data are presented as mean ± SEM. The statistical analysis performed was an unpaired t-test.
Figure 7:
Figure 7:. Central BHB improves glucose tolerance in DIO mice.
(A) Experimental design. BHB or vehicle was infused intracerebroventricularly into DIO mice using an osmotic minipump for 28 days. (B) Body weight curves during the treatment period. (C) Fasting glucose, (D) ipGTT, and (E) AUC in HFD-fed mice prior to infusion (n= 10 per group). (F) Fasting glucose, (G) ipGTT, and (H) AUC in HFD-fed mice infused with BHB or PBS for 28 days (n= 10 per group). Representative images of astrocytes (GFAP) and microglia (Iba1) (I) in the mediobasal hypothalamus of HFD-fed mice, comparing animals with PBS infusion to those with BHB infusion for 28 days. Quantitative analysis of (J) Iba1 and (K) GFAP -positive area percentage in the arcuate nucleus (ARC) was performed using six sections per animal (n=10 per group). Abbreviations: 3V, third ventricle. Data are presented as mean ± SEM. The statistical analysis performed was an unpaired t-test. Asterisks indicate significance levels: *p < 0.05

Similar articles

References

    1. Sutton EF, Beyl R, Early KS, Cefalu WT, Ravussin E, and Peterson CM. Early Time-Restricted Feeding Improves Insulin Sensitivity, Blood Pressure, and Oxidative Stress Even without Weight Loss in Men with Prediabetes. Cell Metab 27: 1212–1221 e1213, 2018. - PMC - PubMed
    1. Schroder JD, Falqueto H, Manica A, Zanini D, de Oliveira T, de Sa CA, Cardoso AM, and Manfredi LH. Effects of time-restricted feeding in weight loss, metabolic syndrome and cardiovascular risk in obese women. J Transl Med 19: 3, 2021. - PMC - PubMed
    1. Hutchison AT, Regmi P, Manoogian ENC, Fleischer JG, Wittert GA, Panda S, and Heilbronn LK. Time-Restricted Feeding Improves Glucose Tolerance in Men at Risk for Type 2 Diabetes: A Randomized Crossover Trial. Obesity (Silver Spring) 27: 724–732, 2019. - PubMed
    1. Feehan J, Mack A, Tuck C, Tchongue J, Holt DQ, Sievert W, Moore GT, de Courten B, and Hodge A. Time-Restricted Fasting Improves Liver Steatosis in Non-Alcoholic Fatty Liver Disease-A Single Blinded Crossover Trial. Nutrients 15: 2023. - PMC - PubMed
    1. Melkani GC, and Panda S. Time-restricted feeding for prevention and treatment of cardiometabolic disorders. J Physiol 595: 3691–3700, 2017. - PMC - PubMed

LinkOut - more resources