. 2025 Aug 19;10(8):e0071325.
doi: 10.1128/msystems.00713-25. Epub 2025 Jul 31.

The diverse phenotypic and mutational landscape induced by fluoroquinolone treatment

Affiliations

The diverse phenotypic and mutational landscape induced by fluoroquinolone treatment

Sayed Golam Mohiuddin et al. mSystems. .

Abstract

Antibiotic resistance remains a major public health challenge, yet the broader effects of antibiotic treatment on bacterial tolerance, resistance, and fitness are not fully understood. In this study, we investigated how Escherichia coli adapts to fluoroquinolone stress using adaptive laboratory evolution. Cell populations were subjected to repeated cycles of high-dose ofloxacin exposure followed by drug-free recovery, a dynamic model that imposes alternating selective pressure and inter-strain competition, reflecting real-world clinical or environmental conditions. Our results demonstrate that tolerance and resistance can evolve independently, even under identical conditions, leading to diverse phenotypic outcomes. Notably, we observed the emergence of mutants with high ofloxacin tolerance but reduced minimum inhibitory concentrations, an outcome that challenges conventional understanding. Fitness traits, including lag phase duration, doubling time, competition score, redox activity, and ATP levels, were variably affected across evolved strains, with no consistent correlation between fitness and tolerance or resistance. Whole-genome sequencing revealed both known and novel mutations, with limited convergence across populations. For example, while mutations in the icd gene were commonly observed, many other mutations, including in cyoE, lgoT, yghC, rnd, dld, and uidB, were unique to individual lineages. The lack of convergence across evolved populations may reflect the influence of competitive dynamics during recovery phases, where differing growth advantages shape selection in parallel with antibiotic pressure. These findings underscore the complexity of microbial adaptation and highlight how fluctuating environments and population-level interactions can drive non-uniform evolutionary outcomes.IMPORTANCEAntibiotic resistance poses a critical global health threat, with antibiotic-tolerant cells further complicating treatment by promoting infection relapse and enabling resistance mutations. Though tolerant cells can evolve into resistant strains, their phenotypic and genotypic characteristics are still poorly understood. In this study, we used adaptive laboratory evolution to generate several distinct ofloxacin-resistant mutants and examined their fitness (e.g., lag phase), metabolic traits (e.g., ATP levels), and genetic adaptations through whole-genome sequencing. We uncovered novel findings, including highly tolerant mutants exhibiting unexpectedly low minimum inhibitory concentrations and others with shorter lag phases, challenging conventional patterns in bacterial resistance evolution. Our findings provide critical insights into the diverse pathways and mechanisms underpinning bacterial adaptation, underscoring the complexity of resistance evolution.

Keywords: adaptive laboratory evolution; antibiotic resistance; antibiotic tolerance; bacterial fitness factors; fluoroquinolone; mutagenesis; resistant mutants.


Conflict of interest statement

The authors declare no conflict of interest.

Figures
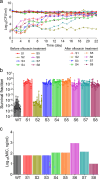
Fig 1
Fig 1
Generation of ofloxacin mutant strains using adaptive laboratory evolutionary experiment. (a) Stationary phase E. coli MG1655 MO cells (16-h culture) carrying the pUA66-empty vector were diluted 1:100 in LB and treated with ofloxacin (5 µg/mL) for 7 h. After washing, half of the cells were transferred to fresh LB for overnight recovery, while the other half were plated to determine colony-forming units (CFU). This cycle was repeated daily for 22 days. CFU levels before and after treatment are shown in the plot. n = 1. (b) Stationary phase cells of 10 randomly picked colonies of the indicated strains were diluted 100-fold in LB and treated with ofloxacin (5 µg/mL) for 7 h. After the treatment, cells were washed and plated on LB agar to determine the survival fractions. n = 10 (10 independent colonies; each tested in triplicate). (c) MICs of 10 randomly selected colonies from each sample (88 total, including wild type) were measured using the twofold microdilution method in 96-well plates, with antibiotic concentrations adjusted to match the ETEST conditions (note: MICs for samples S1–S8 were determined using ofloxacin ETEST strips; see Fig. S2). MICs were calculated as the average of the lowest concentration showing visible growth and the highest showing no growth. n = 10 (10 independent colonies). Data corresponding to each time point represent mean value ± standard error.
Fig 2
Fig 2
Determination of fitness factors and metabolic activities of the evolved strains. (a) Growth curves of the mutants and the WT strain (control). Stationary phase cells were diluted 100-fold in LB media and cultured for 24 h. At designated time points, cells were collected to measure OD600 using a plate reader. These growth curves were utilized to determine the lag scores and doubling times (for details, see Materials and Methods). n = 4. (b) Flow-cytometry-based approach for the quantification of non-growing cell levels. The mutants and WT cells (harboring an isopropyl β-D-1-thiogalactopyranoside [IPTG]-inducible mCherry expression cassette in their genome) were cultured overnight in the presence of 1 mM IPTG to express the mCherry protein. Stationary phase cells were collected and washed to remove the IPTG and diluted 100-fold in LB media and grown in a shaker in the absence of IPTG. Cell division along with protein dilution was monitored using a flow cytometer at single-cell levels at the indicated time points. Non-growing cells retained their mCherry levels. A representative biological replicate is shown, with all three biological replicates consistently yielding similar trends. n = 3. (c) Competition assays for mutants and WT strains in cocultures. Mutants (harboring pUA66-EV) and WT cells (harboring pUA66-gfp) were cultured individually overnight (16 h) in the presence of 1 mM IPTG in LB media. Stationary phase cells of the mutants and WT cells were diluted 100-fold in LB and cocultured in the presence of 1 mM IPTG for 24 h. At t = 24, cells were collected, diluted in PBS, and analyzed with a flow cytometer at the single-cell level, showing two distinct cell populations. For WT, red dots represent WT cells carrying both mCherry and green fluorescent protein (GFP) expression systems, while black dots represent WT cells carrying only the mCherry expression system. For samples S1–S8, red dots represent WT cells carrying both mCherry and GFP expression systems, while black dots represent the mutant cells carrying only the mCherry expression system. A representative biological replicate is shown, with all three biological replicates consistently yielding similar trends. n = 3. (d) Redox Sensor Green (RSG) staining of stationary phase cells. Stationary phase mutants and WT cells were stained with RSG dye and analyzed with a flow cytometer to measure their metabolic activities. A representative flow cytometry diagram is shown. All independent biological replicates showed a similar trend. n  =  3. Data corresponding to each time point represent the mean value ± standard error.
Fig 3
Fig 3
Correlation between survival fractions, fitness factors, and metabolic parameters of mutant strains. All data for this analysis are from Fig. 2a through d and Fig. S4a through f. Correlation between survival fractions and (a) lag scores, (b) doubling times, (c) non-growing scores, (d) competition scores, (e) cellular redox state, and (f) ATP levels. Pearson correlation was performed between survival fractions and each parameter for the mutant and WT strains. P values (for statistically significant correlations) and R2 values are shown on the graphs. Data corresponding to each time point represent the mean value ± standard error.
Fig 4
Fig 4
The whole-genome sequencing reveals that various types of mutations have occurred within the evolved strains. A Venn diagram illustrates the mutations identified in the mutants as a result of the adaptive laboratory evolution experiment, including (a) insertions and deletions, (b) structural variations, and (c) single nucleotide polymorphisms.
Fig 5
Fig 5
Survival fraction, MIC, fitness factors, and metabolic activities of the single mutants revealed new genetic determinants for tolerance. (a) Stationary phase cells of the designated individual single mutants were exposed to ofloxacin (5 µg/mL) after diluting 100-fold in LB media for 7 h. Treated cells were collected, washed, and plated on LB agar plates to enumerate the CFU levels. n = 4. (b) Indicated single mutants were diluted to have ~108–109 cells/mL and spread on a circular LB agar plate. Agar plates were dried for 20 min next to the flame. Ofloxacin ETEST strips were placed on the dried agar plates and incubated for 16 h to determine the minimum inhibitory concentrations. n = 3. (c) Lag scores of the indicated individual mutant strains were calculated using the growth curves (Fig. S5). n = 4. (d) Doubling times of the indicated individual strains were calculated using the exponential phase of the growth curves (Fig. S5). n = 4. (e) Stationary phase cells of individual single mutants were stained with RSG dye and analyzed with a flow cytometer to determine the metabolic state of the cells (Fig. S6). n = 4. (f) Stationary phase cells of the indicated strains were collected to measure the intracellular ATP concentrations (see Materials and Methods). A flow cytometer was used to count the cell number for normalization purposes. n = 4. Statistical analysis was performed between the WT and single mutants using one-way ANOVA with Dunnett’s post-test. *P < 0.05, **P  <  0.01, ***P  <  0.001, and ****P  <  0.0001. Data corresponding to each time point represent the mean value ±  standard error.
Fig 6
Fig 6
Correlation between survival fractions, fitness factors, and metabolic parameters of knockout strains. All data are from Fig. 5B through f. Pearson correlation analysis was performed between survival fractions and (a) MIC, (b) lag scores, (c) doubling times, (d) cellular redox states, and (e) ATP levels of single knockout strains. P values (for statistically significant correlations) and R2 values (Pearson correlation) are shown on the graphs. Data are presented as mean ± standard error.

Similar articles

References

    1. Laxminarayan R. 2022. The overlooked pandemic of antimicrobial resistance. Lancet 399:606–607. doi: 10.1016/S0140-6736(22)00087-3 - DOI - PMC - PubMed
    1. Ventola CL. 2015. The antibiotic resistance crisis: part 1: causes and threats. P T 40:277–283. - PMC - PubMed
    1. Salam MdA, Al-Amin MdY, Salam MT, Pawar JS, Akhter N, Rabaan AA, Alqumber MAA. 2023. Antimicrobial resistance: a growing serious threat for global public health. Healthcare (Basel) 11:1946. doi: 10.3390/healthcare11131946 - DOI - PMC - PubMed
    1. Coque TM, Graham DW, Pruden A. 2023. Bracing for superbugs: strengthening environmental action in the One Health response to antimicrobial resistance. In So ET, Grooters SV (ed), United Nations Environment Programme. Newcastle University.
    1. Tang KWK, Millar BC, Moore JE. 2023. Antimicrobial Resistance (AMR). Br J Biomed Sci 80:11387. doi: 10.3389/bjbs.2023.11387 - DOI - PMC - PubMed

LinkOut - more resources