. 2025 Nov 3;15(11):2278-2297.
doi: 10.1158/2159-8290.CD-25-0247.

Sucralose Consumption Ablates Cancer Immunotherapy Response through Microbiome Disruption

Affiliations

Sucralose Consumption Ablates Cancer Immunotherapy Response through Microbiome Disruption

Kristin M Morder et al. Cancer Discov. .

Abstract

Gut microbiota composition is directly associated with response to immunotherapies in cancer. The impact of diet on the gut microbiota and downstream immune responses to cancer remains unclear. In this study, we show that consumption of a common nonnutritive sweetener, sucralose, modifies microbiome composition, restricts T-cell metabolism and function, and limits immunotherapy response in preclinical models of cancer and patients with advanced cancer treated with anti-PD-1-based immune checkpoint inhibitors. Sucralose consumption is associated with a reduction in microbiota-accessible arginine, and amino acid supplementation or fecal microbiome transfer from anti-PD-1 responder mice completely restores T-cell function and immunotherapy response. Overall, sucralose consumption destabilizes the gut microbiota, resulting in compromised T-cell function and ablated immune checkpoint inhibitor response in cancer.

Significance: This study highlights an unappreciated role of sucralose in reducing immunotherapy efficacy in both mouse models and samples from patients with cancer through shifts in the microbiome and arginine degradation that lead to T-cell exhaustion. T-cell function and immunotherapy responses are restored through amino acid supplementation. See related commentary by Chandra et al., p. 2196.


Conflict of interest statement

Z.L. Dahmani reports grants from NIH during the conduct of the study. L.P. Kane reports grants from NIH during the conduct of the study. G.M. Delgoffe reports grants and personal fees from Novasenta and RemplirBio outside the submitted work. D. Davar reports other support from Immunocore, Replimmune, Castle Biosciences, Regeneron, mBiomics, and Zola, personal fees from ACM Bio, Ascendis, Castle, Clinical Care Options, Gerson Lehrman Group, Immunitas, Medical Learning Group, Replimmune, Trisalus, and Xilio Therapeutics, and grants from Arcus, Immunocore, Merck, Regeneron, and Tesaro/GSK,\ outside the submitted work, as well as Intellectual Property: US Patent 63/124,231, “Compositions and Methods for Treating Cancer”, December 11, 2020 and US Patent 63/208,719, “Compositions and Methods For Responsiveness to Immune Checkpoint Inhibitors (ICI), Increasing Effectiveness of ICI and Treating Cancer”, June 9, 2021. No disclosures were reported by the other authors.

Figures
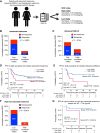
Figure 1.
Figure 1.
NNS intake is associated with poor response to ICI in advanced melanoma, advanced NSCLC, and neoadjuvant melanoma. A, Patients with advanced melanoma, advanced NSCLC, and neoadjuvant melanoma pending receipt of ICI therapy completed web-based semi-quantitative FFQ DHQ III. Response to therapy was evaluated using investigator-assessed ORR using RECIST v1.1 or pathologist-assessed immune-related pathologic response criteria, along with time-to-event analyses including PFS (advanced melanoma or NSCLC) or RFS (neoadjuvant melanoma). RFS/PFS were evaluated every 3 months, and relapse/progression was defined based on radiographic and/or clinical relapse/progression at each treatment visit (every 3–4 weeks). A, Patients were dichotomized into high- and low-intake groups based on cutpointr-determined endpoints. B and C, Proportion of investigator-assessed ORR in either melanoma (B) or NSCLC (C) cohorts. χ2P values comparing responder ORR between high vs. low intake are shown. D and E, Kaplan–Meier plots of PFS probability of patients with ICI-treated melanoma (D) and NSCLC (E) based on dichotomized sucralose intake levels by a two-sided log-rank test are shown. The number of people at risk in either group (high vs. low intake) is shown below each panel. Vertical ticks show censored data. F, Proportion of pathologist-assessed MPR (defined as 0%–10% residual viable tumor) between high and low sucralose intake in patients with high-risk resectable melanoma treated with nivolumab and TLR9 agonist vidutolimod. χ2P values comparing responder MPR between high and low intake are shown. G, Kaplan–Meier plots of RFS probability of patients with neoadjuvant nivolumab-/vidutolimod-treated melanoma based on dichotomized sucralose intake levels by a two-sided log-rank test are shown. The number of people at risk in either group (high vs. low intake) is shown below each panel. Vertical ticks show censored data.
Figure 2.
Figure 2.
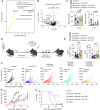
Sucralose ablates immunotherapeutic responses. C57BL/6 mice from Taconic consumed sucralose in the drinking water (0.09 mg/mL) for 2 weeks prior to tumor injection and for the duration of the experiment. Mice were injected with 2.5 × 10⁵ MC38 cells subcutaneously and treated with 200 µg anti–PD-1 on days 9, 12, and 15. Tumor area was measured every 3 days until endpoint. A, Experimental schematic. B, Tumor growth curves of mice consuming sucrose or sucralose in the drinking water during treatment with anti–PD-1. CR, complete response. C, Tumor growth curves in MC38 subcutaneous (circles) or B16 intradermal (squares) treated with anti–PD-1. Mice were sourced from either The Jackson Laboratory (Jax, open circles) or Taconic Biosciences (Taconic, closed circles). Mice were removed from study either when tumors reached 2 cm in either direction or if there was unresolved ulceration. Mean tumor growth lines halt once all mice in a treatment group were removed. D and E, C57BL/6 mice from either Taconic (D) or Jackson (E) consumed sucralose in their drinking water as in (C). They were subjected to the AOM-DSS protocol (injected with 10 mg/kg AOM on day 0 and given 3% DSS in the drinking water on days 7–14 and 28–35). Overall tumor number and composition of “large” tumors (>2 mm in any direction) are shown. Data are a composite of three (C) or two (B and D) independent experiments with five mice per group per experiment. Error bars represent the mean ± SEM. A two-way ANOVA (C) or Student t test (D) was used. *, P < 0.05; ns, not significant.
Figure 3.
Figure 3.
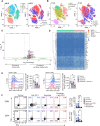
Sucralose alters the tumor microenvironment and supports T-cell dysfunction. C57BL/6 mice from Taconic consumed sucralose in the drinking water (0.09 mg/mL) for 2 weeks prior to tumor injection and for the duration of the experiment. Mice were injected with 2.5 × 10⁵ MC38 cells subcutaneously and treated with 200 µg anti–PD-1 on days 9 and 12. A–D, CD45+ cells were isolated from the tumor and tdLN prior to single-cell RNA sequencing on day 14 after tumor injection. A and B, Uniform Manifold Approximation and Projection of clusters identified in tdLN (A) and tumor (B) in mice treated with anti–PD-1 ± sucralose. tSNE, t-distributed stochastic neighbor embedding. C, Volcano plot of gene expression from CD8+ T cells in the tumor of sucralose + anti–PD-1 vs. anti–PD-1–treated mice. D, Exhaustion signature heatmap for CD8+ T cells in the tumor comparing sucralose + anti–PD-1 (purple) with anti–PD-1 (teal). E, Representative flow cytometry plots and quantification of MitoTracker DeepRed staining in CD8+ T cells or CD4+ Tconv cells from tdLN. F, Representative flow cytometry plots of TNFα and IFNγ staining in CD8+ T cells and CD4+ Tconv cells in the tumor tissue of mice consuming sucralose and/or anti–PD-1. Responder mice in anti–PD-1 ± sucralose groups are shown as diamonds. Data are representative (E) or a composite (F) of three or one (A–E) independent experiments, respectively, with five mice per group per experiment. Error bars represent the mean ± SEM. A one-way ANOVA with the Tukey multiple comparisons test (E and F) was used. *, P < 0.05; **, P < 0.005.
Figure 4.
Figure 4.
The gut microbiota is necessary and sufficient to drive immunotherapy resistance due to sucralose. A, Mice consumed sucralose (0.09 mg/mL) in the drinking water for 14 days prior to antibiotic treatment and for the duration of the experiment. After 21 days of sucralose supplementation with or without antibiotics, mice were injected with 2.5 × 10⁵ MC38 cells subcutaneously and treated with anti–PD-1 on days 9, 12, and 15. B, Tumor growth curve and overall survival plot of experiment described in A. CR, complete response. C, FMT experimental overview. Donor mice (red) were given sucralose-supplemented drinking water (0.09 mg/mL) for 2 weeks prior to donating stool. Stool was transferred to sucralose-naïve recipient mice (light pink) that had received broad-spectrum antibiotics for 7 days prior to transfer. Tumors were injected as previously described in 4A and measured until endpoint. D, Tumor growth curve of the experiment described in C. Data are a composite of three (B and C) independent experiments with five mice per group per experiment. Error bars represent the mean ± SEM. Two-way ANOVA (B and D) was used. *, P < 0.05.
Figure 5.
Figure 5.
Responder-derived FMT is sufficient to restore immunotherapeutic response. A, Individual tumor growth curves from Fig. 4D with FMT. B and C, C57BL/6 mice from Taconic consumed sucralose in the drinking water (0.09 mg/mL) for 2 weeks prior to tumor injection and for the duration of the experiment. Mice were injected with 2.5 × 10⁵ MC38 cells subcutaneously and treated with 200 µg anti–PD-1 on days 9, 12, and 15. Tumor area was measured every 3 days until endpoint. Four groups all received an FMT from an anti–PD-1 responder mouse donor. The following four groups were used: antibiotic treatment pre-FMT, continued sucralose consumption (hot pink), antibiotic treatment pre-FMT, stopped sucralose consumption (light pink), no antibiotics, continued sucralose consumption (purple), no antibiotics, stopped sucralose consumption (light blue). Individual tumor growth curves (B) and a composite growth curve and OS (C) are shown. Data are a composite of three (A) or two (B and C) independent experiments with five mice per group per replicate. Error bars represent the mean ± SEM. For growth curve statistics, two-way ANOVA was used. OS statistics were calculated using a log-rank Mantel–Cox test. *, P < 0.05. abx, antibiotics; CR, complete response.
Figure 6.
Figure 6.
Sucralose consumption shifts gut microbiome diversity and function. C57BL/6 mice from Taconic consumed sucralose in the drinking water (0.09 mg/mL) for 2 weeks prior to tumor injection and for the duration of the experiment. Mice were injected with 2.5 × 10⁵ MC38 cells subcutaneously and treated with 200 µg anti–PD-1 on days 9, 12, and 15. A, Principal coordinate analysis (PCoA) plot of the gut microbiome of sucralose-consuming vs. -abstaining mice on day 38. Serial stool collections were obtained on days 0, 14, 28, and 38 after the start of sucralose consumption and sent for shallow shotgun sequencing. B, Cladogram with significantly overexpressed taxa in anti–PD-1 or sucralose + anti–PD-1 groups at day 38. In the cladogram, the size of the circle (node) encodes the –log10(FDR) value. C, Taxonomic relative abundance bar plots for the groups at day 38. Percent abundance on the y-axis indicates the mean abundance for all mice within each group. Asterisks label bacterial species that are arginine degrading and enriched in sucralose-consuming groups. D, Functional pathway analysis of sucralose + anti–PD-1 vs. anti–PD-1. Bar chart shows significant pathways with the default MaAsLin2 fdr threshold of <0.25. The MaAsLin2 coef value is reported on the x-axis. E, Functional pathway analysis of the arginine degradation pathway between sucralose + anti–PD-1 and anti–PD-1. Heatmap shows fold change of arginine-degrading enzymes expressed by bacteria in sucralose-consuming groups. Data are representative of one independent experiment with five mice per group. FDR, false discovery rate.
Figure 7.
Figure 7.
Citrulline supplementation restores T-cell function and immunotherapy efficacy. A–C, Serum and TIF were isolated from mice consuming sucralose-supplemented (0.09 mg/mL) drinking water or regular drinking water for 14 days prior to tumor injection and throughout tumor growth. High-resolution LC-HRMS metabolomic analysis was performed. A, Pathway analysis of TIF, with significant pathways shown. B, Volcano plot comparing metabolite abundance from the TIF of mice consuming sucralose in the drinking water vs. regular water. C, Quantification of arginine abundance within the serum and TIF of mice indicated. D, Taconic mice were given sucralose-supplemented (0.09 mg/mL) or control drinking water in the presence of absence of arginine or citrulline (3.75 mg/mL) for 2 weeks prior to tumor injection and throughout the duration of the experiment. Mice were injected with 2.5 × 10⁵ MC38 cells subcutaneously and treated with 200 µg anti–PD-1 at days 9, 12, and 15. E, Quantification of IFNγ+ CD8+ T cells and CD4+ Tconv cells within the tumor 14 days after tumor injection. F and G, Tumor growth curves of mice from experiment described in D. G, Tumor growth curves from experiment described in D. Data are a composite of three (E–H), two (C), or one (A and B) independent experiments with 3–5 mice per group per experiment. Error bars represent the mean ± SEM. The Student t test (C), one-way ANOVA with the Tukey multiple comparisons test (E), two-way ANOVA (F and G), and Mantel–Cox (H) were used. *, P < 0.05; **, P < 0.005; ****, P < 0.00005.

References

    1. Aggarwal V, Workman CJ, Vignali DAA. LAG-3 as the third checkpoint inhibitor. Nat Immunol 2023;24:1415–22. - PMC - PubMed
    1. Olivares-Hernández A, González Del Portillo E, Tamayo-Velasco Á, Figuero-Pérez L, Zhilina-Zhilina S, Fonseca-Sánchez E, et al. Immune checkpoint inhibitors in non-small cell lung cancer: from current perspectives to future treatments-a systematic review. Ann Transl Med 2023;11:354. - PMC - PubMed
    1. Tumeh PC, Harview CL, Yearley JH, Shintaku IP, Taylor EJM, Robert L, et al. PD-1 blockade induces responses by inhibiting adaptive immune resistance. Nature 2014;515:568–71. - PMC - PubMed
    1. Fortman D, Karunamurthy A, Hartman D, Wang H, Seigh L, Abukhiran I, et al. Automated quantitative CD8+ tumor-infiltrating lymphocytes and tumor mutation burden as independent biomarkers in melanoma patients receiving front-line anti-PD-1 immunotherapy. Oncologist 2024;29:619–28. - PMC - PubMed
    1. Herbst RS, Soria J-C, Kowanetz M, Fine GD, Hamid O, Gordon MS, et al. Predictive correlates of response to the anti-PD-L1 antibody MPDL3280A in cancer patients. Nature 2014;515:563–7. - PMC - PubMed

LinkOut - more resources