. 2025 Oct 1;85(19):3614-3632.
doi: 10.1158/0008-5472.CAN-24-3267.

Elevated Transglutaminase-2 in SOX10-Deficient Melanoma Promotes Tumor Onset and Decreases Intratumoral CD4+ T Cells

Affiliations

Elevated Transglutaminase-2 in SOX10-Deficient Melanoma Promotes Tumor Onset and Decreases Intratumoral CD4+ T Cells

Signe Caksa et al. Cancer Res. .

Abstract

Melanoma heterogeneity contributes to therapy resistance and immune evasion. The loss of SOX10, a neural crest lineage-specific transcription factor, leads to phenotypic switching from a proliferative cell state to an invasive, drug-tolerant cell state. SOX10-deficient cells are able to persist during immunotherapy treatment, highlighting the need to characterize the factors that regulate immune evasion downstream of SOX10 loss. In this study, we found that SOX10-deficient melanoma cell lines and patient samples express elevated levels of TGM2, a transglutaminase family member. TGM2 upregulation in SOX10 knockout cells was reversed by inhibition of epigenetic reader BET proteins. Knockdown of TGM2 did not affect the SOX10-deficient invasive cell state; however, overexpression of TGM2 in syngeneic melanomas promoted tumor onset in immunocompetent mice, but not in immunodeficient mice, suggesting an immune-mediated effect. TGM2 overexpression in melanoma was associated with decreased intratumoral CD4+ T cells, and depletion of CD4+ T cells abolished the tumor-promoting effect of TGM2. These data indicate that TGM2 is negatively regulated by SOX10 in melanoma and can promote an immunosuppressive tumor microenvironment.

Significance: The transglutaminase TGM2 is negatively associated with the neural crest lineage-specific transcription factor SOX10 and is an immunomodulatory protein in cutaneous melanoma.


Conflict of interest statement

Conflict of Interest Statement: A.E. Aplin has ownership interest in patent number 9880150 and has a pending patent, PCT/US22/76492. All other authors declare they have no competing interests.

Figures

Figure 1:
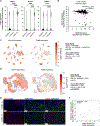
Figure 1:. TGM2 expression and activity is upregulated in SOX10-knockout cells
A. A375 and MeWo parental control and SOX10-knockout cell lysates were collected for RPPA analysis. Pavlidis Template Matching was used to identify proteins upregulated in SOX10-knockout cell lines compared to parental control cells (p-value threshold < 0.05). A heatmap of log2-transformed median-centered average expression for template-matched proteins is shown. B. Human (A375, MeWo) or mouse (1014, YUMM1.1) parental control or SOX10-knockout cells were lysed and lysates were probed for the indicated proteins by Western blot. C. A375 or MeWo parental control or SOX10-knockout cells were grown in serum-free media for 48 hours. Supernatant was concentrated and analyzed for TGM2 by ELISA. D. Cells were cultured in serum-free media for 48 hours, supernatant was concentrated, and lysates were probed for TGM2 by Western Blot. E. A375 or MeWo parental control or SOX10-knockout cells were collected, and TGM2 deamidation activity was determined as described in the Materials and Methods. Data are representative of three independent experiments, except for the supernatant Western blots in (B), where two independent experiments were conducted. Bar graphs show mean + SD. Significant comparisons are shown. *p<0.05, **p<0.01, ***p<0.001, ****p< 0.0001.
Figure 2:
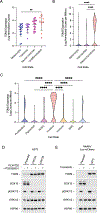
Figure 2:. TGM2 is inversely associated with SOX10 in melanoma patient samples
A. Violin plots display TGM2 expression in 10x Genomics scRNA-seq data from primary melanoma cultures MM057, MM074, and MM087 following 72 hours of SOX10 knockdown. B. V2 RSEM bulk RNA-seq data from the Firehose Legacy SKCM TCGA database was used to plot TGM2 expression against SOX10 expression in metastatic melanoma patient samples. A Pearson’s correlation and the corresponding p-value are shown. C. SOX10 and TGM2 expression from scRNA-seq data of malignant cells from Jerby-Arnon et al. was visualized as tSNE plots (31). Each circle represents an individual cancer cell, whereas clusters represent tumors. A zero-inflated negative binomial (ZINB) regression model was used to model scRNA-seq counts of TGM2 as dependent on SOX10 counts, using the total scRNA-seq counts per cell as exposure. D. As in (C), except scRNA-seq data of malignant cells from Pozniak et al. was used (11). E. Representative images of mIF staining for SOX10, TGM2 and DAPI performed on melanoma patient samples from Thomas Jefferson University Hospital. Scale bar, 50μm. F. Proportion of spatial clusters from mIF tumor tissue images with a negative (TGM2, SOX10) spatial correlation coefficient per tumor, versus mean TGM2 expression in the tumor. Spearman’s correlation and corresponding p-value is shown. Significant comparisons are shown. *p<0.05, ****p< 0.0001.
Figure 3:
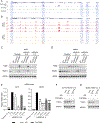
Figure 3:. TGM2 is elevated in mesenchymal-like cell states and drug-tolerant melanoma cells
A. Bulk RNA-seq data from melanoma cell lines from Tsoi et al. was examined for expression of TGM2 according to cell state (30). B. scRNA-seq data from primary melanoma cultures from Wouters et al. was examined for TGM2 expression according to cell state (5). C. scRNA-seq data from a drug-tolerant persister cell patient-derived xenograft model from Rambow et al. was examined for TGM2 expression according to cell state (3). D. A375 parental control or drug-tolerant CRT cells were treated with 1μM PLX4720 (BRAF inhibitor) plus 35nM PD325901 (MEK inhibitor) for 24 hours, lysed, and lysates were probed for the indicated proteins by Western blot. E. As in (D), except MeWo/Luc-mCherry parental control or drug-tolerant MTC cells were treated with 50nM trametinib (MEK inhibitor). Western blot data are representative of three independent experiments. Significant comparisons are shown. **p<0.01, ****p< 0.0001.
Figure 4:
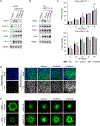
Figure 4:. BET inhibition downregulates TGM2 in SOX10-knockout cells
A. ATAC-seq data from ‘mesenchymal-like’, ‘intermediate’, or ‘melanocytic’ primary melanoma cultures from Wouters et al. was visualized at the TGM2 locus using the UCSC Genome Browser (5). Blue highlights correspond to areas of differential chromatin opening between melanoma cell states. B. As in (A), except time course ATAC-seq data from MM057 and MM087 primary melanoma cultures following SOX10 knockdown was visualized. C. A375 parental control or SOX10-knockout cells were treated with 1μM JQ1, 3μM PLX51107, or 500nM PLX72853 for 72 hours, lysed, and lysates were probed for the indicated proteins by Western blot. D. As in (C), except MeWo parental control or SOX10-knockout cells were used. E. A375 crSOX10 2.18 or MeWo crSOX10 4.11 cells were treated with 1μM JQ1 or 500nM PLX72853 for 0, 6, or 24 hours. RNA was isolated, and RT-qPCR was performed for TGM2 mRNA. GAPDH was used as an internal control. TGM2 expression is normalized to 0 hours for each cell line, and untreated A375 and MeWo parental cells were used as negative controls. F. A375 crSOX10 2.18 cells were treated with 1μM JQ1 or 500nM PLX72853 for 0, 6, or 24 hours. Cells were lysed and lysates were probed for the indicated proteins by Western blot. G. As in (F), except MeWo crSOX10 4.11 cells were used. All data are representative of three independent experiments, except the RT-qPCR data in (E), where two independent experiments with three technical replicates were conducted. Bar graphs show mean + SD. Significant comparisons are shown. **p<0.01, ***p<0.001, ****p< 0.0001
Figure 5:
Figure 5:. TGM2 knockdown does not affect the growth or invasiveness of SOX10-knockout cells
A. MeWo parental control or crSOX10 2.1 cells were treated with a non-targeting control siRNA or a siRNA against TGM2 for 72 hours. Cells were lysed and lysates were probed for the indicated proteins by Western blot. B. As in (A), except 1014 parental control and crSOX10 1.30 cells were used. C. MeWo crSOX10 2.1 or 1014 crSOX10 1.30 cells were treated with a non-targeting control siRNA or a siRNA against TGM2 for 96 hours. Cells were imaged using a live-cell imaging system at the indicated time points. D. MeWo parental control and crSOX10 2.1 cells were plated onto coverslips coated with 0.2% gelatin. SOX10-knockout cells were treated with a non-targeting control siRNA or a siRNA against TGM2 for 24 hours before plating. The next day, cells were treated with 50μg/mL ascorbic acid every 48 hours for 6 days. Cells were permeabilized, fixed, and stained for fibronectin (FN1) in green, and nuclei were stained with DAPI in blue. Scale bar, 100μm. E. MeWo parental control and crSOX10 2.1, or 1014 parental control and crSOX10 1.30, 3D spheroids grown in collagen were stained for live cells using Calcein AM. SOX10-knockout cells were treated with a non-targeting control siRNA or a siRNA against TGM2. Representative images are shown. Scale bar, 500μm. All data are representative of three independent experiments, except the extracellular matrix staining data in (D) and the 1014 spheroids in (E), where two independent experiments were conducted. Bar graphs show mean + SD. Significant comparisons are shown. *p<0.05.
Figure 6:
Figure 6:. TGM2 promotes the onset of intradermally injected tumors in immunocompetent mice
A. An empty vector (EV) or mouse TGM2 was stably overexpressed in YUMMER1.7 and D4MUV2 mouse cell lines. Cells were lysed and lysates were probed for the indicated proteins by Western blot. B. YUMMER1.7-EV and YUMMER1.7-TGM2 or D4MUV2-EV and D4MUV2-TGM2 cells were plated in a 6-well plate and imaged using a live-cell imaging system at the indicated time points. Bar graphs show mean + SD. Data are representative of four independent experiments. C. YUMMER1.7-EV (n=12) or YUMMER1.7-TGM2 (n=13) cells were injected into the flanks of C57BL/6 mice and tumors were measured by caliper every 2–3 days. Tumor onset was defined as the time taken for tumors to reach 100mm3 and was determined as described in the Materials and Methods. Data are illustrated as a Kaplan-Meier plot. Data were collected from three independent experiments. D. As in (C), except D4MUV2-EV (n=13) and D4MUV2-TGM2 (n=11) cells were used. E. YUMMER1.7-EV (n=6) or YUMMER1.7-TGM2 (n=6) cells were injected into the flanks of NSG mice, and tumors were measured by caliper every 3 days. Tumor onset was defined as the time taken for tumors to reach 100mm3 and was determined as described in the Materials and Methods. Data are illustrated as a Kaplan-Meier plot. F. As in (E), except D4MUV2-EV (n=5) and D4MUV2-TGM2 (n=5) cells were used. Exact p-values are shown for significant comparisons in in vivo experiments, ns=non-significant.
Figure 7:
Figure 7:. TGM2 overexpression leads to fewer intratumoral CD4+ T cells
A. YUMMER1.7-EV (n=9) and TGM2-overexpressing (n=7) tumors were collected 14 days after injection and analyzed by flow cytometry. Samples were gated for single cells, live cells, and CD45.2-positive immune cells, and analyzed for T cells (CD3+, NK1.1-). B. As in (A), except samples were analyzed for CD8+ T cells and CD4+ T cells. C. As in (A), except samples were analyzed for phenotypic markers (FoxP3+, CD44+, Ki67+, PD-1+) on CD4+ T cells. D. YUMMER1.7-EV (n=5) or YUMMER1.7-TGM2 (n=5) cells were injected into the flanks of mice treated with anti-CD4 antibody, and tumors were measured by caliper every 2–3 days. Tumor onset was defined as the time taken for tumors to reach 100mm3 and was determined as described in the Materials and Methods. Data are illustrated as a Kaplan-Meier plot. E. Scatter plots showing the fraction of TGM2+/SOX10− malignant cells versus all T cells, CD8+ T cells, or CD4+ T cells relative to all cells in the tumor for each scRNA-seq sample from Jerby-Arnon et al. (31). Each data point represents an individual melanoma patient sample (only includes tumors that have at least 50 malignant cells), and Spearman’s and Pearson’s correlations with corresponding p-values are shown. F. Partial correlation analysis results for TGM2 expression and GSVA signature scores for different T cell gene signatures using TCGA SKCM V2 RSEM bulk RNA-seq data from metastatic tumor samples while controlling for ESTIMATE tumor purity. Graphs show mean + SD. *p<0.05. ns=non-significant.

References

    1. Caksa S, Baqai U, Aplin AE, The future of targeted kinase inhibitors in melanoma. Pharmacol Ther. 239, 108200 (2022). - PMC - PubMed
    1. Patel RP, Somasundram PM, Smith LK, Sheppard KE, McArthur GA, The therapeutic potential of targeting minimal residual disease in melanoma. Clin Transl Med. 13, e1197 (2023). - PMC - PubMed
    1. Rambow F, Rogiers A, Marin-Bejar O, Aibar S, Femel J, Dewaele M et al. , Toward Minimal Residual Disease-Directed Therapy in Melanoma. Cell. 174, 843–855.e819 (2018). - PubMed
    1. Shaffer SM, Dunagin MC, Torborg SR, Torre EA, Emert B, Krepler C et al. , Rare cell variability and drug-induced reprogramming as a mode of cancer drug resistance. Nature. 546, 431–435 (2017). - PMC - PubMed
    1. Wouters J, Kalender-Atak Z, Minnoye L, Spanier KI, De Waegeneer M, Bravo González-Blas C et al. , Robust gene expression programs underlie recurrent cell states and phenotype switching in melanoma. Nat Cell Biol. 22, 986–998 (2020). - PubMed

MeSH terms