. 2025 Jul;292(2051):20251013.
doi: 10.1098/rspb.2025.1013. Epub 2025 Jul 30.

The influence of human presence and footprint on animal space use in US national parks

Kaitlyn M Gaynor  1 Forest P Hayes  2 Kezia Manlove  3 Nathan Galloway  4 John F Benson  5 Michael J Cherry  6 Clinton W Epps  7 Robert J Fletcher Jr  8 John Orrock  9 Justine A Smith  10 Christina Aiello  7 Jerrold L Belant  11 Joel Berger  2   12 Mark Biel  13 Jill Bright  14 Joseph Bump  15 Michael Burchett  16 Carson Butler  17 Jennifer Carlson  18 Eric K Cole  19 Neal Darby  16 Erin Degutis  20 Sarah Dewey  17 Pete Figura  21 Thomas D Gable  15 Jeff Gagnon  22 Danielle M Glass  23 Jennifer R Green  24 Kerry Gunther  25 Mark A Haroldson  26 Kent R Hersey  27 Brandon P Holton  28 Austin T Homkes  29 Sarah R Hoy  30 Debra Hughson  16 Kyle Joly  31 Ryan Leahy  32 Caitlin Lee-Roney  20 Rob Lester  20 Dan MacNulty  3 Michael Magnuson  33 Daniel Martin  34   35 Rachel Mazur  36 Seth Moore  37 Elizabeth K Orning  38 Katie Patrick  20 Rolf O Peterson  30 Lynette Potvin  39 Paige R Prentice  21 Seth P D Riley  40 Mark C Romanski  39 Annette Roug  27   41 Jeff A Sikich  40 Nova Simpson  42 William Sloan  43   44 Douglas W Smith  45 Mathew Sorum  31 Scott Sprague  22 Daniel Stahler  45 John Stephenson  17 Thomas R Stephenson  46 Janice Stroud-Settles  47 Frank T van Manen  48 John A Vucetich  30 Kate Wilmot  17 Steve Windels  49 Tiffany M Wolf  50 Paul C Cross  48
Affiliations

The influence of human presence and footprint on animal space use in US national parks

Kaitlyn M Gaynor et al. Proc Biol Sci. 2025 Jul.

Abstract

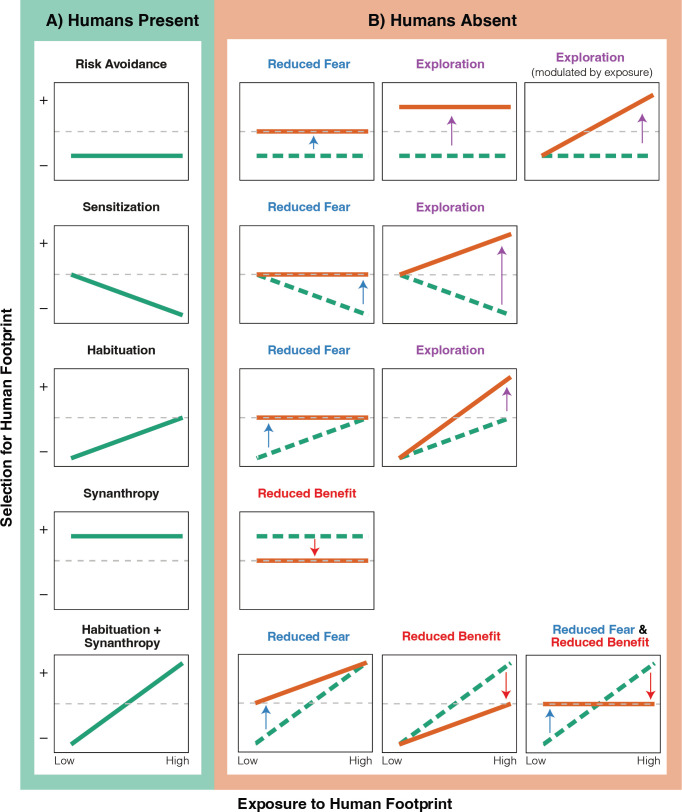
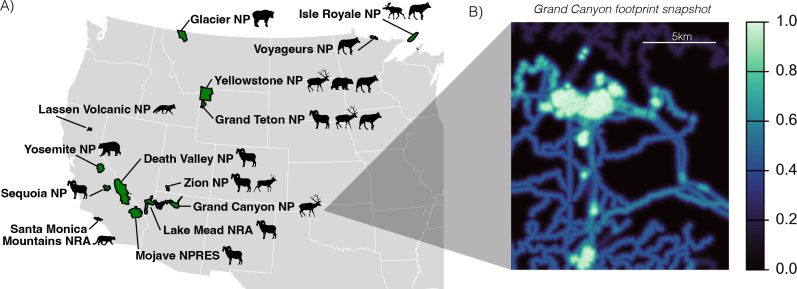
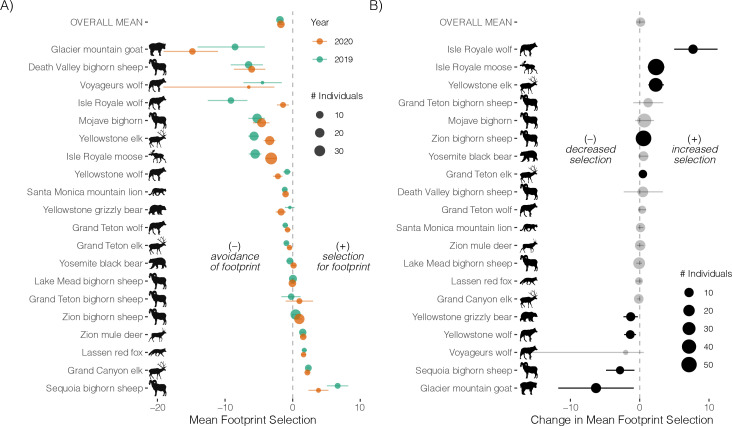
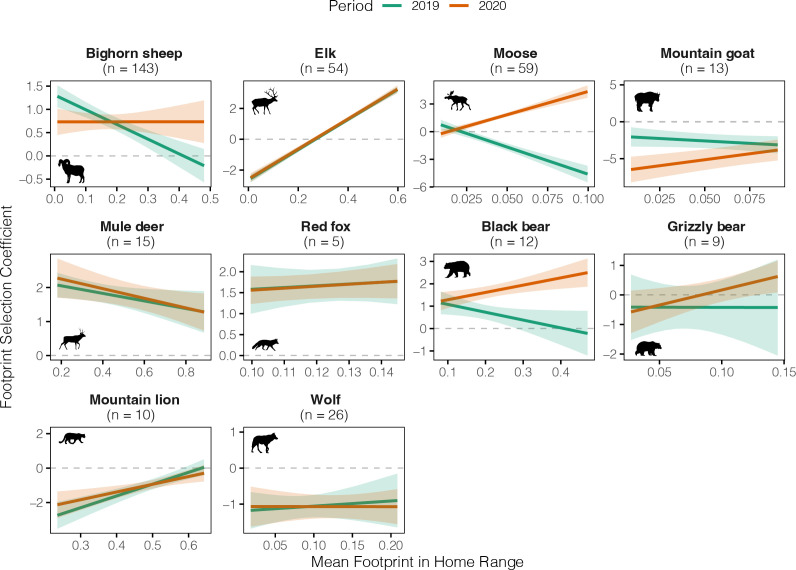
Given the importance of protected areas for biodiversity, the growth of visitation to many areas has raised concerns about the effects of humans on wildlife. In 2020, the COVID-19 pandemic led to temporary closure of national parks in the United States, offering a pseudonatural experiment to tease apart the effects of permanent infrastructure and transient human presence on animals. We compiled GPS tracking data from 229 individuals of 10 mammal species in 14 parks and used third-order hierarchical resource selection functions to evaluate the influence of the human footprint on animal space use in 2019 and 2020. Averaged across all parks and species, animals avoided the human footprint, whether the park was open or closed. However, although animals in remote areas showed consistent avoidance, on average those in more developed areas switched from avoidance to selection when protected areas were closed. Findings varied across species: some responded consistently negatively to the footprint (wolves, mountain goats), some positively (mule deer, red fox) and others had a strong exposure-mediated response (elk, mountain lion). Furthermore, some species responded more strongly to the park closure (black bear, moose). This study advances our understanding of complex interactions between recreation and wildlife in protected areas.

Keywords: Resource Selection Function; animal movement; functional response; human footprint; human-wildlife interactions; protected areas; recreation.


Conflict of interest statement

We declare we have no competing interests.

Figures

Predicted individual variation in responses of animals to human footprint and human presence (functional response hypotheses).
Figure 1.
Predicted individual variation in responses of animals to human footprint and human presence (functional response hypotheses). For all plots, the x-axis represents an individual animal’s exposure to the human footprint (i.e. infrastructure or built environment in its home range), where a low value corresponds to an animal with little footprint in its home range (i.e. more remote areas) and a high value corresponds to an animal with high footprint in its home range (i.e. more developed areas). A negative value on the y-axis represents avoidance of the human footprint, and a positive value represents preferential use of areas with greater human footprint. (A) Predicted baseline responses of animals to the human footprint, during periods of typical human presence. Some animal populations may consistently avoid the footprint (Risk Avoidance), and others may select for it (Synanthropy). Animals with home ranges in more developed areas may avoid it less (Habituation) or more (Sensitization) than those in more remote areas. A combination of habituation and synanthropy may result in avoidance by animals in remote areas, and selection by animals in developed areas (Habituation+Synanthropy). (B) A subset of predicted effects of human absence (i.e. during protected area closure) on animal selection for human footprint. The removal of humans from the human footprint may reduce fear for animals that typically avoid it (Reduced Fear; blue text), or may reduce benefit for animals that prefer it (Reduced Benefit; red text), resulting in more neutral selection for the footprint. Animals may also explore areas with high human footprint in the absence of humans to take advantage of otherwise unutilized habitat, leading to a shift from negative or neutral selection for the footprint to positive selection (Exploration; purple text). Changes in selection may vary depending on the level of development in an animal’s home range.
(A) Locations of all National Park Service sites included in our study. (B) An example of the human footprint index that we generated to quantify the built environment in the study areas.
Figure 2.
(A) Locations of all National Park Service sites (NP = park, NRA = National Recreation Area, NPRES = National Preserve) included in our study of animal movement in response to the human footprint and park closure. Animal vector silhouettes represent the study species in each park. (B) An example of the human footprint index that we generated to quantify the built environment in the study areas, mapped for the Grand Canyon National Park study area, where a value of 1.0 indicates the highest levels of human footprint. Base map in (A) was created with R package ‘maps’ [46].
Change in footprint selection for all individual animals that were tracked in both 2019 and 2020, across all species and parks.
Figure 3.
Change in footprint selection for all individual animals that were tracked in both 2019 and 2020, across all species and parks. Estimated relationship between the mean human footprint in an individual animal’s 2019 home range, and the difference in its footprint beta selection coefficient from 2019 to 2020. A positive value represents stronger selection (or weaker avoidance) of the human footprint when the park was closed to visitors, and a negative value represents weaker selection (or stronger avoidance). This model was based on resource selection function results for n = 117 individuals tracked in both years.
Population-level responses to the human footprint across US national parks (2019−2020), and responses to park closures during the 2020 pandemic.
Figure 4.
Population-level responses to the human footprint across US national parks (2019−2020) and responses to park closures during the 2020 pandemic. (A) Points represent the population mean selection coefficient for the human footprint in 2019 (green) and 2020 (orange). Negative values indicate that, on average, the individuals in the population avoided the human footprint, and positive values indicate that they selected for it. (B) Points represent the difference in the population mean selection coefficient for the human footprint from 2019 to 2020. Positive or negative values respectively indicate that, on average, the individuals in the population increased or decreased selection for the human footprint when parks were closed in 2020. Estimates in black have 95% CIs that do not overlap 0, indicating a meaningful difference in selection from 2019 to 2020. Error bars correspond to 95% credible intervals. The size of the points scales with the number of individuals in each period. Species icons from PhyloPic.org.
Selection of the human footprint by mammals in US national parks (2019−2020) varied with exposure and park closure.
Figure 5.
Selection of the human footprint by mammals in US national parks (2019−2020) varied with exposure and park closure. Graphs represent the predicted relationship between the mean human footprint in an individual animal’s home range and its avoidance/selection of the human footprint (as represented by individual beta coefficients in the resource selection function). This functional response varied between 2019, when the parks experienced typical patterns of visitation, and 2020, when the parks were closed to people. In these models, a single slope was estimated for each year, and the intercepts varied by population and year (average values are plotted below). The left panel displays the predictions of the global model (all species combined), and the centre and right panels display the predictions for the guild model (separate functional responses for large carnivores and ungulates).
Species-specific functional responses to human footprint in US national parks (2019−2020).
Figure 6.
Species-specific functional responses to human footprint in US national parks (2019−2020). Predicted relationship between the mean human footprint in an individual animal’s home range and its avoidance/selection of the human footprint, estimated separately for each species and year. Sample sizes indicate the number of individual-years per species. A slope of zero indicates that animals exhibit a consistent response to the human footprint, regardless of how much of it is in their home range. A negative slope indicates sensitivity to human disturbance, as animals with more footprint in their home range increasingly avoid footprint (or select for it less). A positive slope indicates habituation to human disturbance, as animals with more footprint in their home range avoid footprint less (or select for it more). In 2020, a positive slope may also indicate that animals selected more for the human footprint given the absence of humans in these areas. Note that both the x- and y-axis scales change across plots; the x-axis scales reflect the range of mean footprint values observed for each species. Species icons from PhyloPic.org.

Similar articles

References

    1. Venter O, et al. 2016. Sixteen years of change in the global terrestrial human footprint and implications for biodiversity conservation. Nat. Commun. 7, 12558. ( 10.1038/ncomms12558) - DOI - PMC - PubMed
    1. Gray CL, et al. 2016. Local biodiversity is higher inside than outside terrestrial protected areas worldwide. Nat. Commun. 7, 12306. ( 10.1038/ncomms12306) - DOI - PMC - PubMed
    1. Langhammer PF, et al. 2024. The positive impact of conservation action. Science 384, 453–458. ( 10.1126/science.adj6598) - DOI - PubMed
    1. Pacifici M, Marco MD, Watson JEM. 2020. Protected areas are now the last strongholds for many imperiled mammal species. Conserv. Lett. 13, e12748. ( 10.1111/conl.12748) - DOI
    1. Watson JEM, Dudley N, Segan DB, Hockings M. 2014. The performance and potential of protected areas. Nature 515, 67–73. ( 10.1038/nature13947) - DOI - PubMed

LinkOut - more resources