

Accuracy assessment of digital impressions with varied scanning paths in partially edentulous ridges with mobile abutment teeth: An in vitro comparative study
- PMID: 40743048
- PMCID: PMC12312966
- DOI: 10.1371/journal.pone.0327380
Accuracy assessment of digital impressions with varied scanning paths in partially edentulous ridges with mobile abutment teeth: An in vitro comparative study
Abstract
Background: Periodontal prosthesis or removable partial dentures are essential treatments for partially edentulous dentition with periodontal issues. This study aimed to assess the accuracy of digital impressions obtained through an intra-oral scanner, employing different scanning paths versus conventional impressions in partially edentulous ridges with mobile abutment teeth.
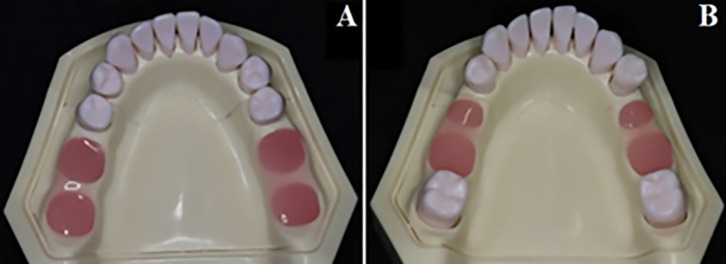
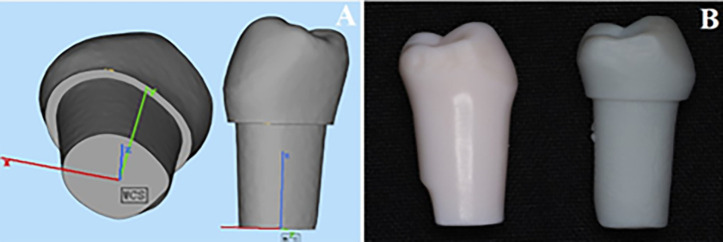
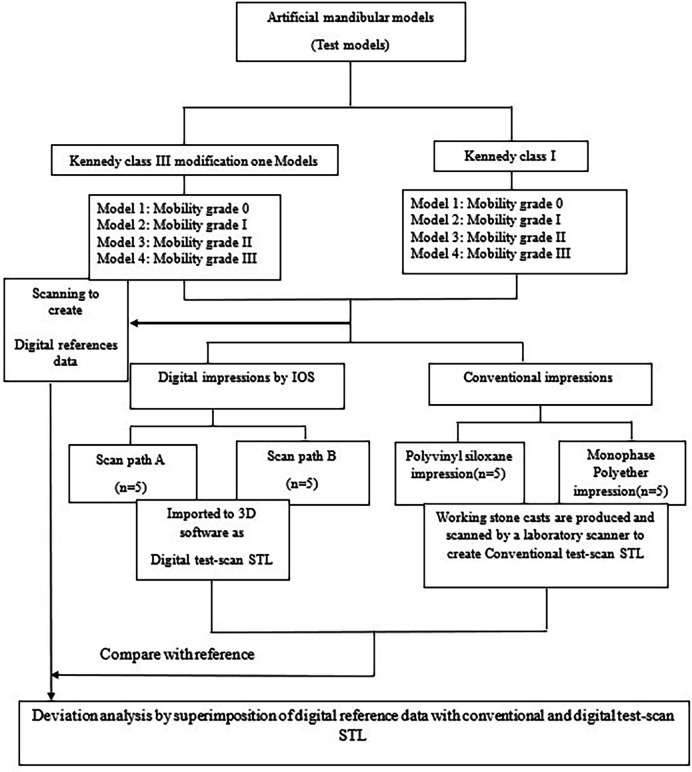
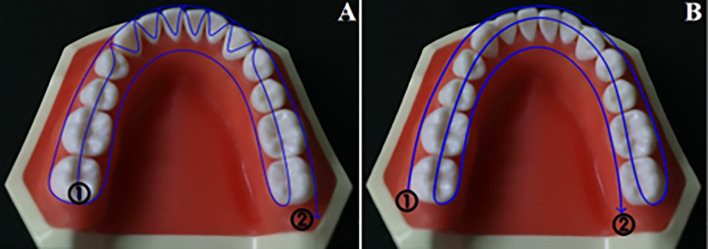
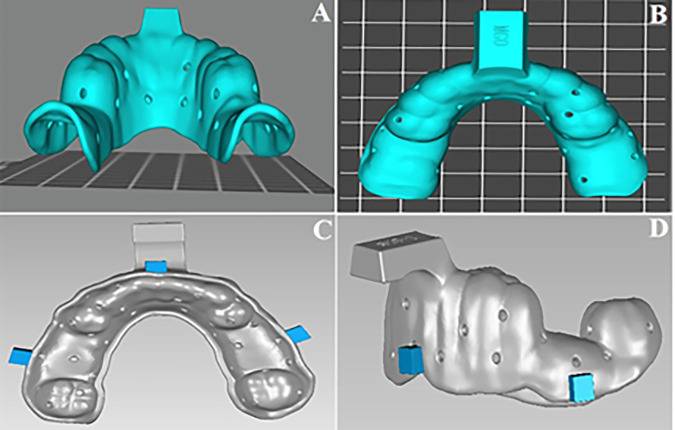
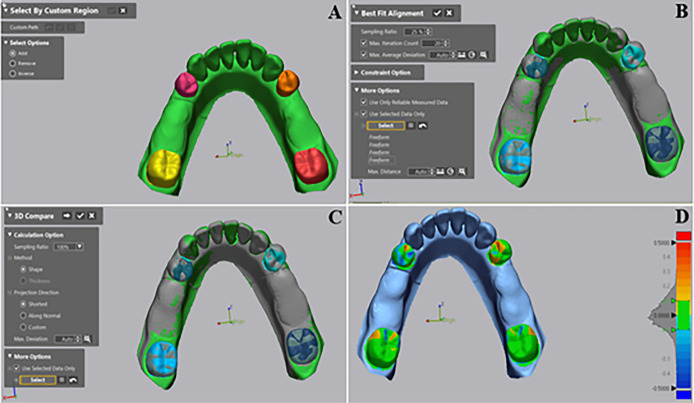
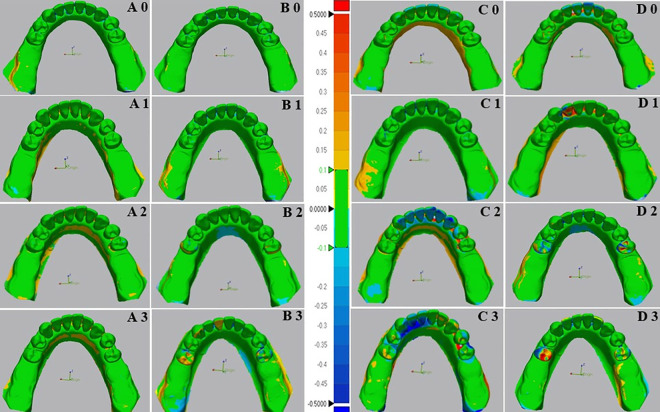
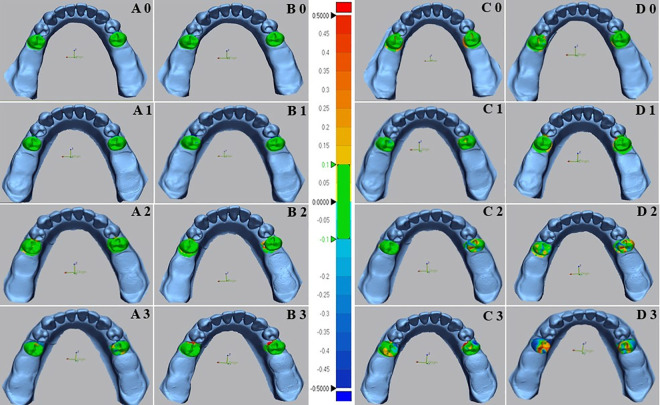
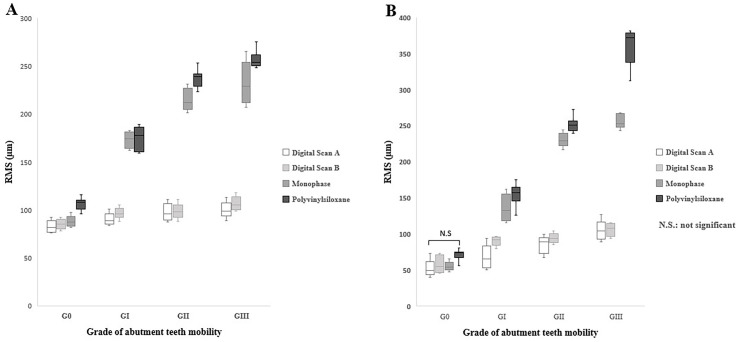
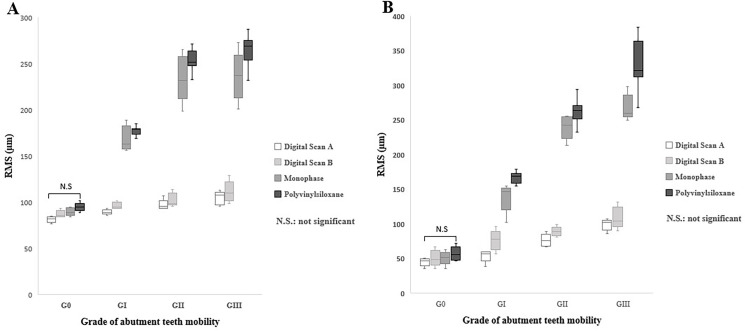
Methods: Eight lower Kennedy class I and class III models were employed as test models. The abutment teeth in these models were subjected to various mobility grades, according to the Miller classification. Reference data was generated by scanning the test models using an extra-oral laboratory scanner. An intra-oral scanner (TRIOS 4; V21; 3Shape A/S) was used to obtain ten digital impressions following two different scanning paths (Scan path A and Scan path B). For conventional impressions, two impression materials (Monophase polyether and Polyvinyl siloxane) were used to create ten impressions with a one-step technique. Working stone casts were produced and converted to digital data. Accuracy was assessed by analyzing the deviation between test data (digital and conventional data) and the reference data using 3D software (Geomagic Control X). The data was analysis using sequential tests, including two-way and one-way ANOVA, and paired t-tests (p < 0.05).
Results: Digital impressions obtained through an intra-oral scanner exhibited significantly higher accuracy. Within the digital impression category, those recommended by the manufacturer obtained using scan path A showed lower deviations than those acquired through scan path B. Considering the degree of tooth mobility, models with GII and GIII mobile RPD abutment teeth displayed significantly higher deviations (p < 0.001) than those with G0, GI across all impression techniques. The accuracy of conventional impressions with GII and GIII mobility was clinically unacceptable (deviation >200µm).
Conclusion: For partially edentulous cases with mobile abutment teeth, digital impressions exhibited superior accuracy for G0, GI. Following the manufacturer-recommended scanning protocol in scan path A can improve the accuracy of impressions. Furthermore, if there is persistent mobility, particularly in GII and GIII, the use of final conventional impressions is forbidden.
Copyright: © 2025 Alaghbari et al. This is an open access article distributed under the terms of the Creative Commons Attribution License, which permits unrestricted use, distribution, and reproduction in any medium, provided the original author and source are credited.
Conflict of interest statement
There is no conflict of interest for submission of this manuscript, which is approved by all authors for publication.
Figures

Similar articles
-
Final-impression techniques and materials for making complete and removable partial dentures.Cochrane Database Syst Rev. 2018 Apr 4;4(4):CD012256. doi: 10.1002/14651858.CD012256.pub2. Cochrane Database Syst Rev. 2018. PMID: 29617037 Free PMC article.
-
A comparative evaluation of photogrammetry software programs and conventional impression techniques for the fabrication of nasal maxillofacial prostheses.J Prosthet Dent. 2025 Jul;134(1):268-274. doi: 10.1016/j.prosdent.2023.08.027. Epub 2023 Sep 23. J Prosthet Dent. 2025. PMID: 37748996
-
Accuracy of digital versus conventional implant impressions in partially dentate patients: A systematic review and meta-analysis.J Dent. 2025 Sep;160:105918. doi: 10.1016/j.jdent.2025.105918. Epub 2025 Jun 17. J Dent. 2025. PMID: 40553823 Review.
-
Accuracy of impression scan bodies for complete arch fixed implant-supported restorations.J Prosthet Dent. 2025 Aug;134(2):425-432. doi: 10.1016/j.prosdent.2023.11.015. Epub 2023 Dec 12. J Prosthet Dent. 2025. PMID: 38092618
-
Effect of Implant Analog Design and Additively Manufactured Casts' Printing Layer Thickness on the Linear and Angular Accuracy of Analogs for Direct Digital Workflow: An In Vitro Study.Int J Oral Maxillofac Implants. 2025 Jul 25;40(4):449-458. doi: 10.11607/jomi.11127. Int J Oral Maxillofac Implants. 2025. PMID: 39365909
References
Publication types
MeSH terms
Substances
LinkOut - more resources
Full Text Sources
