

Effectiveness of Radiomics-Based Machine Learning Models in Differentiating Pancreatitis and Pancreatic Ductal Adenocarcinoma: Systematic Review and Meta-Analysis
- PMID: 40744488
- PMCID: PMC12313348
- DOI: 10.2196/72420
Effectiveness of Radiomics-Based Machine Learning Models in Differentiating Pancreatitis and Pancreatic Ductal Adenocarcinoma: Systematic Review and Meta-Analysis
Abstract
Background: Pancreatic ductal adenocarcinoma (PDAC) and mass-forming pancreatitis (MFP) share similar clinical, laboratory, and imaging features, making accurate diagnosis challenging. Nevertheless, PDAC is highly malignant with a poor prognosis, whereas MFP is an inflammatory condition typically responding well to medical or interventional therapies. Some investigators have explored radiomics-based machine learning (ML) models for distinguishing PDAC from MFP. However, systematic evidence supporting the feasibility of these models is insufficient, presenting a notable challenge for clinical application.
Objective: This study intended to review the diagnostic performance of radiomics-based ML models in differentiating PDAC from MFP, summarize the methodological quality of the included studies, and provide evidence-based guidance for optimizing radiomics-based ML models and advancing their clinical use.
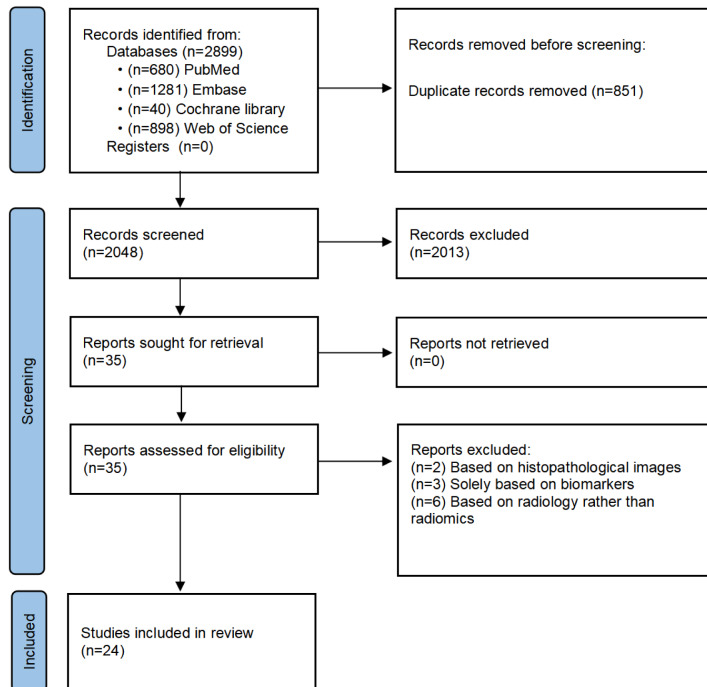
Methods: PubMed, Embase, Cochrane, and Web of Science were searched for relevant studies up to June 29, 2024. Eligible studies comprised English cohort, case-control, or cross-sectional designs that applied fully developed radiomics-based ML models-including traditional and deep radiomics-to differentiate PDAC from MFP, while also reporting their diagnostic performance. Studies without full text, limited to image segmentation, or insufficient outcome metrics were excluded. Methodological quality was appraised by means of the radiomics quality score. Since the limited applicability of QUADAS-2 in radiomics-based ML studies, the risk of bias was not formally assessed. Pooled sensitivity, specificity, area under the curve of summary receiver operating characteristics (SROC), likelihood ratios, and diagnostic odds ratio were estimated through a bivariate mixed-effects model. Results were presented with forest plots, SROC curves, and Fagan's nomogram. Subgroup analysis was performed to appraise the diagnostic performance of radiomics-based ML models across various imaging modalities, including computed tomography (CT), magnetic resonance imaging, positron emission tomography-CT, and endoscopic ultrasound.
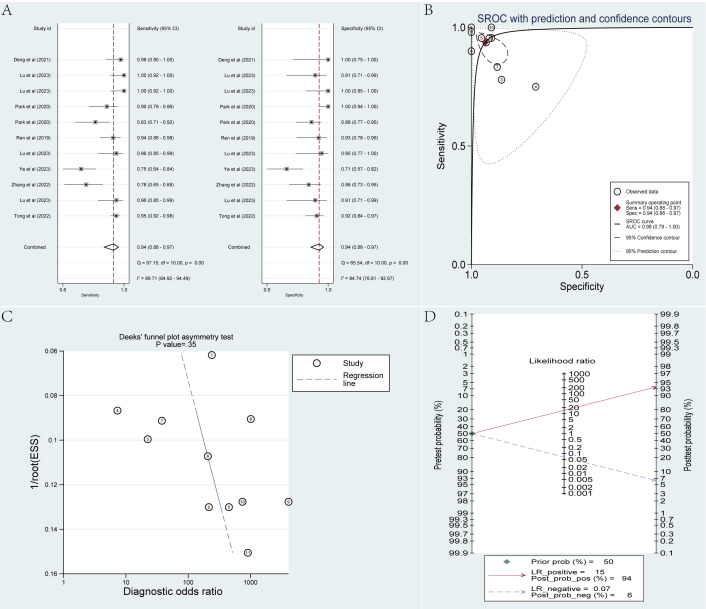
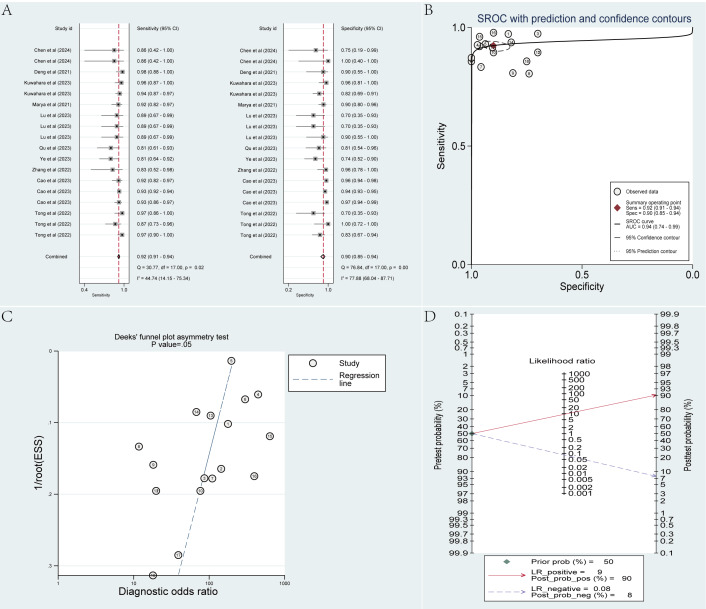
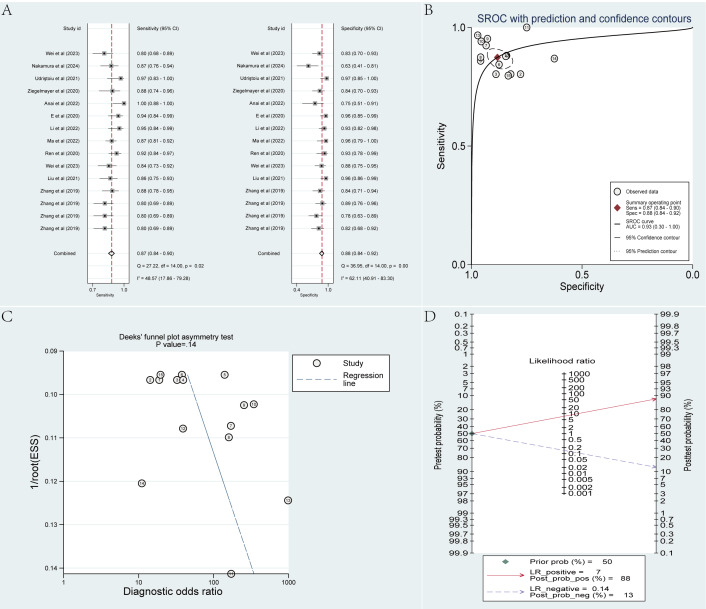
Results: This meta-analysis included 24 studies with 14,406 cases, including 7635 PDAC cases. All studies adopted a case-control design, with 5 conducted across multiple centers. Most studies used CT as the primary imaging modality. The radiomics quality score scores ranged from 5 points (14%) to 17 points (47%), with an average score of 9 (25%). The radiomics-based ML models demonstrated high diagnostic performance. Based on the independent validation sets, the pooled sensitivity, specificity, area under the curve of SROC, positive likelihood ratio, negative likelihood ratio, and diagnostic odds ratio were 0.92 (95% CI 0.91-0.94), 0.90 (95% CI 0.85-0.94), 0.94 (95% CI 0.74-0.99), 9.3 (95% CI 6.0-14.2), 0.08 (95% CI 0.07-0.11), and 110 (95% CI 62-194), respectively.
Conclusions: Radiomics-based ML models demonstrate high diagnostic accuracy in differentiating PDAC from MFP, underscoring their potential as noninvasive tools for clinical decision-making. Nonetheless, the overall methodological quality was moderate due to limitations in external validation, standardized protocols, and reproducibility. These findings support the promise of radiomics in clinical diagnostics while highlighting the need for more rigorous, multicenter research to enhance model generalizability and clinical applicability.
Keywords: artificial intelligence; differential diagnosis; imaging modalities; meta-analysis; systematic review.
© Lechang Zhang, Dewei Li, Tong Su, Tong Xiao, Shulei Zhao. Originally published in the Journal of Medical Internet Research (https://www.jmir.org).
Conflict of interest statement
Figures
References
-
- Gonda TA, Everett JN, Wallace M, Simeone DM, PRECEDE Consortium Recommendations for a more organized and effective approach to the early detection of pancreatic cancer from the PRECEDE (Pancreatic Cancer Early Detection) consortium. Gastroenterology. 2021 Dec;161(6):1751–1757. doi: 10.1053/j.gastro.2021.08.036. doi. Medline. - DOI - PubMed
Publication types
MeSH terms
LinkOut - more resources
Full Text Sources
Medical
