Comparative Study
. 2025 Jul 19;53(14):gkaf738.
doi: 10.1093/nar/gkaf738.

A side-by-side comparison of variant function measurements using deep mutational scanning and base editing

Affiliations
Comparative Study

A side-by-side comparison of variant function measurements using deep mutational scanning and base editing

Ivan Sokirniy et al. Nucleic Acids Res. .

Abstract

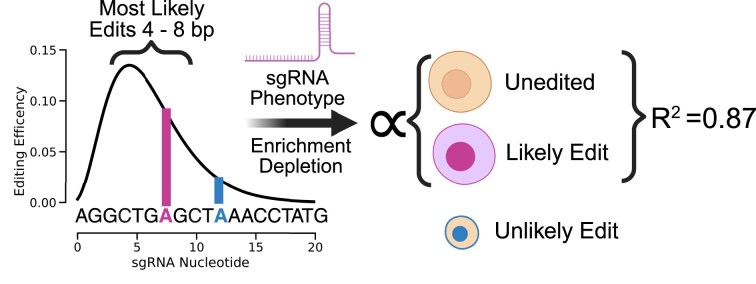
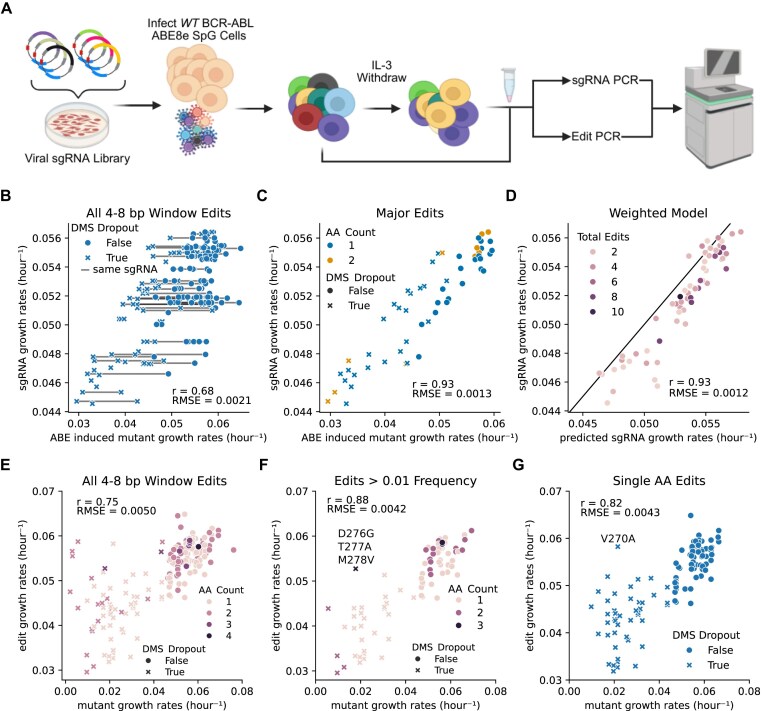
Variant annotation is a crucial objective in mammalian functional genomics. Deep mutational scanning (DMS) using saturation libraries of complementary DNAs (cDNAs) is a well-established method for annotating human gene variants, but CRISPR base editing (BE) is emerging as an alternative. However, questions remain about how well high-throughput BE measurements can annotate variant function and the extent of downstream experimental validation required. This study is the first direct comparison of cDNA DMS and BE in the same lab and cell line. We focus on how well short guide RNA (sgRNA) depletion or enrichment is explained by the predicted edits within the editing "window" defined by the sgRNA. The most likely predicted edits enhance the agreement between a "gold standard" DMS dataset and a BE screen. A simple filter for sgRNAs making single edits in their window could sufficiently annotate a large proportion of variants directly from sgRNA sequencing of large pools. When multi-edit guides are unavoidable, directly measuring edits in medium-sized validation pools can recover high-quality variant annotation data. Our data show a surprisingly high degree of correlation between base editor data and gold standard DMS. We suggest that the main variable measured in base editor screens is the desired base edits.


Conflict of interest statement

J.R.P. is a co-founder of RedAce Bio. J.R.P. is a co-founder and consultant for Theseus Pharmaceuticals. J.R.P. received equity from Theseus Pharmaceuticals, MOMA therapeutics and RedAce Bio. J.R.P. has consulted/consults for MOMA therapeutics, Curie.Bio, Third Rock Ventures, Takeda Pharmaceuticals, Galapagos Pharmaceuticals, and Roche/Genentech. J.R.P. has received honoraria and travel expenses from Roche/Genentech, Third Rock Ventures, and Theseus Pharmaceuticals. H.I., M.T., and J.R. are co-founders of Atlas Biotech.

Figures

Graphical Abstract
Graphical Abstract
Figure 1.
Figure 1.
Functional landscape of ABL N-Lobe. (A) Schematic of DMS. After lentiviral integration of EGFP-P2A-BCR-ABL, Ba/F3s were sorted to enrich EGFP + infected cells. Cells were pelleted before and 6 days after IL-3 withdrawal. After targeted genomic DNA digest by Cas9, single molecules of DNA were labeled by UMI ligation. Then biotinylated oligo baits were used to enrich the mutagenized region. (B) The distribution of mutant growth rates in the ABL1 N-lobe is bimodal. Two skewed Gaussians are fit to determine the variation in deleterious (blue) and “WT-like” (orange) mutations. The dotted line represents a −2 Z-score threshold with respect to the “WT-like” distribution. (C) Heatmap of the growth rate of mutations at each position in ABL1 N-lobe. Black dot represents WT positions. Missing data are in white. Second to the last row of the heatmap provides surface exposure information because solvent exposed residues (red, “e”) tend to be more tolerant of mutations than buried residues (blue, “b”). The bottom row of the heatmap indicates the evolutionary conservation for each residue on a scale of 1 (low conservation) to 9 (high conservation). Tolerance/sensitivity to mutagenesis is projected onto two key structural features of the ABL1 N-lobe (PDB 6XR6): the (D) anti-parallel beta-sheet, and the (E) αC-Helix. If mean growth rate of alternative alleles at a residue is less than the −2 Z-score cutoff, then the residue is colored blue. In contrast, if the mean growth rate of alternative alleles is greater than the –2 Z-score cutoff, then it is colored in red. (N = 2).
Figure 2.
Figure 2.
Adenosine base editor screen of full length of BCR-ABL. (A) Schematic of adenosine base editor screen. Three days after infection with BCR-ABL sgRNA library, Ba/F3 EGFP-P2A-BCR-ABL ABE8e cells were selected with 1 mg/ml hygromycin for 6 days and pelleted. Guides were PCR-amplified and sequenced. (B) A sliding window analysis using a window size of 40 sgRNAs. In a window we quantified the proportion of BCR-ABL sgRNAs that drop out more extreme than a Z-score of −4 of the negative control sgRNA growth rate (N = 3). (C) Correlation of the same ABE BCR-ABL screens performed in K562s (N = 2) and Ba/F3 expressing BCR-ABL (N = 3). (D) Kernel density estimate of growth rate distributions of non-targeting control, and BCR-ABL sgRNA libraries. Dashed gray line represents a –2 Z-score of the targeting control. (E) Lollipop plot displays dropout of each sgRNA across the ABL1 kinase domain. Dashed gray line represents a –2 Z-score of the targeting control (N = 3).
Figure 3.
Figure 3.
Comparison of adenosine base editor sgRNA growth rate and their respective mutation growth rates from DMS. Each dot represents a mutation an sgRNA is predicted to make. Dashed lines represent –2 Z-score of the non-deleterious distribution, and negative control sgRNA for the DMS and ABE screens, respectively. These cutoffs are used to define if an sgRNA or mutation is deleterious. If an sgRNA and its mutation do not deplete in their respective screen, in other words, both are non-deleterious, then they are colored yellow. If they both are deleterious, or true positive, then they are colored orange. If an sgRNA depletes, but the predicted edit does not deplete, a false positive, then the dot is colored in the blue. If a sgRNA fails to deplete, and the predicted mutation(s) are deleterious, a false negative, then that point is colored in green. (A) Shows all possible edits between nucleotides 2 and 12. (B) Shows only the most likely edits, those between nucleotides 4 and 8. (C) Shows only sgRNA predicted to be efficient, and edits between nucleotides 4 and 8. (D) Shows sgRNAs that are predicted to make only a single edit between nucleotides 4 and 8. (E) The distribution of edits can be estimated by machine learning model called BE-HIVE. (F) Correlation between predicted sgRNA growth rate and observed sgRNA growth rate. The x-axis shows the predicted growth rate of each sgRNA based on a weighted sum of the probability edit(s), and the effect of that edit(s) from DMS data. The y-axis shows the measured growth rate of the efficiently editing sgRNAs from the ABE screen.
Figure 4.
Figure 4.
Medium-throughput pooled adenosine base editor screen. (A) Schematic of medium-scale validations screen of 71 sgRNAs targeting ABL1 kinase, where the edits and sgRNA are sequenced after IL-3 withdrawal. (B, C) Growth rates of sgRNA-induced edits. Each dot represents a specific edit and its measured growth rate, while each “X” or filled circle indicates whether the corresponding mutation was deleterious or nondeleterious in a prior DMS experiment. (B) Growth rates for all detected edits within the 4–8 nucleotide editing window of their respective sgRNAs. Gray lines connect edits generated by the same sgRNA. (C) Highlights the most prevalent edits, defined as those occurring at a frequency of over 50% of all edits within the sgRNA’s editing window. (D) Weighted model for sgRNA growth rate. The sgRNA growth rate was predicted by a weighted sum of the growth rates of all edits within its 4–8 bp editing window, with weights corresponding to the frequency of each edit. The black line indicates a perfect correlation between the predicted and experimentally measured sgRNA growth rates. (E–G) Comparison of growth rates from the pooled ABE screen and DMS data. These panels directly compare the growth rates of specific amino acid mutants measured in the pooled ABE screen and the prior DMS experiment. The amino acid (AA) count represents the number of amino acids simultaneously edited. (E) All edits detected within the 4–8 bp editing window. (F) Highlights high-confidence growth rate measurements by applying a stringent edit frequency cutoff of 0.01, and (G) focuses exclusively on single amino acid edits to enable a direct comparison between the ABE screen and DMS data (N = 3).

Update of

Similar articles

References

    1. Kinney JB, McCandlish DM Massively parallel assays and quantitative sequence-function relationships. Annu Rev Genom Hum Genet. 2019; 20:99–127. 10.1146/annurev-genom-083118-014845. - DOI - PubMed
    1. Elbashir SM, Harborth J, Lendeckel W et al. Duplexes of 21-nucleotide RNAs mediate RNA interference in cultured mammalian cells. Nature. 2001; 411:494–8. 10.1038/35078107. - DOI - PubMed
    1. Root DE, Hacohen N, Hahn WC et al. Genome-scale loss-of-function screening with a lentiviral RNAi library. Nat Methods. 2006; 3:715–9. 10.1038/nmeth924. - DOI - PubMed
    1. Fire A, Xu S, Montgomery MK et al. Potent and specific genetic interference by double-stranded RNA in Caenorhabditis elegans. Nature. 1998; 391:806–11. 10.1038/35888. - DOI - PubMed
    1. Ran FA, Hsu PD, Wright J et al. Genome engineering using the CRISPR-Cas9 system. Nat Protoc. 2013; 8:2281–308. 10.1038/nprot.2013.143. - DOI - PMC - PubMed

Publication types

Substances