. 2025 Jul 19;53(14):gkaf726.
doi: 10.1093/nar/gkaf726.

G-quadruplexes as potential traps for superenhancer marker BRD4: ligand-sensitive binding and co-separation in vitro

Affiliations

G-quadruplexes as potential traps for superenhancer marker BRD4: ligand-sensitive binding and co-separation in vitro

Iuliia I Pavlova et al. Nucleic Acids Res. .

Abstract

G-quadruplexes (G4s) are prevalent at promoters and superenhancers (SEs), exclude nucleosomes, and recruit transcription factors. This study sought to determine whether the nucleosome exclusion affects the recruitment of the SE marker BRD4, which typically binds to acetylated histones and facilitates SE-promoter contacts via the phase separation-dependent mechanism. Analyses of the available whole-genome data revealed that SEs with the highest G4 density were depleted of nucleosomes but not of BRD4. This led us to test the possibility of histone-independent BRD4 maintenance at G4-rich SEs. A typical SE G4 destabilized a nearby nucleosome in vitro and, unlike B-DNA, bound weakly to BRD4 bromodomains. Similar to an acetylated nucleosome, the G4 promoted phase separation in BRD4 solutions. This effect was not altered by the histone competitor JQ1. However, it was attenuated by two known G4 ligands, suggesting that they could disrupt SE-promoter communication in cells. Consistently, these ligands downregulated several genes regulated by G4-rich SE-contacting promoters more efficiently than they did SE-independent genes. Our findings underscore the significance of G4-rich SEs as transcriptional regulators and provide new insights into their organization.


Conflict of interest statement

The authors declare no conflict of interest.

Figures

Graphical Abstract
Graphical Abstract
Figure 1.
Figure 1.
Whole genome analysis of G4s in SEs: enrichment, representative motifs, and distribution relative to BRD4-binding sites. (A) G4 enrichment in SEs of various status (permutation tests). The SE-G4 overlap was calculated using G4 ChIP-seq/Cut&Tag data obtained with the BG4 antibody and cell line-specific SE coordinates obtained from SEdb 2.0. For each cell line, the SE-G4 overlap was compared to that of the control set of random sites of equal size and length. Results are shown as mean ± SD fold enrichment of G4s over control sites for repressed, poised, and active SEs. Active SEs are those present in SEdb 2.0 and confirmed by CAGE. Poised SEs are those present in SEdb 2.0 but lacking CAGE peaks. Repressed SEs are those absent in the cell line of interest but present in other cell lines, according to SEdb 2.0. *Significant difference between repressed and poised/active SEs (P < 0.05, Student’s test). (B) Motifs enriched in a combined set of G4 sites from K-562 and HEK-293 G4-rich SEs (top-scoring MEME results). (C) Comparison of active G4-free and G4-rich SEs: normalized coverage of BRD4 ChIP-seq peaks. G4-free SEs are those lacking BG4 peaks (116 in K-562 and 36 in HEP-G2), and G4-rich ones are those showing top quartile BG4 coverage (100 in K-562 and 32 in HEP-G2). (D) Normalized DHS coverage in active G4-free and G4-rich SEs. In panels (C) and (D), the difference between G4-free and G4-rich SEs is statistically significant in all cases (P < 0.05, Mann–Whitney test). (E) Distribution of BG4, DHS, and H3K27ac peaks relative to BRD4 occupancy sites in active SEs.
Figure 2.
Figure 2.
Examples of G4-free and G4-rich SEs from the human β-globin locus. 3D contacts within the locus-containing TAD (Hi-C data) and the distribution of BG4/DHS/H3K27ac/BRD4 peaks (ChIP-seq and DNase-seq data) in its central region, encompassing fetal (HBG1 and HBG2) and embryonic (HBE1) globin genes with respective SEs, are shown for the K-562 cell line. Side panels are representative fragments of the G4-free (left) and G4-rich (right) SEs. The bottom plots illustrate sequence-based predictions of DNA affinity for HOs obtained using the nucleosome positioning prediction tool (NuPoP). The gray box in the right panel illustrates the presence of a G-rich motif within the BG4 peak colocalized with BRD4 and DHS peaks.
Figure 3.
Figure 3.
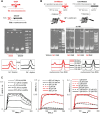
Effect of the SE G4 on nucleosome assembly and its interactions with BRD4 in vitro. (A) Schematic representation of the SE G4-containing duplex (dsG4) or the non-G4 control (dsCntr) and PAGE verification of their sensitivity to the G4 stabilizing ligand PDS. Annealing conditions: 1 μM dsG4/dsCntr and 0/10 μM PDS in 10 mM Tris–HCl buffer (pH 8.0), supplemented with 125 mM KCl and 20% PEG. PAGE conditions: 6% non-denaturing PAAG, 1× TBE with 10 mM KCl, and 10% PEG, SYBR Gold stain. The plots in the bottom illustrate the AUC-based analysis of the folded G4 fraction (experimental, gray; Gauss fitting). (B) Schematic representation of the Widom DNA fragments with the G4-tail (G4-Widom) or the non-G4 control (Cntr-Widom) and PAGE analysis of the assembly of H3K18ac-containing histone octamer (ac-HO) on these DNA. The plots in the bottom illustrate the AUC-based analysis of nucleosome fraction after 1–7-day incubation (experimental, gray; Gaussian fitting). (C) SPR-based analysis of BRD4 interactions with the acetylated peptide (ac-peptide) from H3K18ac (aa 10–28), G4, dsG4 and control ODNs (1–200 μM in the SPR running buffer). The sensograms are overlayed with monoexponential fitting.
Figure 4.
Figure 4.
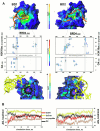
In silico analysis of BRD4 interactions with the acetylated histone tail and the SE G4. (A) Complexes of BRD4 BD1 (left) and BD2 (right) with the acetylated peptide (ac-peptide) from H3K18ac (top) and the SE G4 (bottom): MD simulation results (final snapshots) and contact maps. The complex models were obtained by docking ac-peptide or dsG4 to BD1/2, followed by MD simulations. Coloring scheme: brown, peptide backbone; black, G4; yellow, duplex flanks and the G4-opposing C-rich fragment. The contact maps were obtained based on the MD trajectories and illustrate the percentage of snapshots with contacts between the respective residues. Because the contact frequency between the C-rich DNA fragment and the duplex flanks was minor, the contact maps are shown for the G4 only, and the nucleotide residues are numbered accordingly (5′→3′). The amino acid numeration in ac-peptide and in BD1/2 agree with those in H3K18ac and full-size BRD4, respectively. (B) Free energies of BD1/2 binding with the ac-peptide, G4 without flanks, dsG4, and dsCntr. The energy plots were smoothed using the moving average method (span = 5).
Figure 5.
Figure 5.
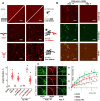
Effects of the G4 on phase separation in BRD4 solutions. (A) Fluorescent microscopy images of BRD4 mixtures with G4/control DNA, acetylated histones, or nucleosomes. BRD4 concentration: 4 μM (15% RED-labeled). Other components: 0/4 μM dsCntr (top, left); 4 μM dsG4 (middle, left); 4 μM G4 (bottom, left); 300 nM H3K18ac/150 nM Cntr-Widom (top, right); unstable nucleosome: 150 nM G4-Widom and 300 nM acetylated histone octamer (middle, right); stable nucleosome: 150 nM Cntr-Widom and 300 nM acetylated histone octamer (bottom, right). Buffer: 1× PBS (pH 7.4) supplemented with 20% PEG-400. Samples with G4-Widom/Cntr-Widom also contained 10 mM Tris–HCl (pH 8.0) and 125 mM NaCl from the NAB; scale bar: 50 μm. Violin plots summarize microscopy-based evaluation of droplet fraction in each sample. *Significant increase as compared to the blank sample (BRD4 only), P < 0.0001, one-way ANOVA with Dunnett’s post-hoc test. (B) Confocal microscopy images of BRD4 mixtures with dsG4 on mPEG-modified glass in the presence and absence of PDS. Conditions: 4 μM BRD4 (15% RED-labeled), 4 μM dsG4 (the G4-containing strand is FAM-labeled), and 0/20 μM PDS in 10 mM Tris–HCl buffer (pH 8.0) supplemented with 125 mM NaCl and 20% PEG-400; scale bar: 50 μm. (C) FRAP in BRD4-dsG4 gel-like structures: representative snapshots (bleached zones are marked by dashed lines) and kinetic curves (average of three measurements); scale bar: 10 μm.
Figure 6.
Figure 6.
Effects of the G4 ligands on the expression of genes contacting G4-rich SEs. (A) Selection of genes dependent on conserved (active in both cell lines; top pannel) or specific (active/poised in K-562; middle pannel) G4-rich SEs and control SE-independent genes (bottom pannel). For each gene set, 3D context, nearest SEs, BRD4 occupancy and G4-richness (G4-seq and BG4 narrow peaks) in K-562 cells are shown. SE-dependent genes are those that overlap SEs or participate in long-range interactions with same-TAD SEs, as indicated by the Hi-C data (above-average off-diagonal contact frequency). SE-independent genes are those found in the SE-free TAD/inter-TAD region. (B) Regulation of the selected genes by the G4 ligands PDS/SOP1812 or the control compound 5FU in K-562 (left) and HEK-293 (right). The volcano plots illustrate the stringent analysis (Log2FC threshold = 2, P-value threshold = 0.05). (C) Spearman correlation between gene regulation by PDS (Log2FC_PDS) and the selected SE/promoter (P) features, namely the highest G4-seq/BG4/BRD4 peak score in the promoter region and the G4-seq/BG4/BRD4 coverage in the related SE.

Similar articles

References

    1. Burge S, Parkinson GN, Hazel P et al. Quadruplex DNA: sequence, topology and structure. Nucleic Acids Res. 2006; 34:5402–15. 10.1093/nar/gkl655. - DOI - PMC - PubMed
    1. Maizels N, Gray LT The G4 genome. PLoS Genet. 2013; 9:e1003468. 10.1371/journal.pgen.1003468. - DOI - PMC - PubMed
    1. Huppert JL, Balasubramanian S Prevalence of quadruplexes in the human genome. Nucleic Acids Res. 2005; 33:2908–16. 10.1093/nar/gki609. - DOI - PMC - PubMed
    1. Kwok CK, Merrick CJ G-quadruplexes: prediction, characterization, and biological application. Trends Biotechnol. 2017; 35:997–1013. 10.1016/j.tibtech.2017.06.012. - DOI - PubMed
    1. Puig Lombardi E, Londoño-Vallejo A A guide to computational methods for G-quadruplex prediction. Nucleic Acids Res. 2020; 48:1–15. 10.1093/nar/gkz1097. - DOI - PMC - PubMed

MeSH terms

LinkOut - more resources