. 2025 Jul 31;16(1):7018.
doi: 10.1038/s41467-025-61820-z.

A diverse landscape of FGFR alterations and co-mutations suggests potential therapeutic strategies in pediatric low-grade gliomas

April A Apfelbaum #  1   2   3 Eric Morin #  1   2   3   4   5 Dominik Sturm  6   7   8   9 Georges Ayoub  10   11 Jeromy DiGiacomo  1   2 Sher Bahadur  1   2 Bhavyaa Chandarana  12   13 Phoebe C Power  1   3 Margaret M Cusick  1 Dana Novikov  1   2 Prem Prabhakar  10 Robert E Jones  10 Jayne Vogelzang  10 Connor C Bossi  10 Seth Malinowski  10 Lewis M Woodward  14 Tania A Jones  14 John Jeang  1   2 Sarah W Lamson  1   2 Jared Collins  1   2 Kelly Y Cai  1   2 Jacquelyn S Jones  10 Sehee Oh  15 Hyesung Jeon  15   16 Jinhua Wang  15   16 Amy Cameron  17 Patrick Rechter  17 Angela De Leon  1 Karthikeyan Murugesan  18 Meagan Montesion  18 Lee A Albacker  18 Shakti H Ramkissoon  19   20   21 Cornelis M van Tilburg  7   9   22   23 Emily C Hardin  7   9   22   23 Philipp Sievers  22   24   25 Felix Sahm  8   22   24   25 Kee Kiat Yeo  1   3 Tom Rosenberg  1   3 Susan N Chi  1   3 Karen D Wright  1   3 Steven Hébert  12 Sydney Peck  26 Alberto Picca  27 Valérie Larouche  28 Samuele Renzi  29 Sara J Buhrlage  15   16 Tejus A Bale  30 Amy A Smith  26 Mehdi Touat  27 Nada Jabado  13 Eric S Fischer  15   16 Michael J Eck  15   16 Lissa Baird  1   3   31 Olaf Witt  7   8   9   22   23 Claudia L Kleinman  12   13 Quang-De Nguyen  17 Denise Sheer  14 Sanda Alexandrescu  1   32 David T W Jones  6   7   8 Keith L Ligon  33   34   35   36 Pratiti Bandopadhayay  37   38   39
Affiliations

A diverse landscape of FGFR alterations and co-mutations suggests potential therapeutic strategies in pediatric low-grade gliomas

April A Apfelbaum et al. Nat Commun. .

Erratum in

  • Author Correction: A diverse landscape of FGFR alterations and co-mutations suggests potential therapeutic strategies in pediatric low-grade gliomas.
    Apfelbaum AA, Morin E, Sturm D, Ayoub G, DiGiacomo J, Bahadur S, Chandarana B, Power PC, Cusick MM, Novikov D, Prabhakar P, Jones RE, Vogelzang J, Bossi CC, Malinowski S, Woodward LM, Jones TA, Jeang J, Lamson SW, Collins J, Cai KY, Jones JS, Oh S, Jeon H, Wang J, Cameron A, Rechter P, De Leon A, Murugesan K, Montesion M, Albacker LA, Ramkissoon SH, van Tilburg CM, Hardin EC, Sievers P, Sahm F, Yeo KK, Rosenberg T, Chi SN, Wright KD, Hébert S, Peck S, Picca A, Larouche V, Renzi S, Buhrlage SJ, Bale TA, Smith AA, Touat M, Jabado N, Fischer ES, Eck MJ, Baird L, Witt O, Kleinman CL, Nguyen QD, Sheer D, Alexandrescu S, Jones DTW, Ligon KL, Bandopadhayay P. Apfelbaum AA, et al. Nat Commun. 2025 Oct 9;16(1):8970. doi: 10.1038/s41467-025-64919-5. Nat Commun. 2025. PMID: 41068145 Free PMC article. No abstract available.

Abstract

Oncogenic alterations in fibroblast growth factor receptor (FGFR)-family proteins occur across cancers, including pediatric gliomas. Our genomic analysis of 11,635 gliomas across ages finds that 5.3% of all gliomas harbor FGFR alterations, with an incidence of almost 9% in pediatric gliomas. Alterations in FGFR proteins are differentially enriched by age, tumor grade, and histology, with FGFR1 alterations associated with glioneuronal histologies. Leveraging isogenic systems, we confirm FGFR1 alterations to induce downstream Mitogen Activated Protein Kinase (MAPK) and mTOR signaling pathways, drive gliomagenesis, activate neuronal transcriptional programs and exhibit sensitivity to MAPK pathway and pan-FGFR inhibitors. Finally, we perform a retrospective analysis of clinical responses in children diagnosed with FGFR-altered gliomas and find that treatment with currently available inhibitors is largely associated with stability of disease. This study provides key insights into the biology of FGFR1-altered gliomas, therapeutic strategies to target them and associated challenges that still need to be overcome.


Conflict of interest statement

Competing interests: P.B. serves on paid advisory boards for DayOne Biopharmaceuticals and has served on a paid advisory board for QED Therapeutics. Her lab has received grant funding from Novartis Institute of Biomedical Research. SHR has employment at Labcorp Oncology. C.M.V.T. is on advisory boards for Alexion, Bayer, Novartis, and Roche and has received travel support from Eli Lilly. J.W. is a consultant and equity holder for Soltego. F.S. and D.T.W.J. are co-founders and shareholders of Heidelberg Epignostix GmbH. O.W. is advisory board member or has received research grants from Janssen, Day One Biopharmaceuticals, and Novartis. K.L.L. disclosures: Equity: Travera Inc.; Consulting- Travera Inc., B.M.S., Servier, L.E.K., Integragen, Blaze Bioscience; Research. Research Funding to DFCI: B.M.S. K.M., M.M., L.A.A. are employees of Foundation Medicine, Inc. and stockholders of Roche Holdings AG. E.S.F. is a founder, scientific advisory board (SAB) member, and equity holder of Civetta Therapeutics, Proximity Therapeutics, Neomorph, Inc. (also board of directors), Stelexis Biosciences, Inc., Anvia Therapeutics, Inc., and CPD4, Inc. (also board of directors). He is an equity holder and SAB member for Avilar Therapeutics, Photys Therapeutics, and Ajax Therapeutics, and an equity holder in Lighthorse Therapeutics. E.S.F. is a consultant to Novartis, EcoR1 capital, Odyssey, and Deerfield. The Fischer lab receives or has received research funding from Deerfield, Novartis, Ajax, Interline, Bayer, and Astellas. The Eck lab has received sponsored research support from Novartis, and MJE is a consultant for Syndax Pharmaceuticals. The remaining authors declare no competing interests.

Figures

Fig. 1
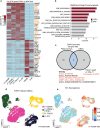
Fig. 1. Pediatric FGFR1-altered tumors are enriched in glioneuronal histologies.
a Heatmap showing hierarchical clustering of the methylation data (top 10,000 differentially methylated probes; ward D2; Euclidean distance) for the 425 patients in the KiTZ cohort. This heatmap shows beta-values as indicated by the color scale. Cluster 1 and 2, 2A and 2B are labeled on the heatmap. Metadata highlighted include if the tumor was FGFR-altered, which FGFR gene was altered or co-altered, which alteration type, the methylation family prediction, tumor grade, and if it was a glioneuronal tumor. b Co-mutation plot summarizing alterations in the FGFR genes and other recurrently mutated genes across 120 FGFR-altered pediatric tumors in the three cohorts (DFCI, KiTZ, FM). The co-mutation plot is ordered by FGFR alteration type, patient age, and grade. N/A- data not available. FM- Foundation Medicine. c Horizontal bar plots depicting the top 5 significant Gene Ontology C5 (MsigDB) terms enriched (ranked by significance) in FGFR1- (n = 16) or BRAF-altered (n = 130) gliomas. Negative log(FDR) values from the GSEA analysis are shown on the x-axis. Source data are provided in Supplementary Data S2 and S3 and the Source Data File.
Fig. 2
Fig. 2. Expression of FGFR1 is found in neuronal and glial lineage cell types in brain development.
a Expression of FGFR1 in bulk RNA-seq across lifespan in human forebrain (n = 55) (left) and hindbrain (n = 59) (right). X-axis denotes sample age, measured in natural log of weeks post conception, and x-axis tick values correspond to weeks in prenatal points and years in postnatal points. Vertical dashed line depicts birth. Y-axis depicts RPKM expression values. b, c UMAP representation of human embryo cells 4–5.5 weeks post conception. N = 7 embryos, 185k cells. b Left: Cells colored by neural progenitor cells annotated in the original study colored green. c Right: Cells colored by normalized expression of FGFR1. Color scale midpoint is set to the midpoint of maximum and minimum expression. d Detection rate (% of cells with expression >0) of FGFR1 expression in broad cell types of first trimester human brain. e Top 15 cell clusters by detection rate (% of cells with expression of >0) of Fgfr1 expression in developing mouse pons and forebrain. Cell clusters grouped by broad cell type.
Fig. 3
Fig. 3. Isogenic NSC models driven by FGFR1 alterations grow and signal independently of growth factor.
a Overview of the generation of the isogenic NSC lines. Mouse or hTERT-immortalized human NSCs were virally transduced with each of the FGFR or BRAF alterations, or control vectors, followed by a second transduction containing the co-occurring PTPN11 mutation or control vectors. Created in BioRender. Apfelbaum, A. (2024) https://BioRender.com/p48w741. b Bar plots depicting the percentage of cumulative doubling growth rate at day 14 for each mNSC cell line grown with no growth factor (no gf)/with growth factor (+gf). Values and error bars depict the mean ± SEM of three independent biological replicates. Significance calculated by a Welch’s two-sided t test compared to the vehicle control. *p < 0.05, **p < 0.01, ***p < 0.001. c Same as in b but for the ihNSC lines. Representative immunoblots (densitometry of three biological replicates in Supplementary Fig. S5j–o) of downstream MAPK and PI3K/mTOR signaling pathway effectors for d mNSC and e ihNSC models. Phosphorylated proteins represent activated signaling pathways. pERK is a readout for MAPK signaling, and pAKT and pS6 are readouts for PI3K/mTOR signaling. Vector Control and PTPN11 alone are grown in the presence of growth factor, while lines harboring FGFR1 and BRAF drivers are grown without growth factor supplementation. Abbreviations for models= F1-N546K: FGFR1 N546K SNV, F1-N546K + PTPN11: FGFR1 N546K SNV + PTPN11 E69K SNV, F1-ITD: FGFR1-ITD, F1::TACC1: FGFR1::TACC1, V600E: BRAF V600E SNV, K::B: KIAA1549::BRAF. Source data provided in the Source Data File.
Fig. 4
Fig. 4. FGFR1-altered lines are enriched in similar neuronal signatures observed in patient tumors.
a Heatmap of the top 25 genes differentially expressed (DE) in the FGFR1 vs BRAF-altered mNSC lines. Gene names highlighted in orange represent genes involved in neuronal development. b Horizontal bar plots depicting the top 5 significant Gene Ontology C5 (MsigDB) Terms enriched (ranked by significance) in FGFR1 (n = 4) or BRAF- (n = 2) altered mNSC lines. c Venn diagram depicting the overlap of the top 20 significantly enriched C5 gene sets in the FGFR1-altered patient tumors and FGFR1-altered mNSC lines (n = 5 gene sets intersected). Significance was calculated by performing a two-sided Fisher’s exact test (p = 2.6e-11). Red text in the overlap list highlights gene sets that were also enriched in the FGFR1 SV-altered ihNSC lines. d UMAP embedding of all FGFR1-altered mNSC lines, colored by line. N = 4 samples, 19,009 cells. e UMAP embeddings of the FGFR1-altered mNSCs colored by the GO Neurogenesis gene set. Legend depicts gene set score. N = 4 samples, 19,009 cells. Abbreviations for models= F1-N546K: FGFR1 N546K SNV, F1-N546K + PTPN11: FGFR1 N546K SNV + PTPN11 E69K SNV, F1-ITD: FGFR1-ITD, F1::TACC1: FGFR1::TACC1, V600E: BRAF V600E SNV, K::B: KIAA1549::BRAF. Source data provided in Supplementary Data S4 and the Source Data File.
Fig. 5
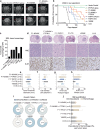
Fig. 5. Isogenic mNSC lines driven by FGFR1 alterations form tumors in mice.
a Representative axial MRI images of gliomas following intracranial injection of the isogenic mNSC lines expressing oncogenes shown. Red arrow points to gliomas in the right hemisphere of the brain. b Kaplan–Meier survival curves of mice harboring intracranial allografts of mNSCs transduced to express each alteration. Ten mice were injected with each cell line. Significance was calculated by performing a Log-rank (Mantel-Cox) test performed. ***p < 0.0001. c Bar graph showing the percentage of mice with tumor hemorrhage by MRI assessment. d Representative H&E images showing glioma formation at low magnification (1.5x, scale bar = 1 mm) and high magnification (40x, scale bar = 100 μm), with H&E slides and Ki-67 staining (one representative image of one tumor per condition per stain/magnification- quantified in eh). e–h For the box and whisker plots, the whiskers with error bars represent the minima and maxima values. The middle line represents the center value (50th percentile), and the bounds of the box represent the 25th to 75th percentiles of the data. AI-based digital quantification of e tumor maximal diameter, f cellularity, and g Ki-67 positivity in hotspot regions and h whole tumors using U-net on the Visiopharm platform. See Methods for detailed quantification schema. Tumor n: 4 (V600E, K::B), 5 (F1-N546K, F1-N546K + PTPN11, F1-ITD), or 6 (F1::TACC1). i Distribution of tumor border’s growth pattern (infiltrative, circumscribed, or mixed) for each group. Tumor n: F1-N546K = 5, F1-N546K + PTPN11 = 5, F1::TACC1 = 6, F1-ITD = 5, V600E = 4, K::B = 4). j AI-based digital quantification of vasculature and hemorrhage percentage per tumor area in each group using DenseNet on the HALO AI platform. Data presented as mean ± SEM. Tumor n: 4 (V600E, K::B), 5 (F1-N546K, F1-N546K + PTPN11, F1-ITD), or 6 (F1::TACC1). Abbreviations for models= F1 N546K: FGFR1 N546K SNV, F1-N546K + PTPN1: FGFR1 N546K SNV + PTPN11, F1-ITD: FGFR1-ITD, F1::TACC1: FGFR1::TACC1, V600E: BRAF V600E, K::B: KIAA1549::BRAF. Source data provided in the Source Data File.
Fig. 6
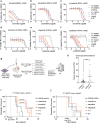
Fig. 6. FGFR1-driven models are sensitive to FGFR inhibition.
Dose response curves in the FGFR1 and BRAF-altered mNSC models for a trametinib (MEKi), b belvarafenib (RAFi), c tovorafenib (RAFi), d everolimus (mTORi), e infigratinib (FGFRi), f erdafitinib (FGFRi). Data presented as mean ± SEM of 3 biological replicates. g Model summarizing the in vivo drug study. 300,000 F1::TACC1-driven mNSC cells were injected into the right hemisphere of mice. After gliomas were detected, mice were treated with single or combination doses of infigratinib, everolimus, and trametinib. MRI was performed prior to drug treatment and weekly after start of drug treatment. Cohort 1 (n = 31) was treated after 24 or 25 days post cell injections, and Cohort 2 (n = 19) was treated after 30 or 31 days post cell injections. Created in BioRender. Apfelbaum, A. (2025) https://BioRender.com/p65k638. h Dot plot showing the volume of tumors in cohort 1 (n = 31) and cohort 2 (n = 19) prior to treatment. Volume assessed by MRI. Lines represent the median. Significance was calculated by performing a two-sided Mann Whitney test performed. ****p < 0.0001. i Kaplan–Meier survival curves for mice in Cohort 1 by each treatment group (treated after 24/25 days-dotted line). Significance was calculated by performing a Log-rank (Mantel-Cox) test (Vehicle vs. infigratinib: p = 0.025, Vehicle vs. TI: p = 0.038, Vehicle vs. EI: p = 0.025). j Kaplan–Meier survival curves for mice in Cohort 2 by each treatment group (treated after 30/31 days-dotted line). Abbreviations for models= F1-N546K: FGFR1 N546K SNV, F1-N546K + PTPN11: FGFR1 N546K SNV + PTPN11 E69K SNV, F1-ITD: FGFR1-ITD, F1::TACC1: FGFR1::TACC1, V600E: BRAF V600E SNV, K::B: KIAA1549::BRAF. Source data provided in the Supplementary Data S5 and the Source Data File.
Fig. 7
Fig. 7. Treatment of FGFR1-altered gliomas with chemotherapy or targeted inhibitors show similar response rates.
a Pie chart showing the number of patients with FGFR-altered gliomas within the DFCI cohort that did (n = 6) or did not require further treatment (n = 9) following surgical management and had gross (n = 9) or sub-total (n = 6) resections (n = 15 patients total). b Bar graph depicts the % of FGFR1-altered pediatric glioma patients treated with chemotherapy (n = 6) or targeted inhibitors with either FGFR- or MEK-inhibition, broken down by low-grade (pLGG) or high-grade (pHGG) histology (pLGG: MEKi n = 8, FGFRi n = 24; pHGG: FGFRi n = 11). Chemotherapy-treated patients were from the DFCI cohort, targeted inhibitor-treated patients were from the DFCI cohort, published literature, and multi-institutional case studies. SD stable disease, PR partial response, PD progressive disease, CR complete response. Source data provided in Supplementary Data S7.

References

    1. Ardizzone, A. et al. Role of fibroblast growth factors receptors (FGFRs) in brain tumors, focus on astrocytoma and glioblastoma. Cancers12, 3825 (2020). - PMC - PubMed
    1. Krook, M. A. et al. Fibroblast growth factor receptors in cancer: genetic alterations, diagnostics, therapeutic targets and mechanisms of resistance. Br. J. Cancer124, 880–892 (2021). - PMC - PubMed
    1. Murugesan, K. et al. Pan-tumor landscape of fibroblast growth factor receptor 1-4 genomic alterations. ESMO Open7, 100641 (2022). - PMC - PubMed
    1. Jones, D. T. et al. Recurrent somatic alterations of FGFR1 and NTRK2 in pilocytic astrocytoma. Nat. Genet.45, 927–932 (2013). - PMC - PubMed
    1. Ryall, S. et al. Integrated molecular and clinical analysis of 1000 pediatric low-grade gliomas. Cancer Cell37, 569–583.e565 (2020). - PMC - PubMed

MeSH terms

Substances