. 2025 Jul 31;16(1):579.
doi: 10.1038/s41419-025-07888-3.

PRMT1-mediated methylation of UBE2m promoting calcium oxalate crystal-induced kidney injury by inhibiting fatty acid metabolism

Affiliations

PRMT1-mediated methylation of UBE2m promoting calcium oxalate crystal-induced kidney injury by inhibiting fatty acid metabolism

Tianhui Yuan et al. Cell Death Dis. .

Abstract

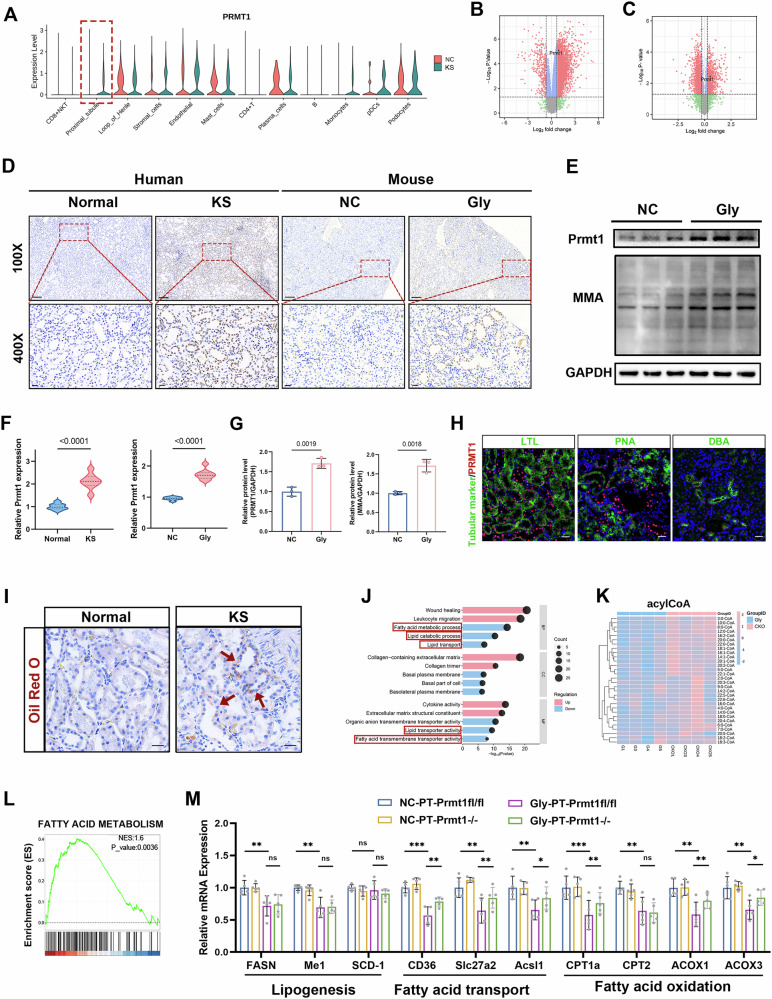
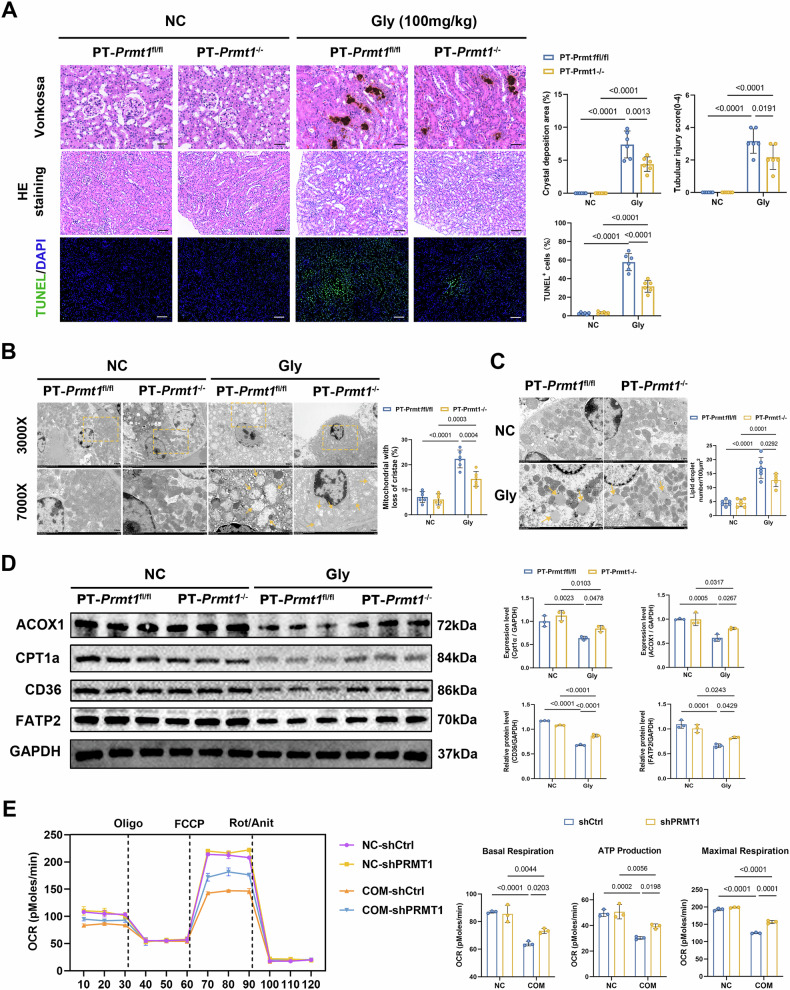
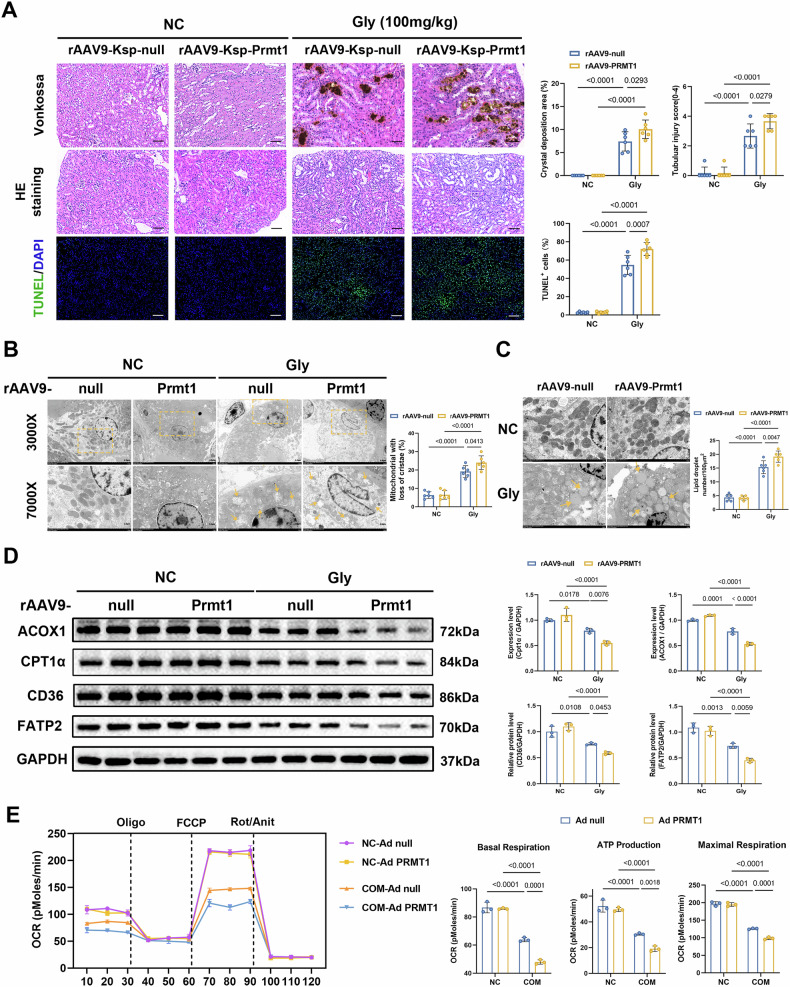
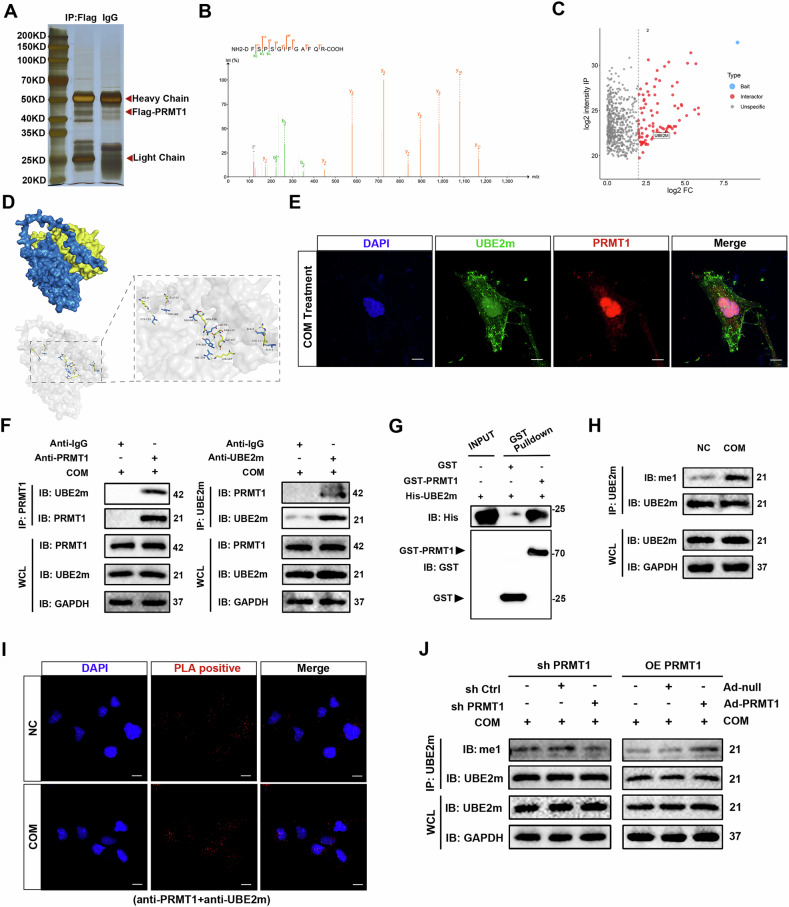
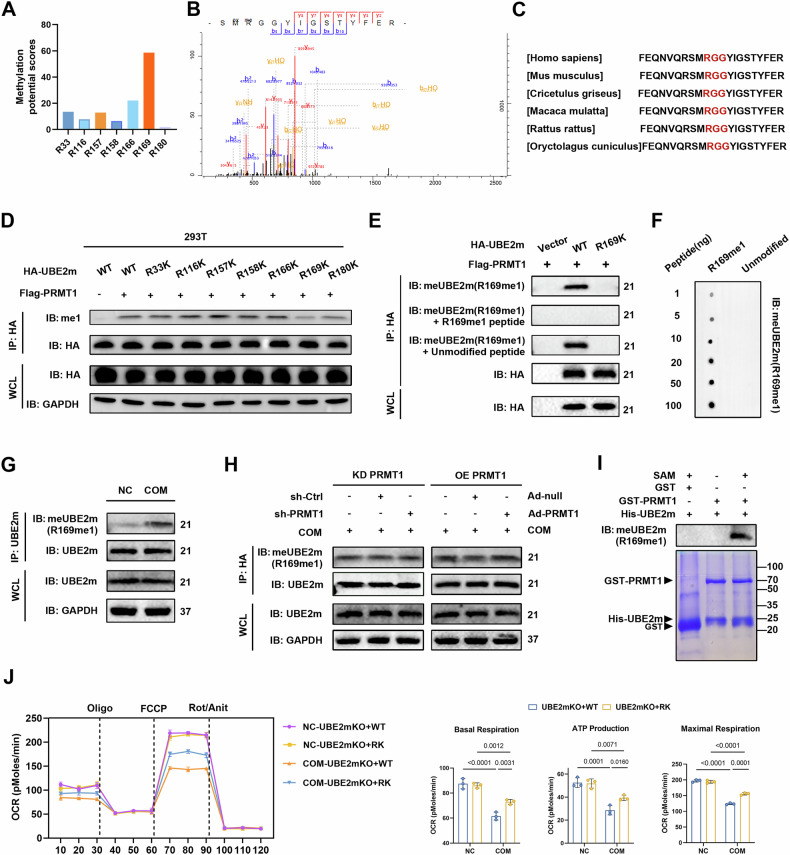
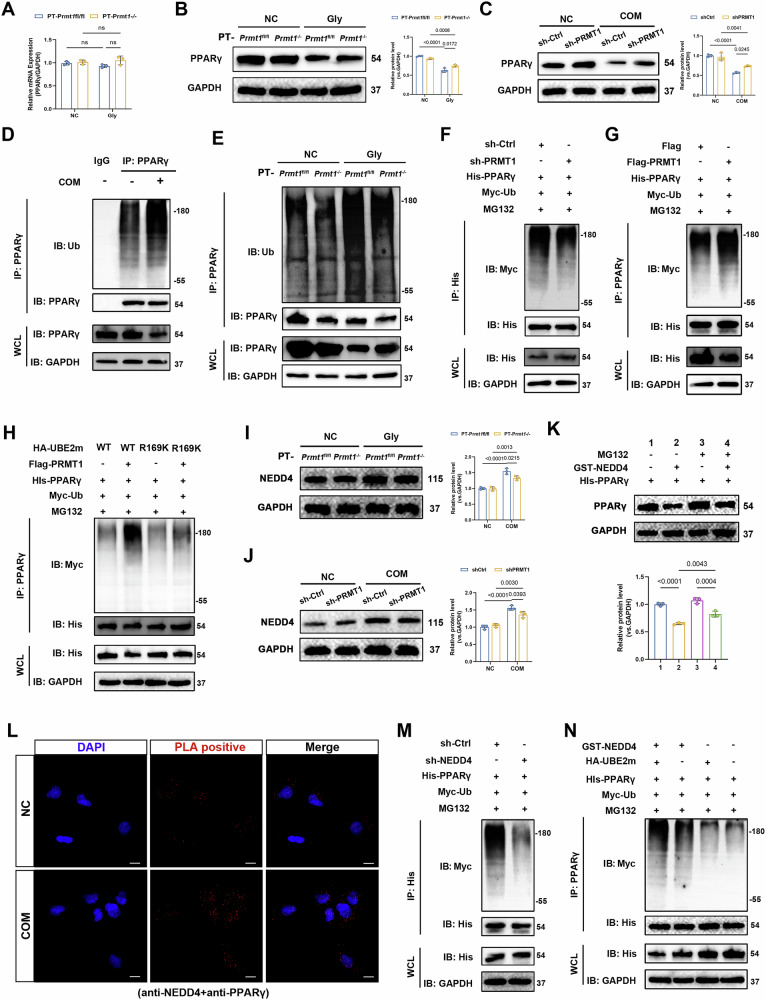
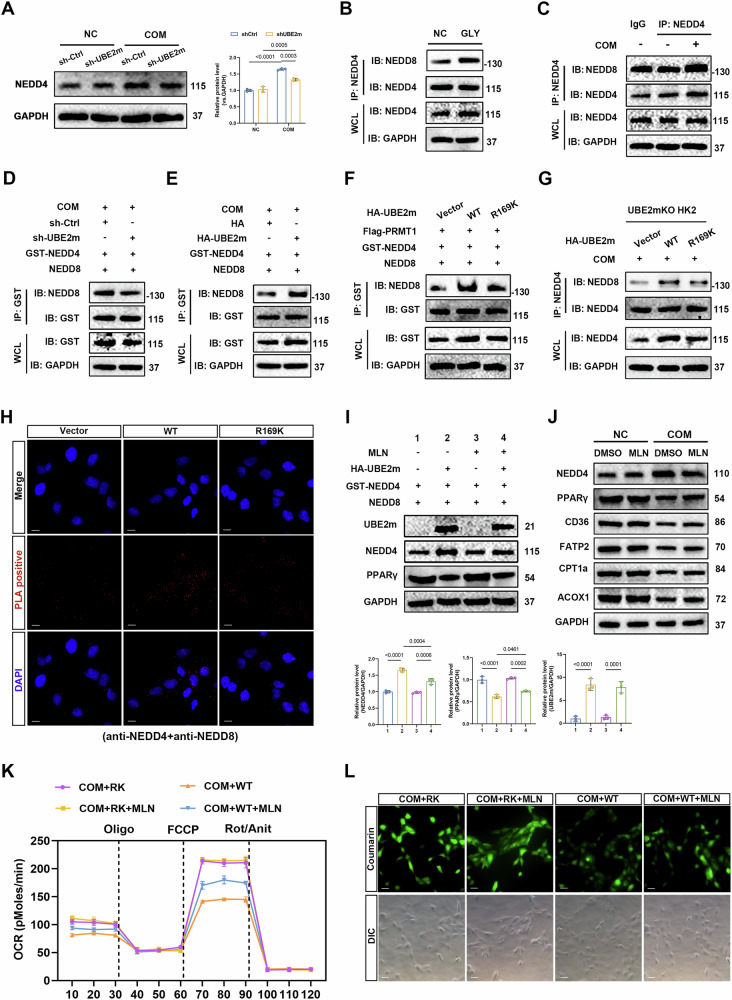
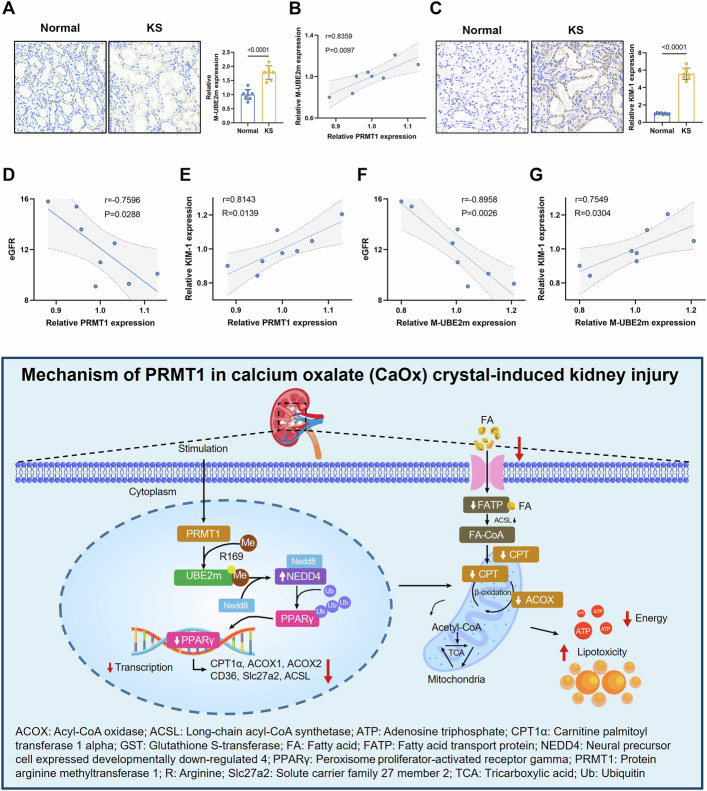
Calcium oxalate (CaOx) is the most common type of kidney stone, and its crystal deposition can induce oxidative stress, inflammatory responses, and cell death. This further aggravates kidney structural and functional damage, which in turn, promotes kidney stone recurrence, forming a vicious cycle of repeated stone formation and renal injury. Therefore, identifying precise and effective therapeutic targets is crucial to prevent the damage and inflammation caused by kidney stones. Protein arginine methyltransferase 1 (PRMT1) is a well-known epigenetic regulatory enzyme involved in renal metabolic reprogramming. However, the role of PRMT1-mediated arginine methylation in kidney stone-induced renal injury remains unclear. In this study, mice with specific deletion or overexpression of PRMT1 in tubular epithelial cells were developed, and a CaOx crystal-induced kidney injury mouse model was established. Single-cell RNA-sequencing, metabolomic, proteomic, and transcriptomic analyses, together with immunoprecipitation, mass spectrometry, GST-pulldown assays, oxygen consumption rate assays, and other methods, were used to reveal the mechanism of PRMT1 in renal injury caused by CaOx crystals. Specifically, PRMT1 enhanced the protein function of UBE2m through arginine methylation at R169, and increased the neddylation level and protein stability of NEDD4, thereby inducing PPARγ ubiquitination. Increased PPARγ degradation inhibited downstream fatty acid metabolism, leading to renal lipid accumulation, disrupted energy metabolism, and impaired kidney function. These findings provide a novel potential therapeutic target for CaOx kidney stones.


Conflict of interest statement

COMPETING INTERESTS: The authors declare no competing interests. Ethics approval and consent to participate: Samples were obtained with informed consent, and all protocols were performed in accordance with the Declaration of Helsinki and were approved by the review board of Renmin Hospital of Wuhan University (WDRY2021-KS047). Informed consent was obtained from patients. Animal experiments were approved by the Animal Care and Use Committee of Renmin Hospital of Wuhan University (WDRM 20200604), which complied with the Guide for the Care and Use of Laboratory Animals (NIH Publication No. 85-23). All methods were performed in accordance with the relevant guidelines and regulations.

Figures

Fig. 1
Fig. 1. PRMT1 is upregulated and regulates fatty acid metabolism in kidneys with calcium oxalate crystal-induced injury.
A The violin plot showing the expression level of PRMT1 in various cell clusters from the NC and the KS groups. B, C The volcano plot of different expression genes or proteins assayed using RNA- or proteome sequencing of kidney tissues. PRMT1 was significantly increased at both the RNA and protein levels. D Representative immunohistochemical staining images (100× and 400×) and quantitative analysis (F) of the expression of PRMT1 in the nonfunctioning kidney of patients and in kidneys with CaOx crystals injury of mice. Scale bars = 50 μm. E Representative western blot banding and quantitative analysis (G) of the expression levels of PRMT1 and MMA in the NC and the Gly groups. H Representative images of immunofluorescence co-staining of PRMT1 (red) and renal tubular markers LTL, PNA, and DBA (green) in kidneys of mice. Scale bars = 50 μm. I Oil Red O staining of kidney sections from the indicated groups. J GO enrichment analysis of RNA-sequencing data comparing the expression levels between NC and the Gly group. K Heat map showing differential content of acyl-CoAs between the NC and the Gly groups. L GSEA enrichment analysis of differential proteins between the Gly group and the CKO group, assayed by proteome sequencing of kidney tissues. M Relative mRNA levels of key molecules of lipogenesis, fatty acid transport, and oxidation from the indicated groups. Significance was assessed using two-way ANOVA or t-tests. Data are presented as mean ± SD.
Fig. 2
Fig. 2. Knockout of PRMT1 in tubular epithelial cells can alleviate calcium oxalate-induced renal injury by improving fatty acid metabolism.
A Representative histology images of the indicated groups: Vonkossa staining indicates the area and location of calcium oxalate crystals deposition (400×); HE staining shows the degree of renal tubular injury (200×); TUNEL staining shows the relative number of apoptotic renal cells (200×). Scale bars = 50 μm. B, C Representative TEM images demonstrate the degree of mitochondrial damage and lipid droplet accumulation. Scale bars = 500 nm. D Representative western blot banding and quantitative analysis of the expression levels of ACOX1, CPT1a, CD36, and FATP2. E Mitochondrial oxidative capacity was measured in real time after knockdown of PRMT1 or COM treatment in HK-2 cells; Quantification of basal respiration, ATP production-coupled respiration, and maximal respiration. Significance was assessed using two-way ANOVA tests. Data are shown as mean ± SD.
Fig. 3
Fig. 3. Overexpression of PRMT1 in tubular epithelial cells can aggravate calcium oxalate-induced renal injury by inhibiting fatty acid metabolism.
A Representative histology images of the indicated groups: Vonkossa staining indicates the area and location of calcium oxalate crystal deposition (1X and 200X); HE staining shows the degree of renal tubular injury (200X); TUNEL staining shows the relative number of apoptotic renal cells (200X). Scale bars = 50 μm. B, C Representative TEM images demonstrate the degree of mitochondrial damage and lipid droplet accumulation. Scale bars = 500 nm. D Representative western blot bandings show the expression levels of ACOX1 and CPT1α. E Mitochondrial oxidative capacity was measured in real time after overexpression of PRMT1 or COM treatment in HK-2 cells; basal respiration, ATP production-coupled respiration, and maximal respiration were quantified. Significance was assessed using two-way ANOVA tests. Data are shown as mean ± SD.
Fig. 4
Fig. 4. PRMT1 interacts with and methylates UBE2m, and this interaction is enhanced in tubular epithelial cells with COM treatment.
A Silver-stained SDS-PAGE gel of the immunoprecipitation product. B MS/MS spectra of the peptide “FSPSGIFGAFQR-COOH.” Peaks in color are the detected b (green) and y (red) ions. C The volcano plot indicating potential target proteins of PRMT1. D Molecular docking pattern diagram of PRMT1 and UBE2m. E Representative images of immunofluorescence staining of UBE2m (green) and PRMT1 (red) in HK-2 cells treated with COM. Scale bars = 50 μm. F Reciprocal co-IP analysis of PRMT1 and UBE2m in HK-2 cells with COM treatment. IgG was used as a negative control. G Recombinant GST-PRMT1 was incubated with recombinant His-UBE2m, followed by GST-pulldown and immunoblotting analysis with GST and His antibodies. H Endogenous UBE2m was immunoprecipitated in cells from the indicated groups. The mono-methylation (me1) level of UBE2m was determined using immunoblotting. I PLA detection of PRMT1 and UBE2m interaction in HK-2 cells from the indicated groups. Scale bars = 50 μm. J The me1 level of UBE2m was determined using immunoblotting after UBE2m was immunoprecipitated in HK-2 cells with PRMT1 knockdown or overexpression.
Fig. 5
Fig. 5. PRMT1 regulates fatty acid metabolism by methylating UBE2m at R169 in tubular epithelial cells.
A The scores of potential methylation sites of UBE2m predicted using the GPS-MSP tool. B MS identification of R169 mono-methylation of HA-UBE2m immunopurified by HA beads. C Sequence alignment of UBE2m protein from indicated species. D HA-UBE2m WT or different point mutants were co-transfected with FLAG-PRMT in HEK293T cells. The me1 level of UBE2m was measured by immunoblotting following immunopurification. E The me1 of immunopurified HA-UBE2m was measured using a site-specific antibody against R169 mono-methylation (meUBE2m (R169me1)). Antibody efficacy and specificity were examined by pre-incubating with the R169me1 peptide or the unmodified peptide prior to application. F Dot blot analysis of different amounts of R169me1 peptide or unmodified peptide by a site-specific antibody against meUBE2m (R169me1). G Endogenous UBE2m was immunoprecipitated in cells from the indicated groups. The R169me1 level of UBE2m was determined using immunoblotting. H The R169me1 level of UBE2m was determined using immunoblotting after UBE2m was immunoprecipitated in HK-2 cells with PRMT1 knockdown or overexpression. I Recombinant GST-PRMT1 and His-UBE2m proteins were incubated with or without SAM to detect the methylation of UBE2m mediated by PRMT1 in vitro. The reaction mixture was then subjected to CBB staining and immunoblotting with meUBE2m (R169me1) antibody. J Mitochondrial oxidative capacity was measured in real time after reintroduced UBE2m WT or RK treatment in UBE2m KO HK-2 cells; basal respiration, ATP production-coupled respiration, and maximal respiration were quantified. Significance was assessed using two-way ANOVA tests. Data are shown as mean ± SD.
Fig. 6
Fig. 6. PRMT1 regulates NEDD4-mediated PPARγ ubiquitination by methylating UBE2m in tubular epithelial cells.
A RT-PCR was used to detect the RNA levels of PPARγ from the indicated groups. Representative western blot banding and quantitative analysis show the expression levels of PPARγ from the indicated groups in mice (B) or in HK-2 cells (C). D Detection of endogenous ubiquitination levels of PPARγ in HK-2 cells with COM-treatment. E Detection of endogenous ubiquitination levels of PPARγ in CaOx crystals kidney injury in mice. F, G Detection of exogenous ubiquitination levels of PPARγ in HEK193T cells with PRMT1 knockdown or overexpression. H Detection of exogenous ubiquitination levels of PPARγ in HEK193T cells from the indicated groups. Representative western blot banding and quantitative analysis of the expression levels of NEDD4 from the indicated groups in mice (I) or HK-2 cells (J). K HK-2 cells were treated with MG132. Representative western blot banding and quantitative analysis showed the expression levels of PPARγ from the indicated groups. L PLA detection of NEDD4 and PPARγ interaction in HK-2 cells from the indicated groups. Scale bars = 50 μm. M Detection of exogenous ubiquitination levels of PPARγ in HEK193T cells with knockdown of NEDD4. N Detection of exogenous ubiquitination levels of PPARγ in HEK193T cells from the indicated groups. Significance was assessed using two-way ANOVA tests. Data are shown as mean ± SD.
Fig. 7
Fig. 7. Methylated UBE2m inhibits PPARγ-mediated fatty acid metabolism by neddylating NEDD4 in tubular epithelial cells.
A Representative western blot banding and quantitative analysis of the expression levels of NEDD4 from the indicated groups in HK-2 cells. B Detection of endogenous neddylation levels of NEDD4 from the indicated groups in mice or in HK-2 cells (C). D, E Detection of exogenous neddylation levels of NEDD4 in HEK193T cells with UBE2m knockdown or overexpression. F Detection of exogenous neddylation levels of NEDD4 in HEK193T cells transfecting UBE2m WT or RK. G Detection of endogenous neddylation levels of NEDD4 in UBE2mKO HK-2 cells re-introducing UBE2m WT or RK. H PLA detection of NEDD4 and NEDD8 interaction in HK-2 cells from the indicated groups. Scale bars = 50 μm. I HK-2 cells were treated with MLN4924. Representative western blot banding and quantitative analysis of the expression levels of UBE2m, NEDD4, and PPARγ from the indicated groups in HK-2 cells; and the expression levels of NEDD4, PPARγ, CD36, FATP2, CPT1α, and ACOX1 from the indicated groups in HK-2 cells (J). K Mitochondrial oxidative capacity was measured in real time after reintroduced UBE2m WT or RK treatment in UBE2m KO HK-2 cells, with or without MLN. L FAO blue staining demonstrates the degree of FAO in HK-2 cells from the indicated groups. Significance was assessed using two-way ANOVA tests. Data are shown as mean ± SD.
Fig. 8
Fig. 8. PRMT1 and methylated UBE2m are upregulated in the kidneys of patients with stones and positively correlated with renal injury markers.
A Representative immunohistochemical staining images (400X) and quantitative analysis of the expression of M-UBE2m in the nonfunctioning kidney of patients with stones or the control. Scale bars = 50 μm. B Pearson correlation analysis of the expression of PRMT1 and M-UBE2m. C Representative immunohistochemical staining images (400X) and quantitative analysis of the expression of KIM-1 in the nonfunctioning kidney of patients with stones or the control. Scale bars = 50 μm. DG Pearson correlation analysis of the expression of PRMT1 and eGFR (D), PRMT1 and KIM-1 (E), M-UBE2m and eGFR (F), M-UBE2m and KIM-1 (G). Significance was assessed using t-tests. Data are presented as mean ± SD.

Similar articles

References

    1. Scales CD Jr, Smith AC, Hanley JM, Saigal CS. Prevalence of kidney stones in the United States. Eur Urol. 2012;62:160–5. 10.1016/j.eururo.2012.03.052. - PMC - PubMed
    1. Khan SR, Pearle MS, Robertson WG, Gambaro G, Canales BK, Doizi S, et al. Kidney stones. Nat Rev Dis Prim. 2017;3:17001. 10.1038/nrdp.2017.1. - PubMed
    1. Wang Z, Deng Q, Gu Y, Li M, Chen Y, Wang J, et al. Integrated single-nucleus sequencing and spatial architecture analysis identified distinct injured-proximal tubular types in calculi rats. Cell Biosci. 2023;13:92. 10.1186/s13578-023-01041-3. - PMC - PubMed
    1. Canela VH, Bowen WS, Ferreira RM, Syed F, Lingeman JE, Sabo AR, et al. A spatially anchored transcriptomic atlas of the human kidney papilla identifies significant immune injury in patients with stone disease. Nat Commun. 2023;14:4140. 10.1038/s41467-023-38975-8. - PMC - PubMed
    1. Capolongo G, Ferraro PM, Unwin R. Inflammation and kidney stones: cause and effect? Curr Opin Urol. 2023;33:129–35. 10.1097/mou.0000000000001066. - PubMed

LinkOut - more resources