. 2025 Jul 31;16(1):6702.
doi: 10.1038/s41467-025-60106-8.

Global divergence in plant and mycorrhizal fungal diversity hotspots

Affiliations

Global divergence in plant and mycorrhizal fungal diversity hotspots

Laura G van Galen et al. Nat Commun. .

Abstract

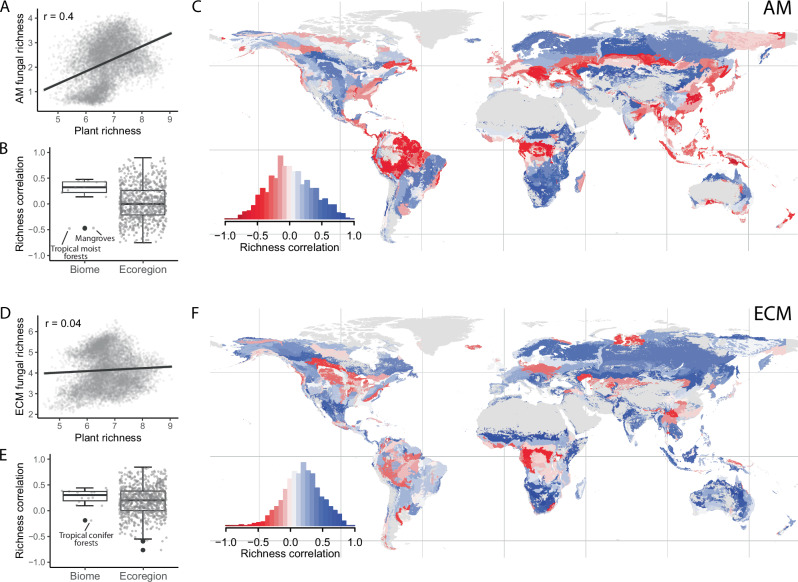
Environmental protection strategies often rely on aboveground biodiversity indicators for prioritising conservation efforts. However, substantial biodiversity exists belowground, and it remains unclear whether aboveground diversity hotspots are indicative of high soil biodiversity. Using geospatial layers of vascular plant, arbuscular mycorrhizal fungi, and ectomycorrhizal fungi alpha diversity, we map plant-fungal diversity associations across different scales and evaluate evidence for potential correlation drivers. Plant-fungal diversity correlations are weak at the global scale but stronger at regional scales. Plant-arbuscular mycorrhizal fungal correlations are generally negative in forest biomes and positive in grassland biomes, whereas plant-ectomycorrhizal fungal correlations are mostly positive or neutral. We find evidence that symbiosis strength, environmental covariation, and legacy effects all influence correlation patterns. Only 8.8% of arbuscular mycorrhizal and 1.5% of ectomycorrhizal fungal diversity hotspots overlap with plant hotspots, indicating that prioritising conservation based solely on aboveground diversity may fail to capture diverse belowground regions.


Conflict of interest statement

Competing interests: The authors declare no competing interests.

Figures

Fig. 1
Fig. 1. The potential mechanisms driving plant–fungal richness correlation patterns.
If symbiosis-driven diversity ‘coupling’ is influencing diversity relationships we would expect A richness relationships to be stronger between arbuscular mycorrhizal (AM) fungi and plants compared to ectomycorrhizal (ECM) fungi and plants due to the majority of vascular plants (72%) being AM mycorrhizal host species and only 2% being ECM hosts. We might also expect B richness correlations to be stronger and more positive in regions where more of the plant species or vegetation biomass belong to potential host plants (i.e. such that all-plant diversity is a stronger proxy for host plant diversity). If richness correlations are strongly influenced by how species respond to external environmental gradients, we would expect that C more positive correlations would arise in regions where plant and fungal richness respond similarly to an environmental gradient (top right and bottom left segments), and negative correlations to arise where they respond differently (top left and bottom right segments). If legacy effects originating over either long-term evolutionary time scales or from more recent disturbance history influence correlation patterns we might expect that D richness correlations are stronger and more positive in regions where past climate fluctuations have been more stable (due to evolution of plants and fungi occurring at more consistent rates under stable climates), and that E richness correlations become weaker or negative with increasing human disturbance (particularly for AM plant–fungal correlations if disturbance increases AM fungal diversity but reduces plant diversity,).
Fig. 2
Fig. 2. Plant–fungal richness correlations (Spearman) at the global, biome, and ecoregion levels.
Correlations are shown for arbuscular mycorrhizal (AM) fungi (AC) and ectomycorrhizal (ECM) fungi (DF). A, D Show global-level relationships based on values from 10,000 randomly selected grid cells of the consensus plant and fungal richness maps (see ‘Methods’). Trend lines show linear fits. B, E Show the distribution of correlations re-calculated within biomes and ecoregions (from 10,000 randomly selected grid cells in each biome and 1000 cells in each ecoregion; boxes show median and interquartile range, whiskers show 1.5 times the interquartile range). Maps (C, F) show ecoregion polygons coloured by correlation strength. Negative correlations are shown in red and positive correlations in blue. Biome correlation outliers in (B, E) are labelled with biome names. Grey areas were excluded from the analyses due to high uncertainty in the original alpha diversity predictions or where predictions for each taxonomic group by the different studies strongly disagreed (mostly based on the coefficient of variation between bootstrap model replicates; see ‘Methods’). Maps showing non-linear relationships from GAMs between plant and fungal richness at the ecoregion scale, and a comparison between the Spearman correlation coefficients and deviance explained by the GAMs, are provided in Supporting Information Figs. S2 and S3.
Fig. 3
Fig. 3. Tests of correlation mechanism hypotheses described in Fig. 1.
All richness values are from the consensus richness maps produced to combine the richness predictions published by different authors (see ‘Methods’). Evidence for symbiosis-driven diversity coupling effects: A the partial percentage deviance in fungal richness directly explained by plant richness at the global level (based on generalised additive models (GAMs) including environmental covariates using 10,000 random global grid cells, see Supporting Information Fig. S6), and B partial residual plots from GAMs testing how richness correlations within ecoregions (points) changes as the percentage of vegetation biomass belonging to potential host plant species increases (AM host vegetation for AM fungal–plant correlations and ECM vegetation for ECM fungal–plant correlations). Evidence for environmental covariates driving diversity correlation patterns: C p-values show results of two-sided chi-squared tests testing the hypothesis that positive plant–fungal correlations (blue) occur in ecoregions when plant and fungal richness respond similarly (top right and bottom left panel segments) to mean annual temperature, mean annual precipitation, and soil pH, and negative plant–fungal correlations (red) occur when they respond in opposite directions (top left and bottom right panel segments). Coefficient estimates were calculated from linear models including plant richness, fungal richness, and percentage host plant vegetation biomass as covariates to remove any variation due to potential symbiotic effects (see ‘Methods’). Biome summaries are provided in Supporting Information (Fig. S4). Evidence for both long-term and short-term legacy effects influencing correlation patterns: partial residual plots for GAMs testing the relationship between richness correlations within ecoregions and D climate stability index and E human development percentage (see ‘Methods’). Variables shown in (B, D, E) were included in the same GAMs, along with other environmental covariates relating to climate, soil properties, vegetation, and species richness (see ‘Methods’ and Supporting Information Fig. S5). The line shows the fitted curves, and shading shows one standard error. AM arbuscular mycorrhizal fungi, ECM ectomycorrhizal fungi.
Fig. 4
Fig. 4. Richness hotspot overlap.
Richness hotspots (top 95th percentile of richness predictions) for vascular plants (green), arbuscular mycorrhizal (AM) fungi and ectomycorrhizal (ECM) fungi (purple). Areas where plant and fungal hotspots overlap are shown in pink. Hotspots are mapped individually for the four previously published alpha diversity geospatial layers (and not the consensus richness maps), and hotspot or overlap areas identified by more than one study are shaded darker. Dark grey areas are those included in the analysis; light grey areas were excluded due to high uncertainty in the original alpha diversity predictions or where predictions for each taxonomic group by different studies strongly disagreed (mostly based on the coefficient of variation between bootstrap model replicates; see ‘Methods’). Blue bars show how hotspot overlap area is distributed across biomes. A breakdown of the hotspot areas for each individual geospatial layer is provided in Supporting Information Fig. S7, and maps of hotspots recalculated at the biome level (i.e. top 95th percentile within each biome) are provided in Figs. S9 and S10.

Similar articles

References

    1. Tilman, D., Isbell, F. & Cowles, J. M. Biodiversity and ecosystem functioning. Annu. Rev. Ecol. Evol. Syst.45, 471–493 (2014).
    1. Soliveres, S. et al. Biodiversity at multiple trophic levels is needed for ecosystem multifunctionality. Nature536, 456–459 (2016). - PubMed
    1. Anthony, M. A., Bender, S. F. & van der Heijden, M. G. A. Enumerating soil biodiversity. Proc. Natl. Acad. Sci. USA120, e2304663120 (2023). - PMC - PubMed
    1. Bardgett, R. D. & van der Putten, W. H. Belowground biodiversity and ecosystem functioning. Nature515, 505–511 (2014). - PubMed
    1. Van Der Heijden, M. G. A., Bardgett, R. D. & Van Straalen, N. M. The unseen majority: soil microbes as drivers of plant diversity and productivity in terrestrial ecosystems. Ecol. Lett.11, 296–310 (2008). - PubMed

LinkOut - more resources