

Higher legs muscle mass reduces gross mechanical efficiency during moderate intensity cycling in young healthy men
- PMID: 40744954
- PMCID: PMC12314055
- DOI: 10.1038/s41598-025-08353-z
Higher legs muscle mass reduces gross mechanical efficiency during moderate intensity cycling in young healthy men
Abstract
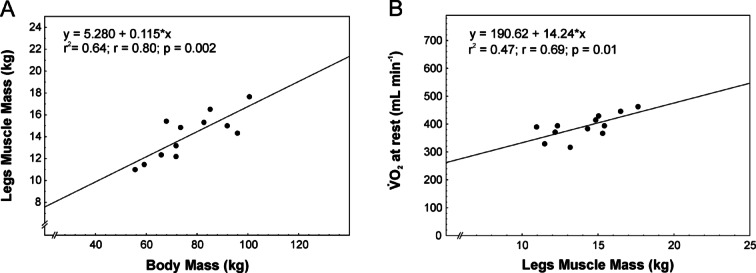
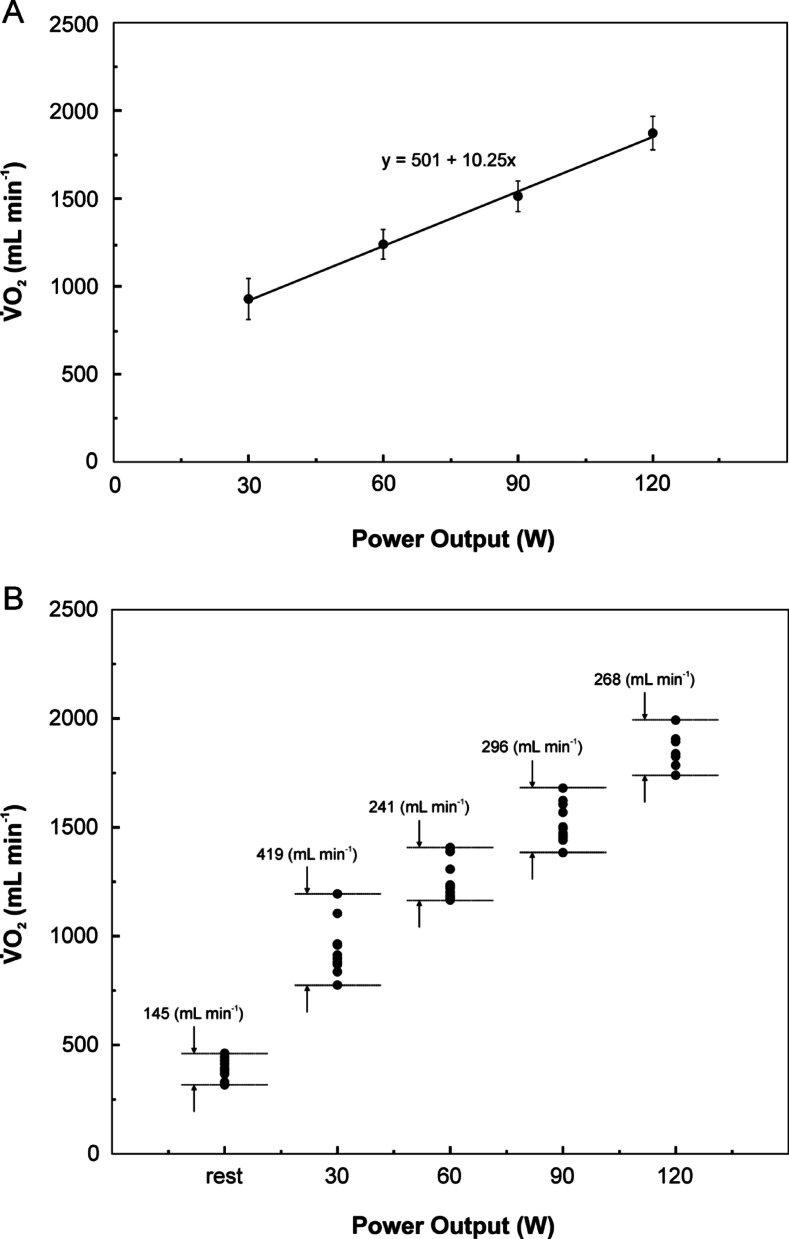
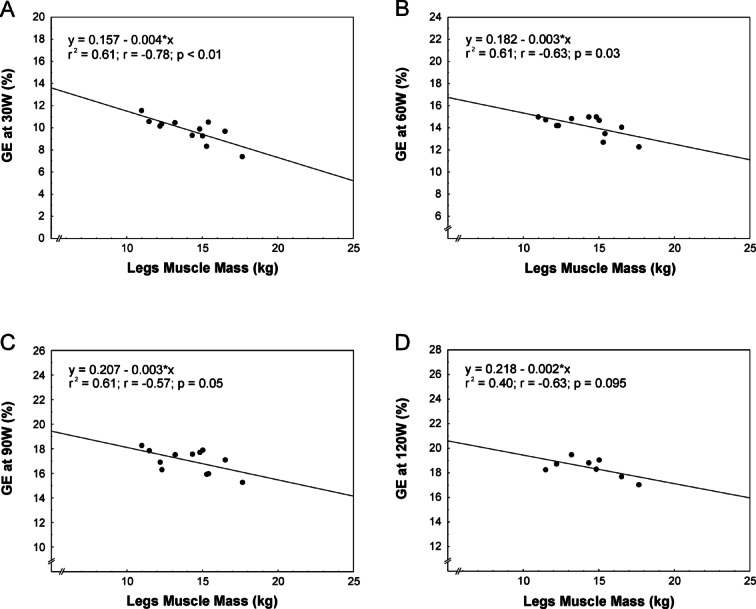
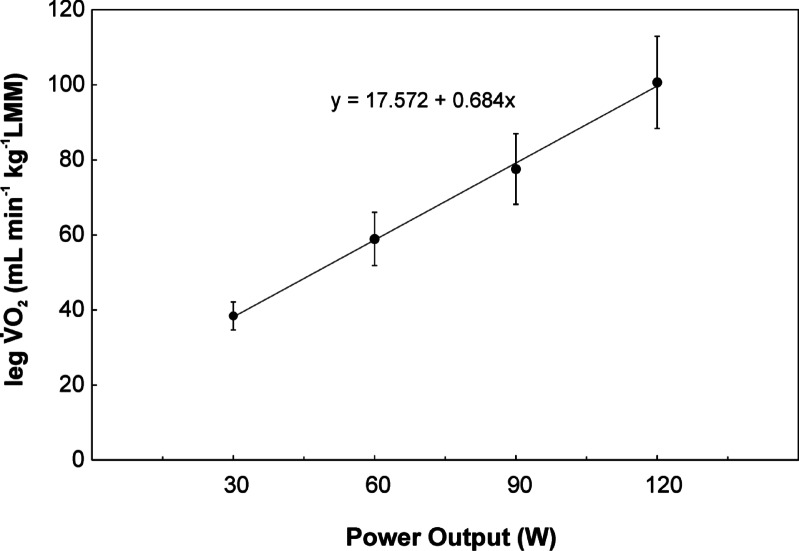
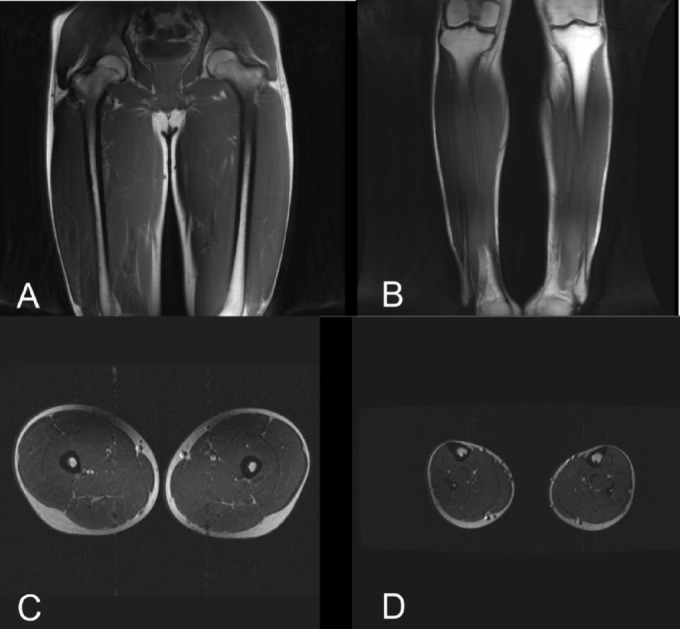
Twelve healthy untrained men (age 22 ± 1 years; body mass (BM) 76.8 ± 14.4 kg; height 180 ± 8 cm, (mean ± SD)), participated in this study. The subjects performed an incremental exercise test on a cycloergometer with an increase of power output (PO) by 30 W every 3 min - until exhaustion. Gross mechanical efficiency (GE) and delta efficiency (DE) during exercise of moderate-intensity (below lactate threshold - < LT) was calculated. Both legs muscle mass (LMM) (determined using 3T MRI) amounted to 14.1 ± 2.1 kg (i.e., 18.6% of body mass). Pulmonary oxygen consumption (V̇O2) at rest (sitting position) was 391 ± 42 mL min-1. The slope of the V̇O2(PO) relationship (at the PO's < LT) amounted to 10.25 ± 0.99 mL O2 min-1 W-1 and the intercept 501 ± 130 mL min-1. Pulmonary maximal oxygen uptake (V̇O2max) was 3198 ± 458 mL O2 min-1, 42.2 ± 5.7 mL O2 min-1 kg-1 BM and 187 ± 30 mL O2 min-1 kg-1 of LMM. The LMM was positively correlated with the V̇O2 at rest (p = 0.01). No relation between the LMM and the DE was found, whereas GE at the PO of 30-90 W was negatively correlated with the LMM (p ≤ 0.05). We concluded that greater muscle mass is not favorable when performing moderate-intensity cycling, since it results in poorer gross muscle mechanical efficiency.
Keywords: Delta efficiency; Energy expenditure; Exercise; Maximal oxygen uptake; Muscle mass; Power output.
© 2025. The Author(s).
Conflict of interest statement
Declarations. Competing interests: The authors declare no competing interests.
Figures

Similar articles
-
Children and adolescents with overweight or obesity exhibit poor cardiorespiratory performance and elevated energy expenditure during an exercise task.PLoS One. 2025 Jul 8;20(7):e0327875. doi: 10.1371/journal.pone.0327875. eCollection 2025. PLoS One. 2025. PMID: 40627658 Free PMC article.
-
Effectiveness of High-Intensity Interval Training (HIT) and Continuous Endurance Training for VO2max Improvements: A Systematic Review and Meta-Analysis of Controlled Trials.Sports Med. 2015 Oct;45(10):1469-81. doi: 10.1007/s40279-015-0365-0. Sports Med. 2015. PMID: 26243014
-
Pulmonary rehabilitation versus usual care for adults with asthma.Cochrane Database Syst Rev. 2022 Aug 22;8(8):CD013485. doi: 10.1002/14651858.CD013485.pub2. Cochrane Database Syst Rev. 2022. PMID: 35993916 Free PMC article.
-
Body mass and V'O2 at rest affect gross efficiency during moderate-intensity cycling in untrained young healthy men: correlations with V'O2MAX.J Physiol Pharmacol. 2023 Oct;74(5). doi: 10.26402/jpp.2023.5.03. Epub 2023 Dec 6. J Physiol Pharmacol. 2023. PMID: 38085515
-
Modelling metabolic performance in paediatric obstructive sleep disordered breathing: A case-control study.J Sleep Res. 2024 May;33(3):e13926. doi: 10.1111/jsr.13926. Epub 2023 May 26. J Sleep Res. 2024. PMID: 37243416
References
-
- Sargeant, A. J. & Jones, D. A. The significance of motor unit variability in sustaining mechanical output of muscle. Adv. Exp. Med. Biol.384, 323–338 (1995). - PubMed
-
- Edwards, R. H., Young, A., Hosking, G. P. & Jones, D. A. Human skeletal muscle function: description of tests and normal values. Clin. Sci. Mol. Med.52 (3), 283–290 (1977). - PubMed
-
- Whipp, B. J. & Wasserman, K. Efficiency of muscular work. J. Appl. Physiol.26 (5), 644–648 (1969). - PubMed
-
- Gaesser, G. A. & Brooks, G. A. Muscular efficiency during steady-rate exercise: effects of speed and work rate. J. Appl. Physiol.38 (6), 1132–1139 (1975). - PubMed
-
- di Prampero, P. E. Energetic of muscular exercise. Rev. Physiol. Biochem. Pharm.89, 143–222 (1981). - PubMed
MeSH terms
LinkOut - more resources
Full Text Sources
Medical
Miscellaneous
