. 2025 Aug;10(8):1918-1939.
doi: 10.1038/s41564-025-02064-x. Epub 2025 Jul 31.

Polypeptides synthesized by common bacteria in the human gut improve rodent metabolism

Affiliations

Polypeptides synthesized by common bacteria in the human gut improve rodent metabolism

Yong Fan et al. Nat Microbiol. 2025 Aug.

Abstract

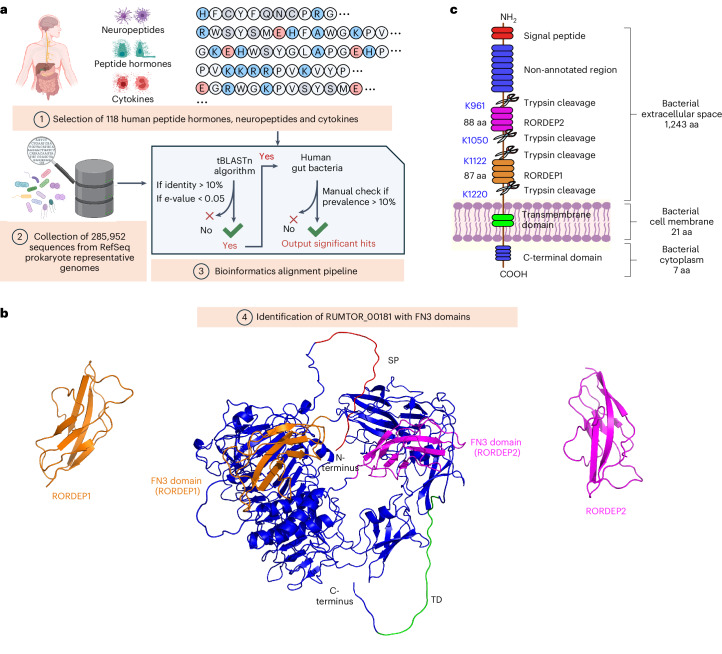
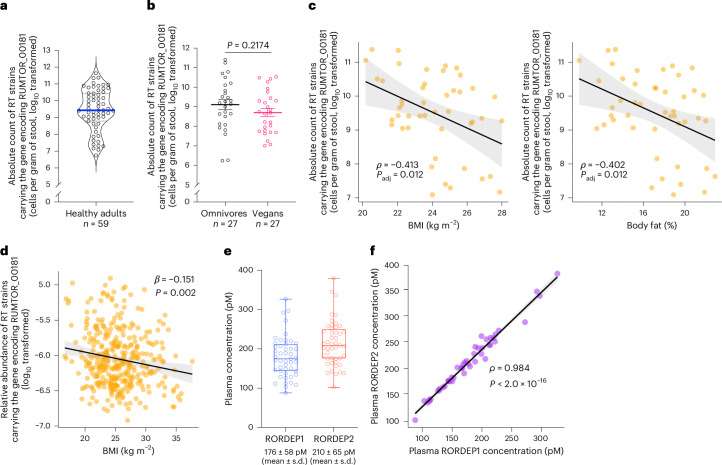
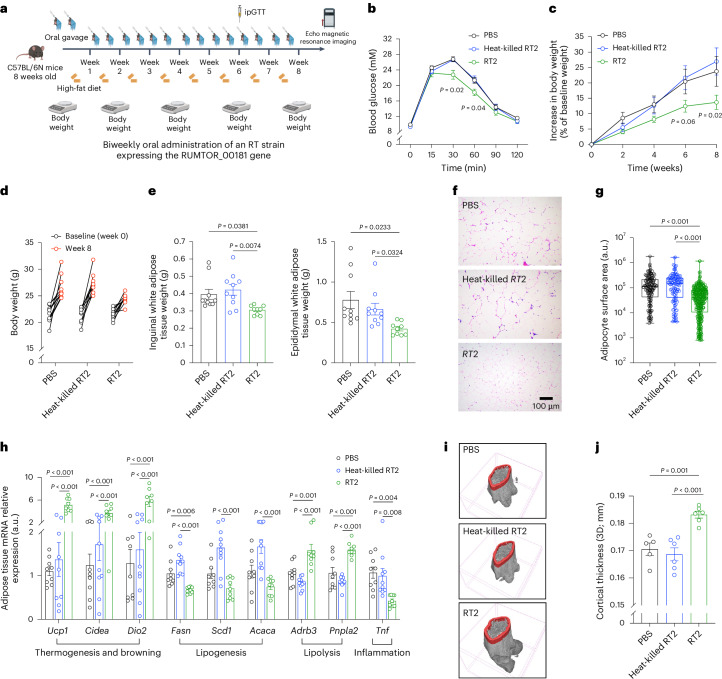
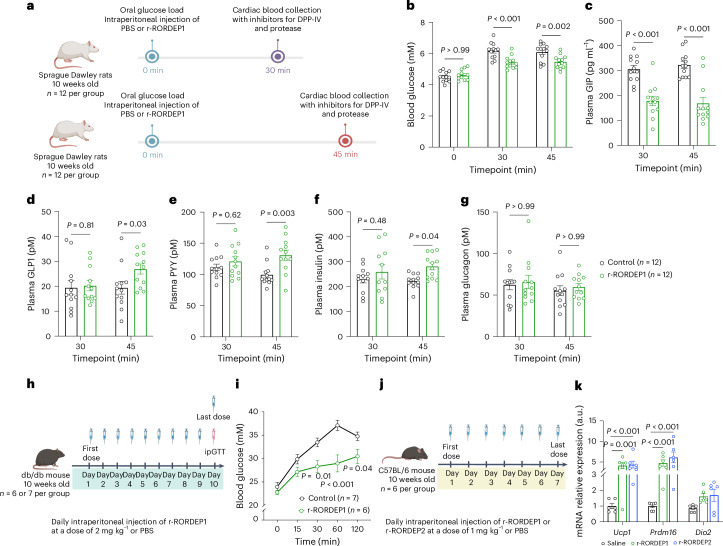
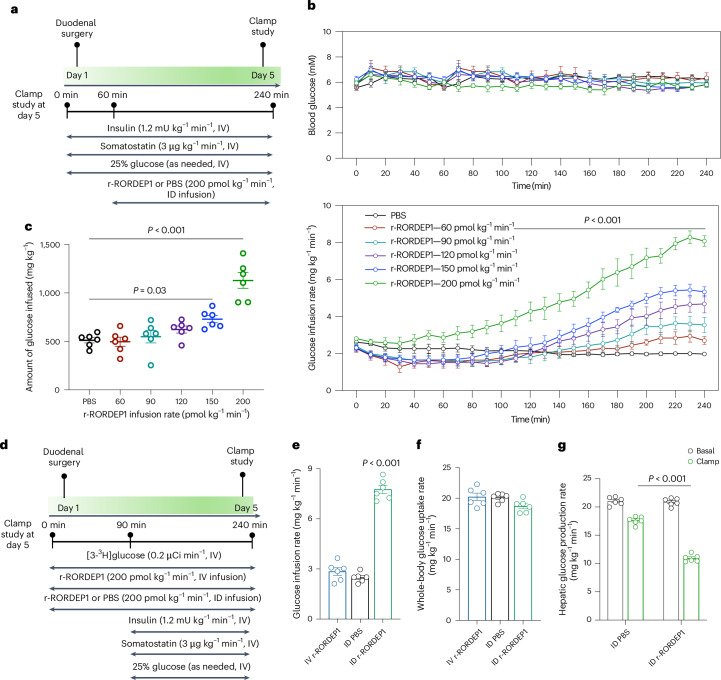
The human gut microbiota has the potential to synthesize proteins that may influence host metabolism. Here we report two polypeptides, RUMTOR-derived peptide (RORDEP) 1 and RORDEP2, circulating in human blood and synthesized by specific strains of gut commensal Ruminococcus torques that correlate inversely with adiposity in humans. Oral gavage with RORDEP-expressing strains improved glucose tolerance, increased bone density and reduced fat mass with an enhanced expression of genes and proteins involved in thermogenesis and lipolysis in lean mice on a high-fat diet and diet-induced obese mice. Recombinant RORDEP1 given to rats intraperitoneally decreased plasma gastric inhibitory polypeptide but increased glucagon-like peptide 1, peptide YY and insulin. Intestinal delivery of recombinant RORDEP1 to rats potentiated insulin-mediated inhibition of hepatic glucose production by downregulating genes and proteins controlling liver gluconeogenesis, glycogenolysis and lipogenesis but upregulating those involved in insulin signalling, glycogenesis and glycolysis. These preclinical findings warrant the exploration of RORDEPs for the prevention and treatment of human metabolic disorders.


Conflict of interest statement

Competing interests: O.P. and Y.F. are founders of GutCRINE. Currently, L.S., C.D.D.C. and F.Z. are scientists at Novo Nordisk. The other authors declare no competing interests.

Figures

Fig. 1
Fig. 1. Identification of RUMTOR_00181 and RORDEPs.
a, Utilization of a bioinformatics-driven genomic alignment approach revealed the presence of a RUMTOR_00181 protein in RT strains of human gut microbiota. The bacterial protein contains two FN3 protein domains with modest identity to the human FNDC5. b, Predictive modelling of the bacterial RUMTOR_00181 protein structure as performed in the AlphaFold Protein Structure Database (https://alphafold.ebi.ac.uk/entry/A5KIY5); this also holds for the structural prediction of RORDEPs. The AlphaFold-predicted 3D structure was visualized using Pymol (https://pymol.org/2/). SP, signal peptide; TD, transmembrane domain. c, A schematic representation of the topology of RUMTOR_00181 protein. aa, amino acids. The putative trypsin cleavage sites were predicted using PeptideCutter (https://web.expasy.org/peptide_cutter/). Panel a created with BioRender.com.
Fig. 2
Fig. 2. RT strain abundance and plasma RORDEPs and their host correlatives.
a, Abundance of RT strains harbouring the RUMTOR_00181 gene in stools from healthy adults. The RORDEP1 nucleotide sequence was used as a marker of the RUMTOR_00181 gene. The data are normalized against the total bacterial cell count. The blue line indicates the median value. b, Abundance of RT strains carrying the RUMTOR_00181 gene in stools from omnivores (black) and vegans (pink), shown as jittered strip plots. The mean value and the standard error of the mean are overlaid on the individual dots. The P value was computed by Wilcoxon rank-sum test (unpaired, two sided). c, Inverse relationships between the abundance of RUMTOR_00181-positive strains of the RT species and BMI (left) and fat percentage (right), analysed after excluding 13 individuals with undetectable plasma RORDEP levels. d, Association between BMI and the abundance of the RUMTOR_00181 gene-carrying RT strains in the LifeLines DEEP 2016 cohort (n = 1,135). The relationship was assessed using a linear regression model, with BMI as the dependent variable and the relative abundance of the RUMTOR_00181 gene as the independent variable. β (beta) represents the regression coefficient from a linear regression model. Covariates include age, sex and sequencing read count. Only individuals with non-zero RUMTOR_00181 abundance (orange dots) are visualized. e, Plasma RORDEP1 and RORDEP2 peptides in 46 healthy Danish adults. Each data point represents an individual measurement. In the box-and-whisker plot, the box boundaries represent the 25th and 75th percentiles. The line in the middle denotes the median (50th) percentile. The whiskers span between the minimum and maximum values. f, Correlation between plasma concentrations of RORDEP1 and RORDEP2. For c and f, Pearson’s two-sided correlation (ρ) tests were performed, and P values were adjusted for multiple comparisons using the Benjamini–Hochberg method in c. For c, d and f, error bands represent the linear regression line (black solid line) and the 95% confidence interval (grey shaded region). Source data
Fig. 3
Fig. 3. The RT2 strain expressing both RORDEPs improves mouse metabolism.
a, Lean male C57BL/6N mice were given a high-fat diet for 8 weeks along with twice-weekly oral gavage of live RT2 at a dose of 5 × 109 CFU per 100 µl of sterile PBS containing 10% glycerol. Control groups received sterile PBS containing 10% glycerol or an equivalent dose of heat-killed RT2. b, An ipGTT was done at week 6. c, Relative body weight changes in mice following the intervention. Weight increase was normalized to baseline at week 0. d, Body weight changes between week 0 and 8 across the three groups of mice. e, Weights of inguinal and epididymal white adipose tissue (measured at termination). f, Representative H&E-stained sections of inguinal white adipose tissue from each group (n = 9 images per group). The scale bar in the bottom of f applies to all images in each panel. g, Surface areas of segmented adipocytes from representative H&E-stained sections of inguinal white adipose tissue in f. Box plot elements: the centre line represents the median; the box limits indicate the 25th and 75th percentiles; the whiskers extend from the minimum to the maximum values. h, mRNA expression levels of genes related to thermogenesis and browning, lipogenesis, lipolysis and inflammation in inguinal white adipose tissue. i, 3D cross-sectional micro-CT images of femoral bone, with red sections indicating regions selected for cortical thickness analysis. j, Cortical thickness measurements derived from 3D images (n = 5 or 6 mice per group). Data are presented as mean ± s.e.m. Unless otherwise stated, n = 8 or 9 mice per group. Statistical analysis used two-way ANOVA with Bonferroni post hoc correction for b and c, and one-way ANOVA with Dunnett’s post hoc correction for e, g, h and j. Panel a created with BioRender.com. Source data
Fig. 4
Fig. 4. Peritoneal delivery of r-RORDEP1 improves the metabolism of rats and mice.
a, Schematic representation of the experimental design evaluating the effects of an oral glucose load and intraperitoneal injection of r-RORDEP1 on plasma concentrations of glucose, GIP, GLP1, PYY, insulin and glucagon in rats. Lean Sprague Dawley male rats 10 weeks of age were administered an oral glucose load (1 g kg−1) over 0–2 min, followed by an intraperitoneal injection of r-RORDEP1 (0.8 mg kg−1) or PBS as control (n = 12 per group). b–g, Levels of blood glucose (b), plasma GIP (c), plasma GLP1 (d), plasma PYY (e), plasma insulin (f) and plasma glucagon (g) measured at designated timepoints after glucose load and r-RORDEP1 injection. h, Experimental workflow for testing the effect of r-RORDEP1 on glucose tolerance in db/db mice. High-fat-fed db/db mice were administered daily intraperitoneal injections of r-RORDEP1 (2 mg kg−1) or PBS (control) for 10 days (n = 6 or 7 per group). i, Results of the ipGTT. Blood glucose levels were measured at baseline and at designated timepoints following glucose administration. j, Experimental design evaluating the effect of intraperitoneal injections of r-RORDEP1 in mice. Lean C57BL/6 male mice 10 weeks of age were daily administered with an intraperitoneal injection of r-RORDEP1 (1.0 mg kg−1) or saline as control (n = 6 per group) for 7 days. k, Daily intraperitoneal injection of r-RORDEP1 or r-RORDEP2 in mice (n = 6 per group) for 7 days induces increased expression of genes involved in thermogenesis and browning of inguinal white adipose tissue. The mRNA levels of indicated genes were analysed by qRT-PCR. Data were analysed using Student’s t-test. For bg, i and k, data are expressed as mean ± s.e.m. Statistical significance was determined using two-way ANOVA with Bonferroni’s post hoc test for bg and i and one-way ANOVA with Dunnett’s post hoc test for k. Panels a, h and j created with BioRender.com. Source data
Fig. 5
Fig. 5. Intestinal delivery of r-RORDEP1 enhances the insulin sensitivity of hepatic glucose output in rats.
a, Experimental schematic showing that lean male Sprague Dawley rats (8 weeks old) were cannulated on day 1 and subjected to a 4-h euglycaemic pancreatic clamp on day 5. From 60 min to 240 min, the rats received intraduodenal infusions of either PBS or r-RORDEP1 (60–200 pmol kg−1 min−1), alongside constant duodenal infusion of insulin and somatostatin. Glucose was infused intravenously as needed to maintain euglycaemia. ID, intraduodenal. IV, intravenous. b, Blood glucose levels (top) and cumulative glucose infusion rates (bottom) over time during the clamp procedure; P < 0.001 indicates significant differences in at least one RORDEP1-treated group compared with PBS. c, A scatter plot depicting the AUC for the glucose infusion rates needed to sustain euglycaemia in rats (n = 6 per group) receiving varying concentrations of r-RORDEP1 during a euglycaemic pancreatic clamp. d, Experimental schematic of additional intervention arms comparing ID PBS, IV r-RORDEP1 and ID r-RORDEP1 delivery. [3-³H]glucose was infused to monitor hepatic glucose production throughout the clamp procedure. e, Glucose infusion rates required to maintain euglycaemia during the clamp for the conditions shown in d. f, Bar graph showing glucose clearance rates across the study conditions described in d. g, Bar graph illustrating glucose production rates under the conditions outlined in d. Data are presented as mean ± s.e.m. Statistical significance was assessed using two-way ANOVA with Dunnett’s post hoc test (b), one-way ANOVA with Dunnett’s post hoc test (c and f) and two-sided unpaired Student’s t-test (g). For b, c and eg, n = 6 rats per group. Source data
Fig. 6
Fig. 6. Intestinal delivery of r-RORDEP1 to rats changes the expression of key liver genes involved in metabolism and insulin signalling.
a, A total of 12 8-week-old lean male Sprague Dawley rats fed standard chow were randomized to receive either intraduodenal infusion of r-RORDEP1 (200 pmol kg−1 min−1) (n = 6 in the RORDEP1 group) or sterile PBS for 3 h (n = 6 in the control group). b, r-RORDEP1 administration resulted in a 13% reduction in blood glucose levels at 180 min relative to the baseline at timepoint 0 min. Significance was determined using paired Student’s t-test. c, PCA score plot showing 12 rat liver RNA samples from r-RORDEP1 or control infusion groups, based on 13,453 normalized gene expressions after variance stabilizing transformation. The plot illustrates all genes projected onto the first and second principal components. d, Volcano plot illustrating the results of univariate analysis of differentially expressed genes (DEGs) in the liver. Each point represents one gene, plotted with its log2(fold change) on the x-axis and −log10-adjusted P value on the y-axis. Genes significantly upregulated (Padj < 0.05 and log2(fold change) > 1) are shown in blue, significantly downregulated genes (Padj < 0.05 and log2(fold change) < −1) are in orange, and non-significant genes or those not meeting the fold change criteria are in grey. e, Heatmap showing gene expression profiles (z-score of normalized expression levels) associated with gluconeogenesis, glycogenolysis, lipogenesis, glycogenesis, glycolysis and the insulin–PI3K–AKT signalling pathway. All genes shown are significantly differentially expressed between the two experimental groups. For d and e, the P values were adjusted using the Benjamini–Hochberg method for multiple corrections. Panel a created with BioRender.com. Source data
Extended Data Fig. 1
Extended Data Fig. 1. Proteomics identification of selected proteotypic peptides that are unique to RORDEPs in supernatants of bacterial cultures using liquid chromatography-mass spectrometry (LC-MS).
In each panel, the left section displays the selected proteotypic peptides (underscored and highlighted in red) that are unique to sequences of RORDEPs. In the central section, the left graph displays the fragmentation patterns for the unique peptides in the identification of RORDEPs, with b- and y- ions indicating that the fragmentation occurs in a way that the charge is retained on the N-terminus and C-terminus, respectively, of the respective peptide. The b-ions contain the amino-terminal end of the peptides and are numbered starting from the N-terminus (the beginning of the peptide chain). The y-ions contain the carboxyl-terminal end of the peptide and are numbered starting from the C-terminus (the end of the peptide chain). The right graph shows the extracted ion chromatograms (EIC) for b- and y-ions and the retention time for the selected proteotypic peptides in the 3-30 kDa fractions collected from cultural supernatants of RT ATCC 27756 containing RUMTOR_00181. The EICs of b- and y-ions are labeled according to the fragmentation patterns shown in the left section. In the right section, observed tandem mass spectrometry (MS²) spectra are depicted. The illustrations detail their MS2 with mass accuracy expressed in parts per million (ppm).
Extended Data Fig. 2
Extended Data Fig. 2. Absolute quantification of RORDEP1 and RORDEP2 peptides in human plasma samples applying liquid chromatography tandem mass spectrometry (LC-MS).
In panel (a), the left section shows the selected proteotypic peptides (underscored and highlighted in red) that are unique to the sequences of RORDEP1 or RORDEP2. In the central section, the left graph displays the fragmentation patterns for the unique peptides in the identification of RORDEPs. b- and y- ions indicate that the fragmentation occurs in a way that the charge is retained on the N-terminus and C-terminus, respectively, of the peptide. The b-ions contain the amino-terminal end of the peptide and are numbered from the N-terminus (the beginning of the peptide chain) and the y-ions contain the carboxyl-terminal end of the peptide and are numbered from the C-terminus (the end of the peptide chain). The middle graph shows the extracted ion chromatograms for b- and y-ions, and the retention time for the selected proteotypic peptides in human plasma. The extracted ion chromatograms (EICs) of b- and y- ions are labeled according to the fragmentation patterns that are shown in the left graph. In the right section, observed tandem mass spectrometry (MS²) spectra using a Q Exactive mass spectrometer is depicted. The section details their MS 2 with mass accuracy expressed in parts per million (ppm). (b) Bar graphs representing the coefficient of variation for intra- individual variability in signal intensity of RORDEP1 (blue) and RORDEP2 (orange). Each bar represents one individual sample out of five independently examined samples from the same plasma pool. Source data
Extended Data Fig. 3
Extended Data Fig. 3. Intestinal engraftment, body composition, brown adipose tissue expression of uncoupling 1 (UCP1) protein, and femoral cortical thickness in mice following eight weeks of oral gavage twice weekly of RT ATCC 27756 strain (RT2) expressing the RUMTOR_00181 gene.
C57BL/6N mice were eight weeks old at start of intervention and were given a high-fat diet for a further eight weeks. The dose of RT2 was 5 × 109 in 100 µl of sterile phosphate-buffered saline (PBS) with with 10% glycerol or heat-killed RT2. (a) Engraftment testing at end of intervention at week eight (n = 9 per group). Abundance of RT strains expressing the RUMTOR_00181 gene was measured by quantitative PCR-normalized 16S rDNA in faecal DNA from mice treated with PBS or the live RT2 strain. (b) Segmented adipocytes from representative hematoxylin- and eosin-stained sections of inguinal white adipose tissue are depicted in Fig. 3f and analyzed using AdipoCount. (c) Magnetic resonance imaging scanning of mouse body composition (n = 10 for PBS and heat-killed RT2 groups, and n = 9 for RT2 group). (d) The frequency distribution of adipocyte cell surface area (in arbitrary units, a.u.) in inguinal white adipose tissue across the three specified groups. (e) Immunoblotting result of UCP1- and housekeeping β-actin proteins in interscapular brown adipose tissue (n= six mice in each of four groups). (f) Quantifications of the immunoblottings of UCP1 and β-actin in panel c are given as ratios (n = 6 per group). (g) High-resolution 3D reconstructions of femoral bones (5–6 mice per group), with red sections indicating the regions selected for cortical thickness analysis. In panel a, significance was obtained by Student’s t-test (two-sided). In panels c and f, statistical analysis was performed using one-way ANOVA with Dunnett’s post hoc correction for multiple comparisons. For panels a, c, and f, data are presented as mean ± SEM. Source data
Extended Data Fig. 4
Extended Data Fig. 4. Impact of R. torques ATCC 27756 (RT2) intervention on the 16S rRNA gut microbiota profile of mice.
(a) Bar plots representing the relative abundance of bacterial families in the gut microbiota of mice treated with RT2 (n = 9) and control mice receiving sterile phosphate-buffered saline (PBS) containing 10% glycerol (n = 9) over an 8-week period via oral gavage. (b) Box plots illustrating the Chao1 richness estimator and Shannon diversity index for the gut microbiota of RT2-treated and control mice (n = 9 per group). Statistical significance was calculated using the two-sided Wilcoxon test; ns denotes non-significant. Box plot elements: centre line represents the median; box limits indicate the 25th and 75th percentiles; whiskers extend from the minimum to the maximum values. (c) Principal coordinate analysis (PCoA) plot visualizing the Bray-Curtis dissimilarity at the amplicon sequencing variants (ASVs) level, comparing the gut microbial communities of RT2-treated and control mice. PERMANOVA analysis (two-tailed) based on Bray-Curtis dissimilarity was conducted to assess differences between groups. Source data
Extended Data Fig. 5
Extended Data Fig. 5. Mouse interventions with Escherichia coli Nissle 1917 (EcN) engineered to express RORDEP1.
(a) Luciferase reporter assay showing the signal intensity of secreted RORDEP1 in the spent culture supernatant of the engineered EcN strain and the negative control. Analyzed at 20-fold and 200-fold dilutions. Culture medium alone (lank; 2 × YT) was included to assess background signal. Bars represent the mean luciferase signal from three biological replicates. (b) Quantification of secreted RORDEP1 from the engineered strain using a standard curve generated with a HibiT-tagged control protein. (c) Bacterial load of the engineered EcN strains expressed as colony-forming units per milliliter (CFU/mL) of diluted culture media. (d) In independent experiment #1, twenty-four 20-week-old C57BL/6 N male mice, which had been on a high-fat diet for 12 weeks prior to the start of interventions, were assigned to each group receiving either 5 × 1010 CFU of live EcN-RORDEP1 /100 µl of sterile phosphate-buffered saline (PBS) or 5 × 1010 CFU of live EcN-Control /100 µl of sterile PBS for four consecutive days. The timeline details the protocol for mice acclimatization and subsequent administration of EcN strains. From day minus four and until termination (day 21), streptomycin was added to drinking water to ensure a consistently high level of bacteria engraftment. (e and k) Blood glucose levels measured during intraperitoneal glucose tolerance test (ipGTT) in two independent experiments. (f and l) The area under the curve (AUC) for the ipGTT in two independent experiments. (g and m) Graphs illustrating the body weight alterations over time for both groups in two independent experiments. (h) This plot displays the engraftment profiles in mouse stools of the two different EcN strains; analyses were done at day 4, 8, 12 and 18, respectively, during a 20-day period in the independent experiment #1 as shown in panel a. The CFU per gram of feces are plotted on a logarithmic scale. Two groups are compared: the control group (EcN-Control, black circles) and the group treated with EcN- RORDEP1 (green circles). Data points represent mean CFU values, and error bars indicate standard deviations. (i) Distribution of E. coli expressed in CFU per gram of intestinal contents from various regions of the intestinal tract (ileum, cecum, and colon) on day 20 (termination) in the independent experiment #1 as shown in panel (d). Each data point represents an individual sample from either EcN-Control (black) or EcN- RORDEP1 group (green), with the mean values indicated by the horizontal lines. (j) Overview of the second experiment lasting for 18 days. Statistical assessments for blood glucose levels and body weight changes were conducted using two-way ANOVA with Bonferroni post hoc adjustments. The significance of differences in AUC (panels f and l) and colonization (panel i) was determined with a two-sided unpaired Student’s t-test. Panels d and j created with BioRender.com. Source data
Extended Data Fig. 6
Extended Data Fig. 6. Assessments of in vitro effects of recombinant RORDEP1 in human and mammalian cellular models applying gene expression profiling.
In human white adipocytes, the expression of key adipogenic genes, including Pparγ (peroxisome proliferator-activated receptor gamma), Hsl (hormone-sensitive lipase), Gpat3 (glycerol-3-phosphate acyltransferase 3), Zbtb7 (zinc finger and BTB domain-containing protein 7A), Dgat2 (diacylglycerol O-acyltransferase 2), and Cd137 (tumor necrosis factor receptor superfamily member 9), was measured. In human osteoblasts, markers of osteogenic differentiation were assessed, including Osterix (transcription factor Sp7), ALP (alkaline phosphatase), CCL1(α) (chemokine ligand 1), SOST (sclerostin), RUNX2 (runt-related transcription factor 2), and COL1A1 (collagen type I alpha 1 chain). In human skeletal muscle cells, the expression of genes related to muscle differentiation and growth, such as Desmin (intermediate filament protein), MyoD (myogenic differentiation 1), SX1 (Sarcobox), MyoG1, and MyoG2 (myogenin isoforms), were evaluated. For human NCI-H716 enteroendocrine cells, the response to r-RORDEP1 treatment did not result in any significant transcriptional changes in the GLP-1 release. Similarly, in rat INS-1 pancreatic beta cells, a model commonly used for studying insulin secretion, r-RORDEP1 exposure for one hour at varying concentrations showed no significant effects. rat INS-1 cell line, n = 6 biological replicates; for the remaing, n = 3 replicates per condition. Error bars are the SEM of 3-6 independent replicates. Source data
Extended Data Fig. 7
Extended Data Fig. 7. Synthesis of scrambled recombinant RORDEP1 and testing of its potential effect on blood glucose over two hours in lean male C57BL/6J mice.
(a) Amino acid sequences of r-RORDEP1 and scrambled r-RORDEP1. (b) Comparison of predicted physicochemical properties of native RORDEP1 and scrambled RORDEP1. (c) AlphaFold2-predicted 3-dimentional structure of the two RORDEP1 peptides. (d) Experimental workflow of mouse experiment evaluating effects of the two RORDEP1 peptides on blood glucose in mice (n = 12 mice per group) for two hours. An initial oral glucose load (2 g/kg) was given in the fasting state immediately followed by an intraperitoneal injection of either PBS, r-RORDEP1 or scrambled r-RORDEP1; the two peptides were given at a dose of 1 mg/kg. (e) Curves of the glucose tolerance test at the indicated time points for the two peptides showing no effect of scrambled r-RORDEP1. (f) Area under the curve (AUC) analysis of glucose tolerance test (n = 12 per group). PBS denotes phosphate-buffered saline. Data are expressed as mean ± SEM. Statistical significance was determined using two-way ANOVA with Dunnett’s post hoc test for panel e and one-way ANOVA with Dunnett’s correction for panel f. Panel d created with BioRender.com. Source data
Extended Data Fig. 8
Extended Data Fig. 8. Stability of recombinant RORDEP1 in intestinal fluid, gut epithelial permeability of r-RORDEP1, and in vivo half-life of r-RORDEP1.
(a) In vitro stability of r-RORDEP1 (dark blue) in simulated intestinal fluid (SIF) including buffer control (light blue). Absorption that were measured at 214 nm illustrates r-RORDEP1 degradation upon exposure to SIF; data were recorded at various time points. Amount of left r-RORDEP1 upon the exposure to SIF or buffer were expressed as normalized area under the curves (AUCs) relative to 0 min. (b) Representative UPLC chromatograms of purified r-RORDEP1 spiked into phosphate-buffered saline (PBS) at increasing concentrations, demonstrating consistent retention time and concentration-dependent signal. (c) Quantification of r-RORDEP1 peak areas at increasing concentrations, expressed in arbitrary units (a.u.). (d) Quantitative analysis of r-RORDEP1 in the basolateral compartment following apical application of r-RORDEP1 at various concentrations during an incubation for 12 h. A dose-dependent increase in r-RORDEP1 concentration was observed. (e) Assessment of Caco-2 cell viability by 3-(4,5-dimethylthiazolyl-2)-2,5-diphenyltetrazolium bromide (MTT) viability assay after exposure to varying concentrations of r-RORDEP1. No significant impact on cell viability was observed compared to control. (f) Measurements of transepithelial electrical resistance (TEER) in Caco-2 monolayers following r-RORDEP1 exposure, indicating that tight junction integrity remained intact. (g) Representative chromatograms illustrating the presence and abundance of r-RORDEP1 in the basolateral compartment after transepithelial transport. The blank control in the chromatogram represents basolateral cell culture medium without r-RORDEP1 treatment, while the other chromatograms display either r-RORDEP1 reference standards or penetrated r-RORDEP1 detected in the basolateral medium. (h) Immunoblot analysis showing the presence 6×His-tagged-RORDEP1 polypeptide in plasma samples collected from four chow-fed lean eight weeks-old C57BL/6N mice at 5, 15, 30, 60, 120 and 240 min after intraperitoneal injection of r-RORDEP1 at a dose of 1 mg/kg. The expected size of the r-RORDEP1 protein (~12.5 kilodalton (kDa)) is indicated on the left. The blot lanes correspond to time points after administration by immunoblotting assay using anti-His-Tag Antibody (Cell Signal Technology, #2365). The experiment was performed once. (i) The relative abundance of plasma RORDEP1 was quantified by calculating the ratio of the pixel intensity for each band to the intensity of the adjacent background at various time points following the injection of 6×His-tagged r-RORDEP1 (n = 4 per group). This measurement was conducted using ImageJ software. Each data point represents an individual measurement from one mouse. Box-and-whisker plots display the median, quartiles, and range of protein abundance for each time point, with individual data points overlaid. For panels a, and c-f, data are presented as mean ± SEM, and n = 3 per group. Source data
Extended Data Fig. 9
Extended Data Fig. 9. Changes of the rat liver proteome following intestinal infusion of recombinant RORDEP1.
(a) Twelve 8-week-old lean male Sprague-Dawley rats (six after r-RORDEP1 and six after infusion of phosphate buffered saline (PBS)) were included. r-RORDEP1 was infused into duodenum with a rate of 200 pmol/kg/min for three hours. The analysis involved profiling a total of 7,678 proteins from the rat liver. (b) Principal Component Analysis (PCA) plot displays the distribution of samples based on the first and second principal components (PC1 and PC2), capturing 24.2 % and 17.3 % of the total variance, respectively. Each point represents an individual sample, categorized by treatment group (r-RORDEP1 or PBS). (c) Heatmap visualizes 379 proteins that exhibit significant differential expression (277 up- and 109 down regulated) between the control and r-RORDEP1-treated groups. Differential expression was determined using a threshold q-value < 0.05. Expression of the differential proteome was z-score transformed for data visualization. Panel a created with BioRender.com. Source data
Extended Data Fig. 10
Extended Data Fig. 10. Phosphoproteomics analysis of rat liver following intestinal infusion of recombinant RORDEP1.
(a) Twelve 8-week-old lean male Sprague-Dawley rats (six after r-RORDEP1 and six after infusion of phosphate buffered saline (PBS)) were included. r-RORDEP1 was infused into duodenum with a rate of 200 pmol/kg/min for three hours. The analysis involved profiling a total of 4,877 phosphoproteins. (b) Principal Component Analysis (PCA) plot displays the distribution of samples based on the phosphoryl proteome in the group treated with PBS (P_Control) and the group treated with r-RORDEP1 (P_RORDEP1). (c) Visualization of the number of significantly differential (log2 fold change (log2FC) > 1 and adjusted p < 0.05) phosphoryl proteins between the two groups; up- and down-regulated features were colored with red and blue, respectively. (d) Volcano plot visualizing the changed phosphoryl proteins in panel b; proteins involved in hepatic glucose- and lipid metabolism are labeled. (e) Differential pathway enrichment analysis showing that phosphorylation of PPAR pathway was activated following in vivo exposure to r-RORDEP1. Up- and down-regulated phosphoryl proteins are marked with red and blue boxes, respectively. For panels c and d, the significance was determined using two-sided Student’s t-test, with post hoc correction using the Benjamini-Hochberg method. Panel a created with BioRender.com. Source data

References

    1. Ley, R. E., Peterson, D. A. & Gordon, J. I. Ecological and evolutionary forces shaping microbial diversity in the human intestine. Cell124, 837–848 (2006). - PubMed
    1. Gilbert, J. A. et al. Current understanding of the human microbiome. Nat. Med.24, 392–400 (2018). - PMC - PubMed
    1. Fischbach, M. A. Microbiome: focus on causation and mechanism. Cell174, 785–790 (2018). - PMC - PubMed
    1. Sberro, H. et al. Large-scale analyses of human microbiomes reveal thousands of small, novel genes. Cell178, 1245–1259.e14 (2019). - PMC - PubMed
    1. Minot, S. et al. The human gut virome: inter-individual variation and dynamic response to diet. Genome Res.21, 1616–1625 (2011). - PMC - PubMed

LinkOut - more resources