. 2025 Aug;5(8):1548-1567.
doi: 10.1038/s43587-025-00927-w. Epub 2025 Jul 31.

Stress granule clearance mediated by V-ATPase-interacting protein NCOA7 mitigates ovarian aging

Affiliations

Stress granule clearance mediated by V-ATPase-interacting protein NCOA7 mitigates ovarian aging

Ting Dong et al. Nat Aging. 2025 Aug.

Abstract

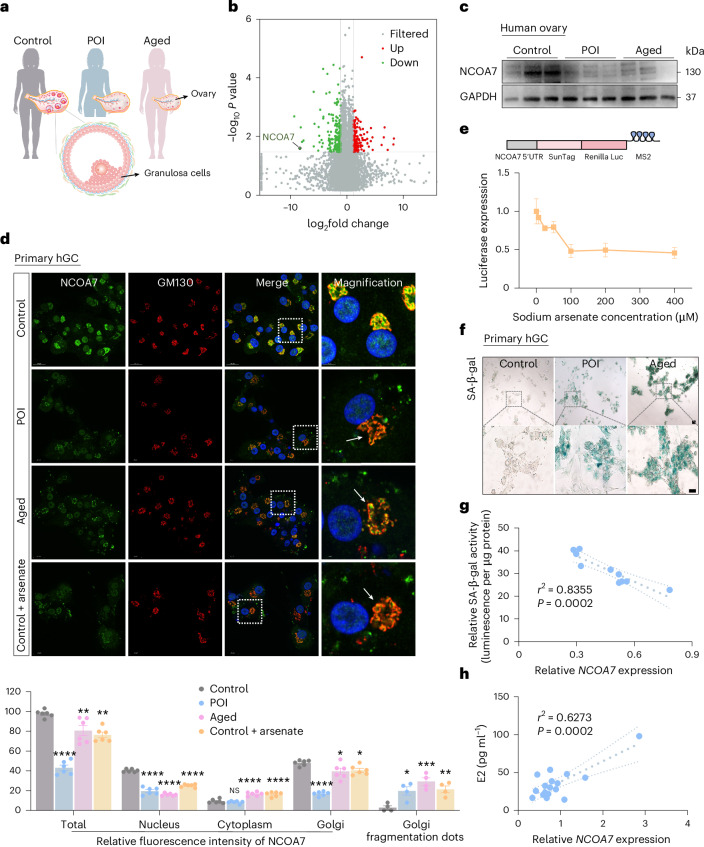
Reproductive longevity is essential for female fertility and healthy aging; however, the role of stress response, especially stress granule accumulation, in ovarian aging remains elusive and interventions are lacking. Here, we identified deleterious mutations and decreased expression of NCOA7, a stress-response protein related to granulosa cell senescence in women with physiological and pathological ovarian aging. NCOA7 deletion accelerates oxidative stress-related cellular senescence, ovarian aging and fecundity decline in mice. Mechanistically, NCOA7 partitions into the stress granule containing G3BP1-V-ATPase and facilitates autophagic degradation of stress granules to relieve stress. Boosting granulophagy with rapamycin or lipid nanoparticle-based mRNA delivery of NCOA7 accelerates stress granule clearance, alleviating cellular senescence in human granulosa cells and delaying ovarian aging in mice. This study depicts a mechanism for ovarian resilience to stress and provides potential targets for therapeutic strategies to alleviate ovarian aging.


Conflict of interest statement

Competing interests: The authors declare no competing interests.

Figures

Fig. 1
Fig. 1. NCOA7 variants identified in individuals with POI are associated with increased cellular senescence.
a, A schematic diagram showing the domain architecture of the NCOA7 protein and the position of variations identified in individuals with POI. b, Sanger sequencing showing the five NCOA7 heterozygous variants. c, Alignment of NCOA7 protein sequences across multiple mammals, highlighting the conserved amino acids at NCOA7 variants in the frame. d, Sequence analysis of the c.699+3A>G variant by minigene assay. Mut, mutation. e, Western blot of NCOA7 protein levels in wild-type (WT) and NCOA7 mutant (Mut) KGN cells. f, Predicted three-dimensional structures of the WT and mutant NCOA7 proteins. An enlarged view of the structural changes of the trimer-like region is shown in the lower left corner, with intervals between each subunit: WT (32.7 Å, 28.7 Å, 27.9 Å), p.A128T (43.0 Å, 47.9 Å, 42.8 Å), p.T146I (32.4 Å, 37.6 Å, 40.7 Å) and p.W804C (34.5 Å, 30.6 Å, 30.1 Å). g, CHX of WT and mutant NCOA7 proteins detected via an anti-Flag antibody in HEK293T cells. h, A schematic diagram showing the strategy for mocking human heterozygous mutations. i, SA-β-gal staining in WT and NCOA7 mutant KGN cells. Scale bar, 50 μm. j, The percentage of SA-β-gal-positive cells was quantified in WT and NCOA7 mutant KGN cells (n = 5 biological replicates for each group). P values (from left to right): *P = 0.0207, **P = 0.0029, ***P = 0.0004, ***P = 0.0006, ****P < 0.0001, ***P = 0.0002, **P = 0.0016, ***P = 0.0005, ****P < 0.0001. k, The expression levels of senescence markers p16INK4a and p21Cip1 were determined in WT and NCOA7 mutant KGN cells 48 h post-plasmid transfection using RT‒qPCR (n = 4 biological replicates for each group). Not significant (NS), P = 0.0555, *P = 0.0344, *P = 0.0218, *P = 0.0112, ***P = 0.0005, **P = 0.0068. l, E2 production was detected in the supernatants of WT and NCOA7 mutant KGN cells after a 48-h post-transfection period followed by additional 24-h incubation in a testosterone-containing medium (n = 5 biological replicates for each group). ****P < 0.0001, ****P < 0.0001, ***P = 0.0001. Data in jl are expressed as mean ± s.e.m. and compared by one-way analysis of variance (ANOVA) with Dunnett’s post hoc test. Source data
Fig. 2
Fig. 2. Decreased NCOA7 expression is associated with GC senescence in individuals with ovarian aging.
a, A schematic diagram showing GCs isolated from control, POI and middle-aged (>40 years old, before menopause) research participants. b, Volcano plot showing DEGs (|log2 fold change| >1.5 and two-sided edgeR-adjusted P < 0.05) in GCs between control participants and participants with POI. c, Western blot of NCOA7 protein levels in ovarian tissues from control, POI and middle-aged participants. d, Immunofluorescence analysis and quantification of NCOA7 and GM130 expression in primary GCs from control, POI and middle-aged participants, and arsenate-treated GCs from control participants (n = 6 biological replicates for quantifying relative fluorescence intensity of NCOA7 and n = 4 biological replicates for quantifying Golgi fragmentation dots). For fluorescence intensity analysis of NCOA7, ‘Golgi’ refers to the region located within the Golgi apparatus and ‘cytoplasm’ denotes the cellular compartments excluding the Golgi apparatus. Relative fluorescence intensities were calculated by normalizing to the total fluorescence intensity of cells in control group. Scale bars, 20 μm or 5 μm. P values (from left to right): ****P < 0.0001, **P = 0.0045, **P = 0.0005, ****P < 0.0001, ****P < 0.0001, ****P < 0.0001; NS, P = 0.7238; ****P < 0.0001, ****P < 0.0001, ****P < 0.0001, *P = 0.0170, *P = 0.0393, *P = 0.0136, ***P = 0.0005, **P = 0.0072. e, A schematic diagram showing the strategy for SunTag and assessing the expression of the NCOA7-SunTag reporter through luciferase assays in KGN cells carrying the NCOA7-SunTag reporter (n = 5 biological replicates per group). This assessment was conducted under varying concentrations of sodium arsenate. f, SA-β-gal staining of GCs from control, POI and middle-aged participants. Scale bars, 20 μm or 5 μm. g,h, The correlation of NCOA7 mRNA expression with SA-β-gal activity (g) (r2 = 0.8355, P = 0.0002, n = 10 biological replicates) or E2 levels (h) (r2 = 0.6273, P = 0.0002, n = 17 biological replicates) through Pearson correlation analysis. The dashed line indicates the 95% CI. Data in d,e are expressed as mean ± s.e.m. and compared by one-way ANOVA (with Dunnett’s post hoc test in d). Source data
Fig. 3
Fig. 3. Loss of NCOA7 accelerates cellular senescence and ovarian aging.
a, Schematic overview of in vitro and in vivo experimental designs. b, Validation of NCOA7 knockout efficiency in KGN cells via the CRISPR–Cas9 system. c,d, SA-β-gal staining and quantification (n = 5 biological replicates per group) in WT, NCOA7-KO and rescue KGN cells. Scale bar, 20 μm. P values (from left to right): ****P < 0.0001, ###P = 0.0006, ****P < 0.0001, ####P < 0.0001. e,f, RT‒qPCR analysis of p16INK4a and p21Cip1 (e) and SASP genes (f) in WT and NCOA7-KO KGN cells (n = 3 biological replicates per group). *P = 0.0186, **P = 0.0100 (e). **P = 0.0021, **P = 0.0085, *P = 0.0417, **P = 0.0029 (f). g, E2 levels in WT and NCOA7-KO KGN cells (n = 3 biological replicates per group). ***P = 0.0005. h, Cumulative litter size in WT and Ncoa7/ female mice up to 10 months old (n = 10 biological replicates per genotype). *P = 0.0303, *P = 0.0226, *P = 0.0156. i, Ovarian follicle counts in WT and Ncoa7/ mice at 10 months old (n = 6 biological replicates per group). NS, P = 0.1812; NS, P = 0.1010; NS, P = 0.5263; *P = 0.0254; *P = 0.0354. j, PSR staining of ovaries in 10-month-old WT and Ncoa7/ mice. Scale bar, 100 μm. k, SA-β-gal staining of GCs isolated from WT and Ncoa7/ mice. Scale bar, 20 μm. l, Ovarian follicle counts in 3-NP-treated WT and Ncoa7/ mice (n = 9 biological replicates per group). ***P = 0.0003, **P = 0.0025, **P = 0.0050, *P = 0.0328, ****P < 0.0001. m, Quantification of the SA-β-gal-positive area in ovaries from 3-NP-treated WT and Ncoa7/ mice (n = 5 biological replicates per group). *P = 0.0210. n, Immunohistochemical quantification of p16INK4a and p21Cip1 in ovaries from 3-NP-treated WT and Ncoa7/ mice (n = 3 biological replicates per group). ****P < 0.0001, *P = 0.0183. o, Serum levels of E2 and FSH in 3-NP-treated WT (E2: n = 14; FSH: n = 12 biological replicates) and Ncoa7/ mice (n = 15 biological replicates per group). **P = 0.0045, *P = 0.0407. Data in di and lo are expressed as mean ± s.e.m. and compared by two-tailed Student’s t-test. Source data
Fig. 4
Fig. 4. Interaction of NCOA7 with G3BP1 via the LysM and NTF2L domains enhances phase separation in vitro.
a, Protein–protein interaction network showing the NCOA7 interactome, including components of SGs and V-ATPase identified by IP–MS. b, Co-IP assays showing interactions of NCOA7, G3BP1 and ATP6V1A in HEK293T cells. c, Immunofluorescence showing colocalization of NCOA7, G3BP1 and ATP6V1A in KGN cells treated with arsenate or DMSO. Scale bar, 2 μm. d, Prediction analysis of the intrinsically disordered region of NCOA7 by IUPred (http://iupred.enzim.hu/). e, Time-lapse images of NCOA7 protein droplets that undergo rapid fusion (arrows). The time point of the first image is defined as 0 s. Scale bar, 20 μm. f, Differential interference contrast images showing droplets of NCOA7 (2 μM), G3BP1 (2 μM) and a mixture of NCOA7 (1 μM) and G3BP1 (1 μM). Scale bar, 20 μm. g, A schematic flowchart showing the protein isolation process and western blot detection of NCOA7 and G3BP1 levels in the corresponding supernatant (S) and pellet (P). h, Predicted three-dimensional structure showing the binding positions and interaction mode analysis of the NCOA7–G3BP1–V-ATPase complex. i, Co-IP validation of the interaction between NCOA7 and G3BP1 with different domain deletions. Source data
Fig. 5
Fig. 5. NCOA7 promotes SG clearance via autophagy after stress removal.
a, Immunofluorescence and quantification of SGs in GCs from control, POI and middle-aged participants (n = 15 views per group). Scale bar, 5 μm. P values (from left to right): ****P < 0.0001, ****P < 0.0001, ****P < 0.0001, ****P < 0.0001, ****P < 0.0001, ****P < 0.0001. b, Immunofluorescence of SGs (marked by G3BP1 and CAPRIN1) in WT, NCOA7-KO, NCOA7-rescued and NCOA7 domain-truncated KGN cells after treatment with arsenate and subsequent recovery for the indicated time periods. Scale bar, 5 μm. c, A His pulldown assay of NCOA7–Flag from arsenate-treated cells using His–LC3 proteins. d, Immunofluorescence and quantification of SGs in KGN cells treated with DMSO or chloroquine (CQ) (n = 16 views in quantification of stressed cells; n = 50 views per group in quantification of SGs per cell). Scale bar, 10 μm. ****P < 0.0001, **P = 0.0094. e, Immunofluorescence and quantification of SGs in ATG7-, ATG9A- and ATG13-knockdown KGN cells (n = 16, 16, 9 and 15 views, respectively in quantification of stressed cells; n = 33 views per group in quantification of SGs per cell). Scale bar, 10 μm. **P = 0.0065, **P = 0.0043, **P = 0.0045, ****P < 0.0001; NS, P = 0.1502; ****P < 0.0001. Data in a,d,e are expressed as mean ± s.e.m. and a one-way ANOVA with Dunnett’s post hoc test (a,e) and a two-tailed Student’s t-test (d) were used for group comparisons. Source data
Fig. 6
Fig. 6. Increasing autophagy alleviates NCOA7 deficiency-related GC senescence and ovarian aging.
a, Schematic diagram of in vitro (NCOA7-KO or mutant KGN cells) and in vivo (Ncoa7/ mice) experimental designs. b,c, Quantification of cell proliferation (b) (n = 3 biological replicates per group) and SA-β-gal-positive cells (c) (n = 5 biological replicates per group) in WT and NCOA7-KO KGN cells treated with DMSO or rapamycin (Rapa). NS, P = 0.1641; **P = 0.0011 (b). ***P = 0.0004, **P = 0.0067 (c). d,e, Quantification of senescence marker genes (d) (n = 3 biological replicates per group) and SASP genes (e) (n = 3 biological replicates per group) in WT and NCOA7-KO KGN cells treated with DMSO or rapamycin. NS, P = 0.5614; **P = 0.0031;, NS, P = 0.5241; **P = 0.0022 (d). NS, P = 0.7822; NS, P = 0.9464; NS, P = 0.5710; NS, P = 0.3430; *P = 0.0198; *P = 0.0176; *P = 0.0412; *P = 0.0375 (e). f, Ovarian follicle counts in 3-NP-treated WT and Ncoa7/ mice with DMSO or rapamycin pre-treatments (n = 4 biological replicates per group). NS, P = 0.1730; **P = 0.0054; NS, P = 0.4121; NS, P = 0.1052; NS, P = 0.1076; NS, P = 0.1709; NS, P = 0.1653; NS, P = 0.8376; NS, P = 0.6586; *P = 0.0176. g, PSR staining and quantification of the PSR-positive area in 3-NP-treated WT and Ncoa7/ mice with DMSO or rapamycin pre-treatments (n = 6 biological replicates per group). Scale bar, 100 μm. **P = 0.0013, ***P = 0.0003. h, Quantification of the SA-β-gal-positive area in ovaries from 3-NP-treated WT and Ncoa7/ mice with DMSO or rapamycin pre-treatments (n = 3 biological replicates per group). NS, P = 0.1352; **P = 0.0013. i, Quantification of optical density (OD) of immunohistochemical staining for senescence markers (p16INK4a and p21Cip1) in ovaries from 3-NP-treated WT and Ncoa7/ mice with DMSO or rapamycin pretreatments (n = 3 biological replicates per group). NS, P = 0.1750; ***P = 0.0006; NS, P = 0.9798, ****P < 0.0001. Data in bi are expressed as mean ± s.e.m. and compared by two-tailed Student’s t-test. Source data
Fig. 7
Fig. 7. Clinical alleviation of ovarian aging by promoting autophagy or targeting NCOA7 to attenuate GC senescence.
a,b, Immunofluorescence (a) and quantification (b) of SGs (n = 5 biological replicates per group) in GCs from control, POI and middle-aged participants treated with DMSO or rapamycin. Scale bars, 20 μm or 5 μm. P values (from left to right): ***P = 0.0001, ***P = 0.0005, ***P = 0.0007, ***P = 0.0006. c, Quantification of SA-β-gal-positive cells in GCs from POI (n = 5 biological replicates) and middle-aged (n = 4 biological replicates) participants treated with DMSO or rapamycin. ****P < 0.0001, ****P < 0.0001, **P = 0.0061, ****P < 0.0001. d, Expression levels of senescence markers (p16INK4a and p21Cip1) in GCs from control, POI and middle-aged participants treated with DMSO or rapamycin (n = 4 biological replicates per group). NS, P = 0.8945; **P = 0.0059; *P = 0.0201; NS, P = 0.1368; **P = 0.0024; ****P < 0.0001. e, Analysis of E2 levels in the supernatant of GCs from control, POI and middle-aged participants treated with DMSO or rapamycin (n = 4 biological replicates per group). *P = 0.0494, ****P < 0.0001, **P = 0.0013. f, Quantification of SGs in GCs from control, POI and middle-aged participants treated with scrambled mRNA-LNPs or N7 mRNA-LNPs (n = 5 biological replicates per group). NS, P = 0.6915; **P = 0.0004; *P = 0.0132; NS, P = 0.3466; *P = 0.0104; *P = 0.0143. g, Quantification of expression levels of senescence markers (p16INK4a and p21Cip1) in GCs from control, POI and middle-aged participants treated with scrambled mRNA-LNPs or N7 mRNA-LNPs (n = 4 biological replicates per group). NS, P = 0.7277; **P = 0.0047; ***P = 0.0006; NS, P = 0.9957; ***P = 0.0005; ***P = 0.0003. h, SA-β-gal staining and the percentage of SA-β-gal-positive cells in GCs from POI and middle-aged participants treated with scrambled mRNA-LNPs or N7 mRNA-LNPs (n = 5 biological replicates per group). Scale bar, 20 μm. ****P < 0.0001, ****P < 0.0001, *P = 0.0150, ***P = 0.0002. Data in bh are expressed as mean ± s.e.m. and compared by two-tailed Student’s t-test. Source data
Extended Data Fig. 1
Extended Data Fig. 1. NCOA7 mutants associated with GC senescence.
(a) Agarose gel electrophoresis of the WT and c.699+3 A > G mutant NCOA7 transcript. WT, wild-type; Mut, mutation. (b) RT‒qPCR results showing the mRNA levels of NCOA7 in KGN cells overexpressing the WT and different mutant NCOA7 vectors (n = 3 biological replicates per group). ****P < 0.0001, ns P > 0.9999, ns P = 0.9996, ns P = 0.6501, ns P = 0.9999, ns P = 0.9996. (c) Immunofluorescence images showing the localization of NCOA7 in KGN cells overexpressing the WT and different mutant NCOA7 vectors. Scale bar: 5 μm. (d) Quantification of cell proliferation in NCOA7-KO KGN cells overexpressing the WT or mutant vectors (n = 5 biological replicates per group). ****P < 0.0001, ****P < 0.0001. (e) Immunofluorescence images of p21Cip1 and SA-β-gal in NCOA7-KO KGN cells overexpressing the WT or mutant vectors. Scale bar: 10 μm. (f) RT‒qPCR analysis of expression levels of SASP genes (IL1B, IL8, MMP3, CCL2) in NCOA7-KO KGN cells overexpressing the WT or mutant vectors (n = 4 biological replicates per group). **P = 0.0071, ***P = 0.0001, **P = 0.0033, *P = 0.0152, ns P = 0.0801, **P = 0.0048, ****P < 0.0001, ***P = 0.0004, *P = 0.0245, ***P = 0.0006, ****P < 0.0001, **P = 0.0018. Data in b, d and f are expressed as means ± s.e.m and compared by one-way ANOVA with Dunnett’s post hoc test. Source data
Extended Data Fig. 2
Extended Data Fig. 2. GC senescence in patients with ovarian aging is associated with reduced NCOA7 expression.
(a) Representative KEGG pathways of DEGs in GCs between control and POI women (hypergeometric test, BH-adjusted FDR < 0.05). (b) Western blot of NCOA7 in primary hGCs from control and POI women. (c) RT‒qPCR analysis of NCOA7 mRNA in GCs between control and POI women (n = 10 biological replicates per group). ****P < 0.0001. (d) Western blot of NCOA7 in GCs between control and middle-aged participants (n = 3 biological replicates per group). (e) RT‒qPCR analysis of NCOA7 mRNA in various human embryonic tissues (22 weeks old) (n = 3 technical replicates per group). (f-g) Immunohistochemistry of NCOA7 protein in ovaries from human (f), as well as young (8-week-old) and old (10-month-old) mice (g). Red arrow: GC. Scale bar: 100 μm or 30 μm in f, 200 μm or 80 μm in g. (h) Western blot of NCOA7 protein levels in ovaries between young and old mice. (i) Immunofluorescence of NCOA7 and GM130 in primary human GCs and KGN cells. Scale bar: 20 μm or 5 μm. (j) Immunofluorescence and quantification of ROS in GCs from control, POI, and middle-aged patients (n = 20 views per group). Scale bar: 5 μm. ***P = 0.0005, **P = 0.0043. (k) CUT&Tag assay showing H3K27ac histone modification of the NCOA7 protein in GCs from control and POI women. (l) Quantification of SA-β-gal-positive cells in GCs from control, POI, and middle-aged patients in Fig. 2f (n = 5 biological replicates per group). *P = 0.0232, *P = 0.0156. (m‒n) Expression levels of p16INK4a and p21Cip1 (m) and SASP genes (n) in GCs from control, POI, and middle-aged patients (n = 4 biological replicates per group). ns P = 0.0728, **P = 0.0015, ns P = 0.0880, *P = 0.0137 in m. ns P = 0.1611, ***P = 0.0009, *P = 0.0210, ****P < 0.0001, ns P = 0.2057, ***P = 0.0003, *P = 0.0229, *P = 0.0172 in n. Data in c, e, j and l-n are expressed as means ± s.e.m. Two-tailed Student’s t-test was used in c, and One-way ANOVA with Dunnett’s post hoc test in j and l-n for group comparisons. Source data
Extended Data Fig. 3
Extended Data Fig. 3. NCOA7 deficiency accelerates cellular senescence and ovarian aging.
(a) Quantification of the apoptosis rate in WT and NCOA7-KO KGN cells (n = 5 biological replicates per group). ns P = 0.3981. (b) Quantification of cell proliferation in WT, NCOA7-KO, and NCOA7-rescued KGN cells (n = 5 biological replicates per group). Scale bar: 5 μm. The rescued group was compared with the KO group (#). ####P < 0.0001, ****P < 0.0001, ####P < 0.0001, ****P < 0.0001. (c) Quantification of IL-1β, IL-8, MMP3 and CCL2 in the supernatants of WT, NCOA7-KO, and NCOA7-rescued KGN cells (n = 5 biological replicates per group). The rescue group was compared with the KO group (#). *P = 0.0172, #P = 0.0206, *P = 0.0115, #P = 0.0279, **P = 0.0030, ##P = 0.0054, **P = 0.0025, #P = 0.0181. (d) Western blot of p16INK4a and p21Cip1 in WT, NCOA7-KO, and NCOA7-rescued KGN cells. (e) PCR genotyping of WT and Ncoa7/ mice. (f) Western blot of ovarian tissues to confirm absence of NCOA7 protein expression in Ncoa7/ mice. (g) The serum levels of E2 and FSH in 10-month-old WT and Ncoa7/ mice (n = 5 biological replicates per group). *P = 0.0224, *P = 0.0412. (h) The ovary index in 10-month-old WT and Ncoa7/ mice (n = 4 biological replicates per group). ns P = 0.6741. (i) Immunohistochemistry analysis of p16INK4a and p21Cip1 in ovaries of WT and Ncoa7/ mice (n = 3 biological replicates per group). Scale bar: 100 μm. *P = 0.0135, ***P = 0.0006. (j-k) Quantification of cell proliferation (n = 3 biological replicates per group) (j) and expression levels of SASP genes determined via RT‒qPCR (n = 4 biological replicates per group) (k) in GCs from WT and Ncoa7/ mice. ***P = 0.0010, ***P = 0.0003 in (r). ns P = 0.0661, **P = 0.0072, *P = 0.0241, *P = 0.0196 in (s). (l) Quantification of E2 production in the supernatants of GCs isolated from WT and Ncoa7/ mice (n = 4 biological replicates per group). *P = 0.0106. Data in a-c, g-h, and j-l are expressed as means ± s.e.m, and compared by two-tailed Student’s t-test. Source data
Extended Data Fig. 4
Extended Data Fig. 4. NCOA7 deficiency accelerates ovarian aging in mice.
(a) PCR genotyping of flox/flox and Ncoa7-cKO female mice. (b) Immunofluorescence of NCOA7 in ovaries of flox/flox and Ncoa7-cKO mice. Scale bar: 50 μm. (c) Western blot confirmed NCOA7 absence in GCs of Ncoa7-cKO mice. (d) Cumulative litter size in flox/flox and Ncoa7-cKO female mice up to 10-month-old (n = 7 biological replicates per genotype). *P = 0.0211, *P = 0.0104, **P = 0.0063. (e) Serum E2 and FSH levels in 10-month-old flox/flox and Ncoa7-cKO mice (n = 5 biological replicates per group). **P = 0.0042, *P = 0.0356. (f) Ovary index in 10-month-old flox/flox and Ncoa7-cKO mice (n = 10 biological replicates per group). ns P = 0.3992. (g) HE staining of ovarian sections from 10-month-old flox/flox and Ncoa7-cKO mice. Scale bar: 300 μm. (h) Ovarian follicle counts in flox/flox and Ncoa7-cKO mice at 10-month-old (n = 6 biological replicates per group). ns P = 0.2509, ns P = 0.0514, ns P = 0.2570, **P = 0.0010, *P = 0.0151. (i) PSR staining and quantification in 10-month-old flox/flox and Ncoa7-cKO mice. Scale bar: 100 μm. ****P < 0.0001. (j) Immunohistochemistry of p16INK4a and p21Cip1 in ovaries of flox/flox and Ncoa7-cKO mice. Scale bar: 100 μm. ****P < 0.0001, ***P = 0.0007. (k-m) SA-β-gal staining (k), cell proliferation (n = 3 biological replicates per group) (l) and SASP genes expression (n = 3 biological replicates per group) (m) in GCs from flox/flox and Ncoa7-cKO mice. Scale bar: 20 μm. *P = 0.0258 in l, *P = 0.0301, *P = 0.0299, **P = 0.0027, *P = 0.0366 in m. (n) E2 levels in GCs isolated from flox/flox and Ncoa7-cKO mice (n = 3 biological replicates per group), *P = 0.0058. (o) Ovary index of WT (n = 14 biological replicates) and Ncoa7/ mice (n = 9 biological replicates) treated with 3-NP. Scale bar: 100 μm. ns P = 0.2794. (p-r) PSR staining (p), SA-β-gal staining (q), and immunohistochemistry of p16INK4a and p21Cip1 (r) in ovaries from WT and Ncoa7/ mice treated with 3-NP. Scale bars: 100 μm. Data in d-f, h-j, and l-o are expressed as means ± s.e.m, and compared by two-tailed Student’s t-test. Source data
Extended Data Fig. 5
Extended Data Fig. 5. NCOA7 interacts with SG components.
(a) A FLAG-pulldown assay to identify NCOA7-binding proteins in KGN cells. Specific bands were identified via MS. (b-c) Co-IP validation of the binding of G3BP1, LARP1, CAPRIN1 (b) and ATP6V1 subunits (ATP6V1A, ATP6V1B2 and ATP6V1D) (c) to NCOA7 in HEK293T cells. (d-e) SA-β-gal staining (d) and western blot of senescence markers (p16INK4a and p21Cip1) (e) in WT, ATP6V1A- and ATP6V1B2-KO KGN cells. Scale bar: 20 μm. (f) Western blot of G3BP1 and NCOA7 within the isolated SG fractions. GM130 as a negative control. (g) Immunofluorescence images of HEK293T cells overexpressing NCOA7 or G3BP1 plasmids. Scale bar: 20 μm or 2 μm. (h) SDS‒PAGE analysis of samples collected during the purification process to confirm the validity of the purification. (i-j) Docking model showing the binding positions, interaction mode analysis and amino acid analysis at the binding surface of five subunits (ATP6A1, ATP6B2, ATP6C, ATP6E, and ATP6G) of V-ATPase and WT NCOA7 (i) or mutant NCOA7 (p.A128T) (j). (k) Amino acid analysis of the binding surface of G3BP1 and NCOA7. (l) Western blot of FLAG-NCOA7 (full-length or truncated versions) or HA-G3BPI (full-length or truncated version) overexpressed in HEK293T cells. The shown immunoblot was detected via an anti-Flag antibody or anti-HA antibody. (m) Co-IP validation of the interaction domains of NCOA7 and ATP6V1A. Source data
Extended Data Fig. 6
Extended Data Fig. 6. NCOA7 involved in autophagic clearance of SGs.
(a) Immunofluorescence of colocalization and Pearson’s correlation coefficient of G3BP1 and NCOA7 in GCs from control, POI, and middle-aged participants (n = 3 biological replicates per group). Scale bar: 5 μm or 1 μm. **P = 0.0056, **P = 0.0065, **P = 0.0045. (b) Immunofluorescence and quantification of SGs (marked by G3BP1 and CAPRIN1) in WT, NCOA7-KO, NCOA7-rescued, and NCOA7 LysM domain-truncated KGN cells (n = 5 biological replicates per group) under arsenate treatment and removal. Scale bar: 20 μm. The rescue group was compared with the KO1 group (#). ns P = 0.3037, ***P = 0.0003, ns P = 0.5806, ns P > 0.9999, ****P < 0.0001, ****P < 0.0001, ####P < 0.0001, ****P < 0.0001, ****P < 0.0001, ****P < 0.0001, ####P < 0.0001, ****P < 0.0001, ns P = 0.1256, ns P = 0.3448, #P = 0.0417, ns P = 0.2865, ****P < 0.0001, ****P < 0.0001, ####P < 0.0001, ****P < 0.0001, ****P < 0.0001, ****P < 0.0001, ####P < 0.0001, ****P < 0.0001. (c) Immunofluorescence and quantification of SGs in GCs from flox/flox and Ncoa7-cKO mice (n = 10 views per group). Scale bar: 5 μm. ns P = 0.6844, ****P < 0.0001, **P = 0.0025. (d) Immunofluorescence images of colocalization and Pearson’s correlation coefficient of G3BP1 and LAMP1 in KGN cells under arsenate treatment. Scale bar: 20 μm, 5 μm or 1 μm. (e) Western blot of G3BP1, NCOA7–FLAG and LC3II protein levels in various autophagosome fractions from KGN cells transfected with NCOA7–FlagLAG vector. GM130 as a negative control. (f) Western blot of LC3 and p62 protein levels in WT and NCOA7-KO KGN cells treated with or without CQ. (g) Western blot verifying the knockdown efficiency of ATG7, ATG9 and ATG13 in KGN cells. ***P = 0.0004, ***P = 0.0007, ***P = 0.0007. (h) Western blot of LC3 and p62 protein levels in ATG7-, ATG9A-, and ATG13-knockdown KGN cells. Data in a-c are expressed as means ± s.e.m. One-way ANOVA with Dunnett’s post hoc test was used in a-b, and two-tailed Student’s t-test in c for group comparisons. Source data
Extended Data Fig. 7
Extended Data Fig. 7. Increased autophagy alleviates NCOA7 deficiency-related GC senescence and ovarian aging both in vitro and in vivo.
(a) Western blot of LC3 and p62 protein levels in WT and NCOA7-KO KGN cells treated with DMSO or rapamycin. (b) SA-β-gal staining of WT, NCOA7-KO, and NCOA7-mutant KGN cells. Scale bar: 50 μm. (c) Immunofluorescence and quantitative analysis of G3BP1 and NCOA7 in WT and NCOA7-KO KGN cells (n = 5 biological replicates per group) treated with DMSO or rapamycin. Scale bar: 20 μm. **P = 0.0013, *P = 0.0173. (d) Immunofluorescence and quantitative analysis of SGs in ATG7-knockdown KGN cells (n = 10 views in quantification of stressed cells; n = 20 views per group in quantification of SGs per cell). Scale bar: 15 μm. ****P < 0.0001, ns P = 0.0738; ****P < 0.0001, ns P = 0.8588. (e) Quantification of cell proliferation of GCs from 3-NP-treated WT and Ncoa7/ mice treated with DMSO or rapamycin (n = 3 biological replicates per group). *P = 0.0351, *P = 0.0131. (f) Quantification of expression levels of SASP genes (Il1b, Il8, Mmp3 and Ccl2) via RT‒qPCR in GCs isolated from 3-NP-treated WT and Ncoa7/ mice treated with DMSO or rapamycin (n = 4 biological replicates per group). ns P = 0.8979, ns P = 0.7816, ns P = 0.3738, ns P = 0.6572, *P = 0.0376, *P = 0.0321, **P = 0.0070, **P = 0.0045. (g) Quantification of the ovary index in 3-NP-treated WT and Ncoa7/ mice treated with DMSO or rapamycin (n = 8 biological replicates per group). ns P = 0.2740, ns P = 0.0695. Data in c-g are expressed as means ± s.e.m, and compared by two-tailed Student’s t-test. Source data
Extended Data Fig. 8
Extended Data Fig. 8. Promoting autophagy or targeting NCOA7 attenuates clinical GC senescence.
(a) Schematic diagram showing the experimental design with rapamycin treatment in GCs from control, POI, and middle-aged participants. (b) Western blot of LC3 and p62 protein levels in GCs from control and POI women treated with DMSO or rapamycin. (c) Quantification of cell proliferation of GCs from POI and middle-aged participants treated with DMSO or rapamycin (n = 5 biological replicates per group). ****P < 0.0001, ****P < 0.0001, ****P < 0.0001, ****P < 0.0001. (d) Expression levels of SASP genes (IL1B, IL8, MMP3 and CCL2) via RT‒qPCR in GCs from control, POI, and middle-aged participants treated with DMSO or rapamycin (n = 4 biological replicates per group). ns P = 0.0995, ns P = 0.3605, ns P = 0.6335, ns P = 0.5805, *P = 0.0140, *P = 0.0285, **P = 0.0042, **P = 0.0083, **P = 0.0020, *P = 0.0205, *P = 0.0238, *P = 0.0120. (e) Schematic diagram showing the experimental design for N7 mRNA-LNP treatment in GCs from control, POI and middle-aged participants. (f) Western blot of NCOA7 protein levels in GCs from POI and middle-aged participants treated with scrambled mRNA-LNPs or N7 mRNA-LNPs. (g) Immunofluorescence of SGs in GCs from control, POI, and middle-aged participants treated with scrambled mRNA-LNPs or N7 mRNA-LNPs. Scale bar: 20 μm or 5 μm. (h) Quantification of cell proliferation of GCs from POI and middle-aged participants treated with scrambled mRNA-LNPs or N7 mRNA-LNPs (n = 5 biological replicates per group). ****P < 0.0001, ****P < 0.0001, *P = 0.0133, ****P < 0.0001. (i) Expression levels of SASP genes (IL1B, IL8, MMP8, CCL2) in GCs from control, POI and middle-aged participants treated with scrambled mRNA-LNPs or N7 mRNA-LNPs (n = 4 biological replicates per group). ns P = 0.1461, ns P = 0.9336, ns P = 0.3977, ns P = 0.8452, ***P = 0.0005, **P = 0.0069, ***P = 0.0003, **P = 0.0069, **P = 0.0010, *P = 0.0120, ***P = 0.0005, **P = 0.0067. Data in c-d and h-i are expressed as means ± s.e.m, and compared by two-tailed Student’s t-test. Source data

References

    1. Zhang, W., Qu, J., Liu, G. H. & Belmonte, J. C. I. The ageing epigenome and its rejuvenation. Nat. Rev. Mol. Cell Biol.21, 137–150 (2020). - PubMed
    1. Kroemer, G. et al. From geroscience to precision geromedicine: understanding and managing aging. Cell188, 2043–2062 (2025). - PMC - PubMed
    1. Jin, C. et al. Molecular and genetic insights into human ovarian aging from single-nuclei multi-omics analyses. Nat. Aging5, 275–290 (2025). - PMC - PubMed
    1. Laisk, T. et al. Demographic and evolutionary trends in ovarian function and aging. Hum. Reprod. Update25, 34–50 (2019). - PubMed
    1. Jiao, X., Ke, H., Qin, Y. & Chen, Z. J. Molecular genetics of premature ovarian insufficiency. Trends Endocrinol. Metab29, 795–807 (2018). - PubMed

MeSH terms

Substances