. 2025 Aug 1;16(1):7050.
doi: 10.1038/s41467-025-62453-y.

Regulation of airway fumarate by host and pathogen promotes Staphylococcus aureus pneumonia

Affiliations

Regulation of airway fumarate by host and pathogen promotes Staphylococcus aureus pneumonia

Ying-Tsun Chen et al. Nat Commun. .

Abstract

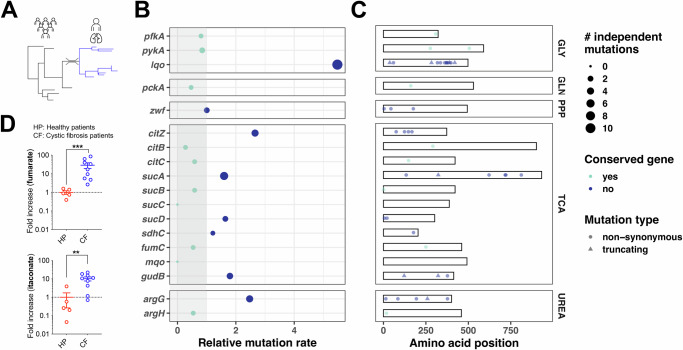
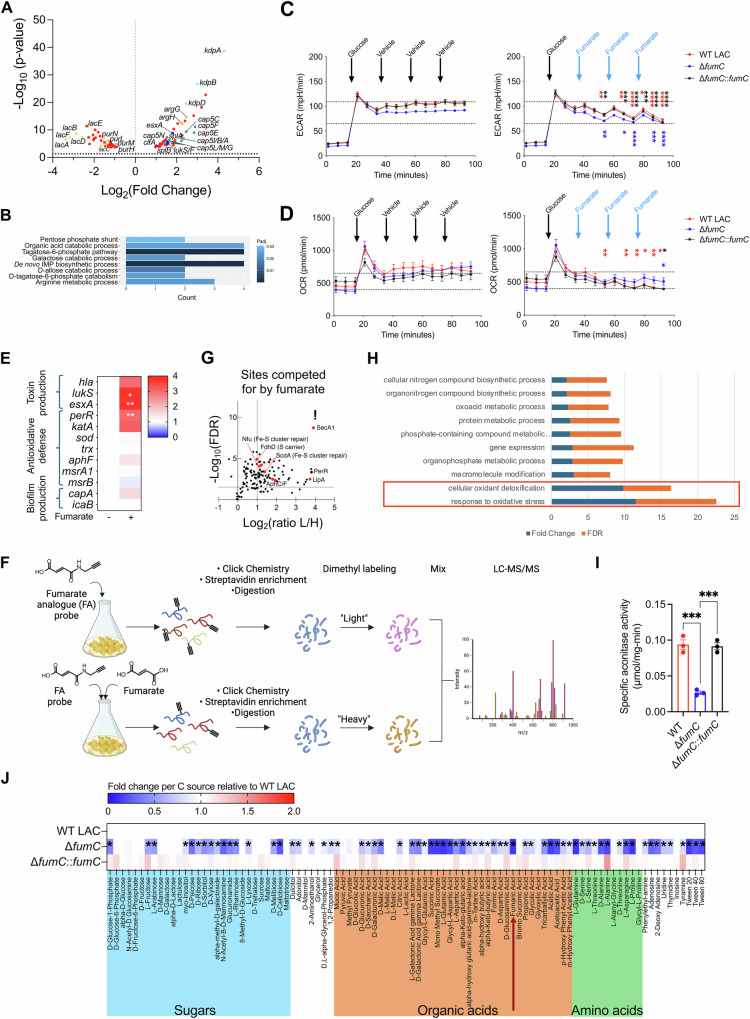
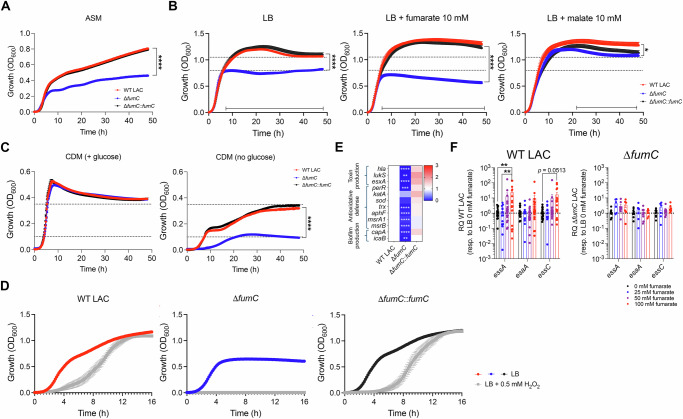
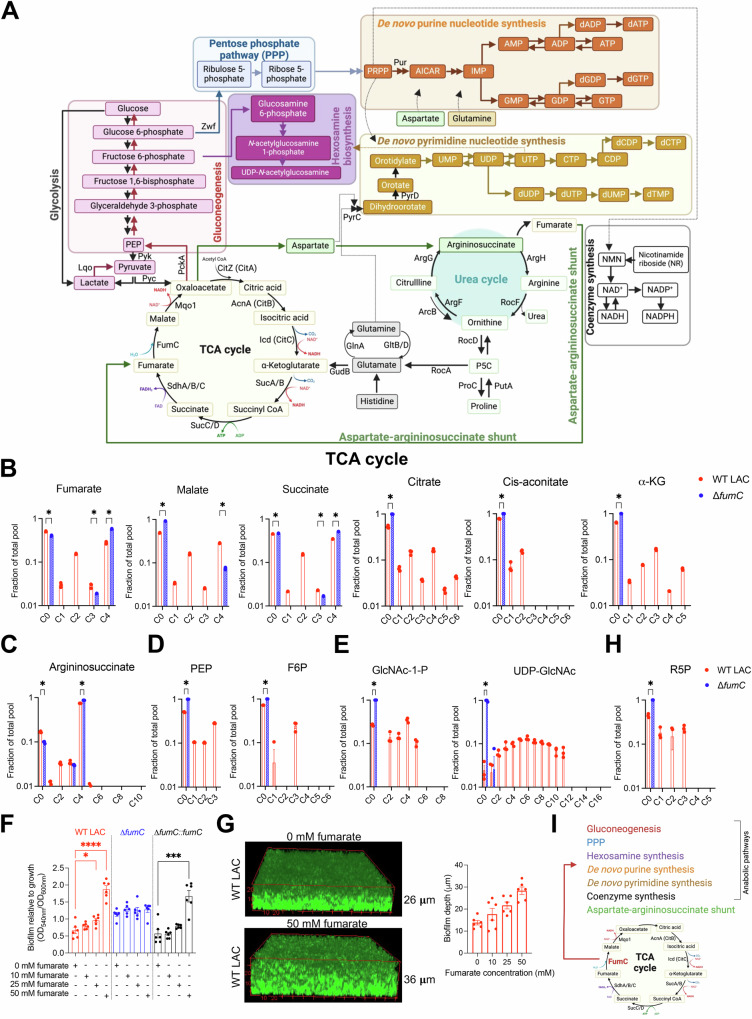
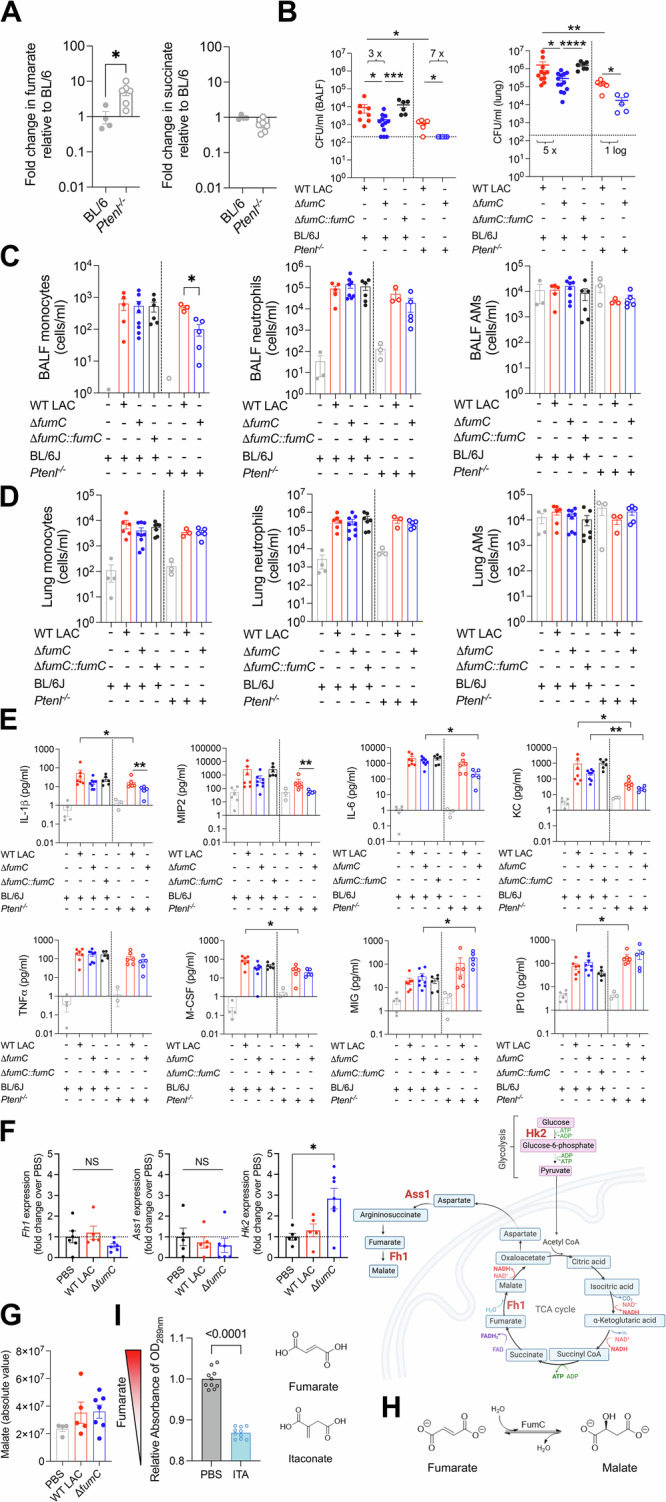
Staphylococcus aureus is a leading cause of healthcare-associated pneumonia, contributing significantly to morbidity and mortality worldwide. As a ubiquitous colonizer of the upper respiratory tract, S. aureus must undergo substantial metabolic adaptation to achieve persistent infection in the distinctive microenvironment of the lung. We observed that fumC, which encodes the enzyme that converts fumarate to malate, is highly conserved with low mutation rates in S. aureus isolates from chronic lung infections. Fumarate, a pro-inflammatory metabolite produced by macrophages during infection, is regulated by the host fumarate hydratase (FH) to limit inflammation. Here, we demonstrate that fumarate, which accumulates in the chronically infected lung, is detrimental to S. aureus, blocking primary metabolic pathways such as glycolysis and oxidative phosphorylation (OXPHOS). This creates a metabolic bottleneck that drives staphylococcal FH (FumC) activity for airway adaptation. FumC not only degrades fumarate but also directs its utilization into critical pathways including the tricarboxylic acid (TCA) cycle, gluconeogenesis and hexosamine synthesis to maintain metabolic fitness and form a protective biofilm. Itaconate, another abundant immunometabolite in the infected airway enhances FumC activity, in synergy with fumarate. In a mouse model of pneumonia, a ΔfumC mutant displays significant attenuation compared to its parent and complemented strains, particularly in fumarate- and itaconate-replete conditions. Our findings underscore the pivotal role of immunometabolites in promoting S. aureus pulmonary adaptation.


Conflict of interest statement

Competing interests: Robert Sebra is a consultant and equity holder for GeneDx and a founder and equity holder of Panacent Bio. All other authors declare no competing interests. Ethics approval: All collaborators, local and international, have made significant contributions to the study design, data collection, and analysis, and are listed as co-authors on this manuscript. This research was not restricted in the setting of the researchers and does not result in stigmatization or discrimination. Local and regional research relevant to our study was considered and included in citations.

Figures

Fig. 1
Fig. 1. S. aureus adapts to the metabolic airway milieu.
A Phylogenetic tree illustrating within-host evolution of S. aureus during persistent pulmonary infection (cystic fibrosis, blue clade). This model assumes genetic bottlenecks upon transmission and expansion of a single lineage during infection. Only mutations acquired within the host (i.e., blue branches) are considered in the analysis. B Output of the convergence analysis: the size of the dots is proportional to the number of independent (i.e., acquired de novo within the host) protein-altering mutations in genes of the TCA cycle and surrounding pathways. The relative mutation rate is equivalent to a rate ratio in Poisson models and calculated as: (mutations in gene x/length of gene x)/(mutations in all genes/length of all genes). A rate <1 (gray shading) indicates less mutations than the mean across the genome, suggesting that the gene is conserved during infection. GLY glycolysis, GLN gluconeogenesis, PPP pentose phosphate pathway, TCA tricarboxylic acid/Krebs cycle, UREA urea cycle. C Gene maps with position, type, and evolutionary niche of the de novo mutations. D Relative levels of fumarate and itaconate in sputum from healthy subjects (HS) and patients with cystic fibrosis (CF). Each data point is the mean ± SEM; n = 5 (HS) and n = 9 (CF). Statistical significance was determined using the Mann–Whitney U test (**p = 0.0040, ***p = 0.0010).
Fig. 2
Fig. 2. Fumarate imposes metabolic stress on S. aureus.
A Volcano plot showing significantly differentially expressed genes in WT LAC in the presence (100 mM) and absence of fumarate above the dotted line; n = 3 biological samples (1 experiment). Count-based differential expression analysis was performed using DESeq2. Gene expression was modeled using a negative binomial distribution with gene-specific dispersion estimates. Statistical testing was conducted on raw counts. Two-sided Wald tests were used for hypothesis testing, and p-values were adjusted for multiple comparisons using the Benjamini-Hochberg method to control the false discovery rate (FDR). B Pathway enrichment analysis of genes from (A) by Gene Ontology depicting significant differences in metabolic pathways in the presence and absence of fumarate. Gene set enrichment analysis (GSEA) was conducted in R with ‘fgsea’ using the Wald statistic to assign rank and using ‘msigdbr’ to query Gene Ontology reference gene sets at MSigDB (Broad Institute, MIT). P values were adjusted for multiple comparison using Benjamini-Hochberg method. C Glycolysis and D oxidative phosphorylation (OXPHOS) of S. aureus, as measured by the extracellular acidification rate (ECAR) and oxygen consumption rate (OCR) respectively, using the Seahorse extracellular flux analyzer. Glucose was injected, followed by three sequential additions of either the vehicle (left panel) or itaconate (right panel). Each data point is the mean ± SEM; n = 4 biological samples (4 independent experiments) with at least 3 technical replicates. The asterisks denote statistical differences at each time point between left and right panels by one-way ANOVA. C ECAR; p values at 53, 66, 73, 79, 86 and 92 min for WT LAC ± fumarate = 0.0052, 0.0020, <0.0001, 0.0401, <0.0001, <0.0001, the ΔfumC mutant ± fumarate = 0.0063, 0.0115, <0.0001, not significant, 0.0002, <0.0001 and the complemented strain ± fumarate = 0.0012, 0.0007, <0.0001, 0.0004, <0.0001, <0.0001 respectively. D OCR; p values at 53, 66, 73, 79, 86, and 92 min for WT LAC ± fumarate = 0.0086, 0.0046, 0.0044, 0.0127, 0.0071, 0.0162 respectively and 0.0433 and 0.0346 for the ΔfumC mutant and complemented strain ± fumarate at 92 min. E Heatmap illustrating variations in gene expression in WT LAC cultured with (10 mM) and without fumarate, as determined by qRT-PCR. The differences in gene expression are relative to WT LAC without fumarate. Statistical analysis was conducted using the Mann–Whitney non-parametric U test for each gene, with significance denoted as *p < 0.05 (p = 0.0170 for lukS) and **p < 0.01 (p = 0.0081 and 0.0047 for esxA and perR respectively). F Schematic diagram outlining the workflow for the chemoproteomic profiling of succinated S. aureus proteins by the fumarate analogue (FA) probe. Created in BioRender. Wong, T. (2025) https://BioRender.com/rkq0y88. G Volcano plot of the quantified FA-captured sites that are competed for by fumarate in live S. aureus FPR3757. The threshold for the −log10(q value/FDR) is set at 1.3; n = 3 biological samples (3 independent experiments) (H) Gene ontology analysis for the succinated sites from the in situ profiling. I AcnA/CitB activity in WT LAC, the ΔfumC mutant and complemented strain. Each data point is the mean ± SEM.; n = 3 biological samples (3 independent experiments) in triplicate. Statistical analysis was conducted by one-way ANOVA, p = 0.0002 when comparing the WT LAC or complemented strain to the ΔfumC mutant. J Carbon source assimilation of WT LAC, the ΔfumC mutant and complemented strain (PM1 Biolog; n = 3 biological replicates from 3 independent experiments). The color intensity in the heatmap corresponds to the absorbance of the bacterial strains (OD590nm) as a readout of bacterial respiration in the presence of the indicated carbon source, normalized to the absorbance (OD590nm) of WT LAC in the same carbon source. Asterisks denote statistically significant differences as determined by two-way ANOVA.
Fig. 3
Fig. 3. FumC promotes bacterial metabolic fitness, antioxidative defense and pathogenesis.
Growth curve of WT LAC, the ΔfumC mutant and complemented strain in (A) artificial sputum media (ASM) (n = 3 biological samples in triplicate for each strain), B Luria Bertani (LB) broth lacking glucose (left panel, n = 7 in triplicate for WT LAC and n = 6 in triplicate for the ΔfumC mutant and complemented strain) and supplemented with fumarate (middle panel, n = 5 in triplicate for each strain) or malate (right panel, n = 5 in triplicate for each strain) at a final concentration of 10 mM or C chemically defined media (CDM) supplemented with (left panel, n = 3 in duplicate) and without (right panel, n = 3, 1 technical replicate for each biological sample) glucose. For (AC), data are shown as mean ± SEM. Statistical analyses were conducted using the two-tailed t-student test with FDR correction, *p < 0.05, ****p < 0.0001 for (A, C) and two-way ANOVA for B. D Growth curve of WT LAC, the ΔfumC mutant and complemented strain in LB with and without hydrogen peroxide (H2O2) at a final concentration of 0.5 mM. Data are shown as mean ± SEM from n = 3 biological samples in triplicate for each strain in LB only and n = 3 biological samples in 2 technical replicates for each strain in LB + 0.5 mM H2O2. Statistical significance is determined by two-tailed t-student test with FDR correction. E Heatmap showing variations in gene expression in WT LAC, the ΔfumC mutant and complemented strain, as determined by qRT-PCR. The differences in gene expression are relative to WT LAC. Statistical analyses were conducted using the two-tailed t-student test with FDR correction for each gene, with significance denoted as **p < 0.01 (p = 0.0038 and 0.0067 for lukS and icaB respectively, ***p < 0.001 (p = 0.0006 for perR) and ****p < 0.0001 for hla, esxA, trx, aphF, msrA1, msrB, and capA between WT LAC and the ΔfumC mutant. F Expression of genes encoding the T7SS machinery by WT LAC (left panel) and the ΔfumC mutant (right panel) in the presence of increasing fumarate concentrations. The differences in gene expression are relative to WT LAC or the ΔfumC mutant grown in the absence of fumarate. Data for are shown as mean ± SEM from n = 9 (WT LAC + 0 mM fumarate, 9 biological samples in 2 technical replicates), n = 7 (WT LAC + 25 mM fumarate, 7 biological samples in 2 technical replicates), n = 10 (WT LAC + 50/100 mM fumarate, 10 biological samples in 2 technical replicates), n = 3 (ΔfumC mutant + 0/50 mM fumarate, 3 biological samples in 3 technical replicates), and n = 3 (ΔfumC mutant + 25/100 mM fumarate, 3 biological samples in 2 technical replicates). Statistical analyses were conducted using two-way ANOVA with a multiple posteriori comparison, p = 0.025 (for essA, difference between LB and LB + 100 mM fumarate) and 0.0040 (for essA, difference between LB + 25 mM fumarate and LB + 100 mM fumarate).
Fig. 4
Fig. 4. FumC serves as a metabolic hub and directs fumarate to major metabolic pathways.
A Schematic diagram depicting key metabolic pathways in S. aureus. 13C4-fumarate labeling of metabolites involved in the B TCA cycle or C aspartate-argininosccuinate shunt, D gluconeogenesis, E hexosamine synthesis and H PPP in WT LAC and the ΔfumC mutant. Adjusted p-values (corrected for multiple comparisons using the Benjamini, Krieger, and Yekutieli method) between WT LAC and the ΔfumC mutant are shown for the unlabeled compound (C0) and for labeled carbon isotopologues that account for at least 1% of the total metabolite pool in both groups. Adjusted p-values are as follows: for fumarate C0, C3, and C4 − 0.0012, 0.0072, and <0.0001 respectively; for malate C0 and C4 − 0.000002; for succinate C0, C3 and C4 < 0.000001, 0.000015, and 0.000002; for citrate C0 − 0.000043; for cis-aconitate C0 − 0.000002; for α-ketoglutarate C0 − 0.00000.7; for argininosuccinate C0 and C4 − 0.000039 and 0.000002; for PEP, F6P, GlcNAc-1-P and UDP-GlcNAc C0 < 0.000001 and for R5P C0 = 0.000024. F Biofilm formation by WT LAC, the ΔfumC mutant, and the complemented strain in LB broth (without glucose) with increasing concentrations of fumarate, as evaluated by crystal violet staining. The p-values for WT LAC at 0 mM versus 25 mM and 50 mM fumarate are 0.0245 and <0.0001, respectively. For the complemented strain, the p-value for 0 mM versus 50 mM fumarate is 0.0004. G Biofilm depth of WT LAC in the presence of increasing fumarate concentrations, measured using wheat germ agglutinin-Alexa Fluor 555 staining and confocal microscopy. For (BH), data are shown as mean ± SEM from n  =  3 biological replicates (1 independent experiment). Statistical significance is determined by two-tailed t-student test with FDR correction. I Diagram summarizing the anabolic pathways fueled by S. aureus FumC.
Fig. 5
Fig. 5. Host fumarate hydratase and S. aureus FumC both regulate fumarate and pathogenesis.
A Relative level of fumarate (left panel) and succinate (right panel) in the BALF of uninfected BL/6 and Ptenl−/− mice. Fumarate levels differed between BL/6 and Ptenl−/− mice, *p = 0.0190. B Bacterial burden from the BALF (left panel) and lung (right panel) of BL/6 and Ptenl−/− mice infected with WT LAC, the ΔfumC mutant and complemented strain; BL/6 infected with WT LAC (n = 11), ΔfumC mutant (n = 13), and ΔfumC::fumC (n = 7), Ptenl−/− infected with WT LAC (n = 6), ΔfumC mutant (n = 5). The above-mentioned total number of mice per group were from at least 2 independent experiments. The dotted line indicates the limit of detection. The bacterial load of WT LAC and the ΔfumC mutant differed significantly in the BALF and lung of BL/6 mice (p = 0.0009 and 0.0338, respectively) and Ptenl-/- mice (p = 0.0152 and 0.0173, respectively). Similarly, the burden of the ΔfumC mutant and complemented strain differed significantly in the BALF and lung of BL/6 mice (p = 0.0009 and <0.0001, respectively). WT LAC burden also differed between BL/6 and Ptenl−/− mice in the BALF (p = 0.0127) and lung (p = 0.0046). Innate immune cells (monocytes left panel, neutrophils middle panel and alveolar macrophages right panel) from the C BALF (*p = 0.0357) and D lungs of uninfected and infected mice from (A). E Cytokine measurements from the BALF of uninfected and infected mice from (A). Statistically significant differences were observed between groups in IL-1β (*p = 0.0472, **p = 0.0087), MIP2 (**p = 0.0087), IL-6 (*p = 0.0062), KC (*p = 0.0140, **p = 0.0016), M-CSF (*p = 0.0140), MIG (*p = 0.0062) and IP-10 (*p = 0.0350). F Expression of murine Fh1, Ass1 and Hk2 from uninfected and infected mouse lungs (n = 5 per condition) by qRT-PCR (left panel) and schematic diagram showing the metabolic reactions catalyzed by the encoded enzymes fumarate hydratase, argininosuccinate synthase and hexokinase (right panel). A statistically significant difference in Hk2 expression was observed in the lungs of uninfected (PBS) and ΔfumC-infected mice (p = 0.0480). G Absolute level of malate in the BALF of uninfected (PBS) BL/6 mice and mice infected with WT LAC or the ΔfumC mutant. H Schematic diagram of reaction catalyzed by FumC. I FumC activity assessed by the absorbance of fumarate (left panel). Fumarate was supplied as a substrate for FumC, preincubated with and without 1 mM itaconate (chemical structure, right panel). For (AG, I), data represent mean values ± SEM and statistical analyses were performed by Mann–Whitney non-parametric U test (two-tailed), *p < 0.05, **p < 0.01, ***p < 0.001 and ****p < 0.0001.

Similar articles

References

    1. Antimicrobial Resistance Collaborators Global burden of bacterial antimicrobial resistance in 2019: a systematic analysis. Lancet399, 629–655 (2022). - PMC - PubMed
    1. Hirabayashi, A. et al. Comparison of disease and economic burden between MRSA infection and MRSA colonization in a university hospital: a retrospective data integration study. Antimicrob. Resist. Infect. Control13, 27 (2024). - PMC - PubMed
    1. Rumpf, C., Lange, J., Schwartbeck, B. & Kahl, B. C. Staphylococcus aureus and cystic fibrosis-a close relationship. What Can We Learn from Sequencing Studies?. Pathogens10, 1177 (2021). - PMC - PubMed
    1. Singh, V., Upadhyay, P., Reddy, J. & Granger, J. SARS-CoV-2 respiratory co-infections: incidence of viral and bacterial co-pathogens. Int. J. Infect. Dis.105, 617–620 (2021). - PMC - PubMed
    1. Howden, B. P. et al. Staphylococcus aureus host interactions and adaptation. Nat. Rev. Microbiol.21, 380–395 (2023). - PMC - PubMed

MeSH terms

LinkOut - more resources