. 2025 Jul 31;15(1):26643.
doi: 10.1038/s41598-025-08649-0.

Integrated transcriptomic and functional modeling reveals AKT and mTOR synergy in colorectal cancer

Affiliations

Integrated transcriptomic and functional modeling reveals AKT and mTOR synergy in colorectal cancer

Marcin Duleba et al. Sci Rep. .

Abstract

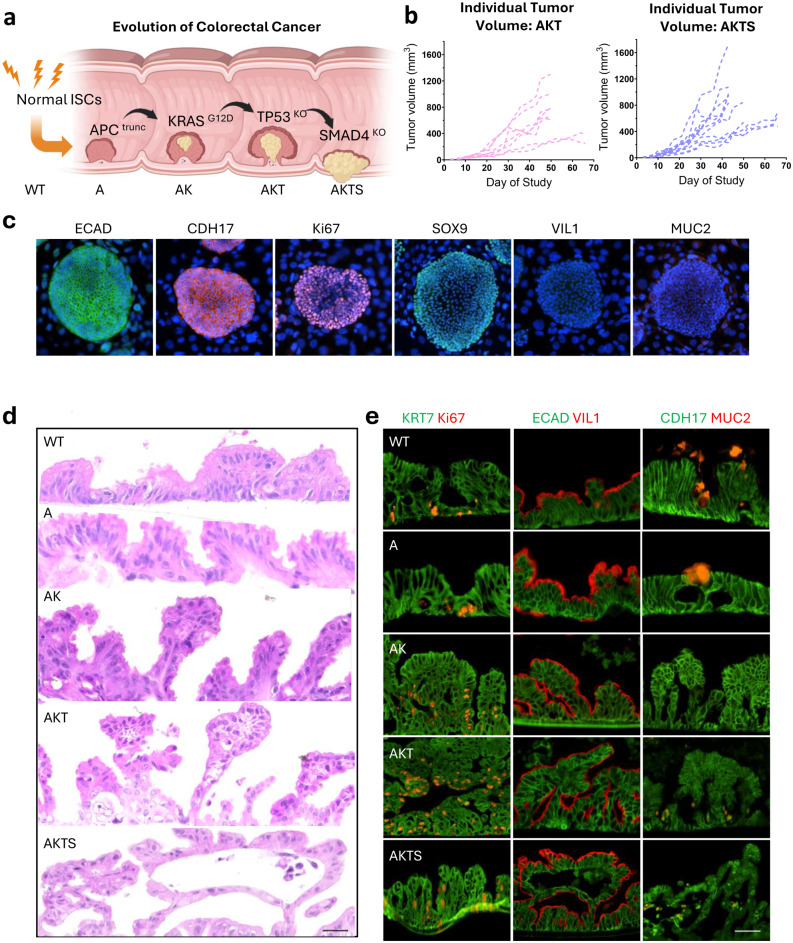
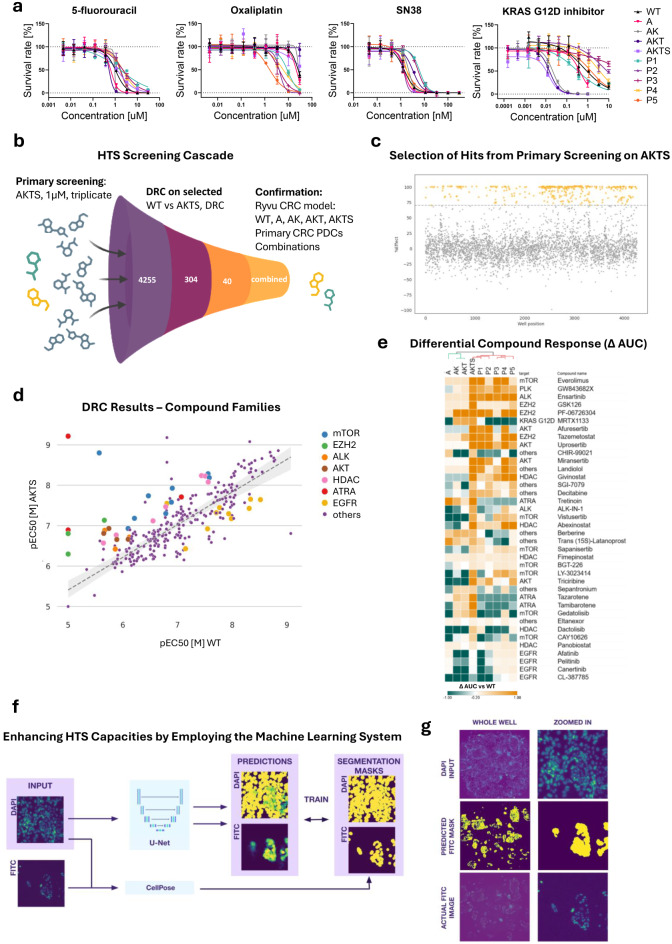
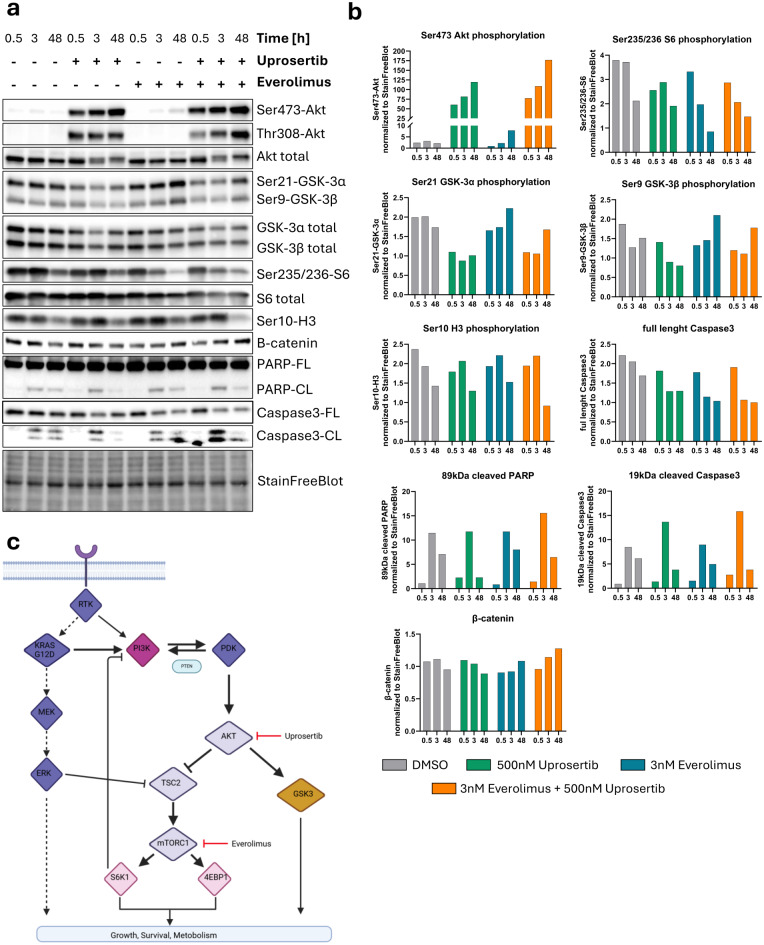
Colorectal cancer (CRC) treatment remains challenging due to genetic heterogeneity and resistance mechanisms. To address this, we developed a drug discovery pipeline using patient-derived primary CRC cultures with diverse genomic profiles. These cultures closely resemble certain molecular characteristics of primary and metastatic CRC, highlighting their promise as a translational platform for therapeutic evaluation. Importantly, our engineered model and patient-derived cells reflect the complexity and heterogeneity of primary tumors, not observed with standard immortalized cell lines, offering a more clinically relevant system, although further validation is needed. High-throughput screening (HTS) of 4255 compounds identified 33 with selective efficacy against CRC cells, sparing normal, healthy epithelial cells. Among the tested combinations, everolimus (mTOR inhibitor) and uprosertib (AKT inhibitor) demonstrated promising synergy at clinically relevant concentrations, with favorable therapeutic windows confirmed across tested patient-derived cultures. Notably, this synergy, revealed through advanced models, might have been overlooked in traditional immortalized cell lines, highlighting the translational advantage of patient-derived systems. Furthermore, the integration of machine learning into the HTS pipeline significantly improved scalability, cost-efficiency, and predictive accuracy. Our findings underscore the potential of patient-derived materials combined with machine learning-enhanced drug discovery to advance personalized therapies. Specifically, mTOR-AKT inhibition emerges as a promising strategy for CRC treatment, paving the way for more effective and targeted therapeutic approaches.


Conflict of interest statement

Declarations. Competing interests: MD, EZ, JS, MS, JS, OD, AK, IW, MC, BL, KS, JK, OB, ASW, KP, JD, KB, TR, AT, KB, AM are/were employees of Ryvu Therapeutics and some of the authors are shareholders in Ryvu Therapeutics. The other authors have no competing interests.

Figures

Fig. 1
Fig. 1
Stepwise Resistance to Niche Signaling Stimuli Drives Colorectal Cancer Progression. a Schematic representation of colorectal cancer (CRC) progression from normal intestinal epithelium, following the classic Vogelstein paradigm, which involves the stepwise accumulation of mutations in APC, KRAS, TP53 and SMAD4. Created with BioRender.com. b Growth curves of engineered CRC models (AKT and AKTS) after xenografting into immunocompromised mice, AKT n = 8; AKTS n = 11. c Representative immunostaining of normal intestinal stem cell (WT)-derived colonies used in model development. Intestinal lineage markers (green or red), and nuclei are counterstained with DAPI (blue). Scale bar, 50 μm. d Hematoxylin and eosin staining of sectioned air–liquid interface (ALI)-grown structures derived from successive stages of the engineered CRC model. Scale bar, 100 μm. e Immunofluorescence labeling of intestinal and proliferation markers (green or red) in ALI-derived structures at various stages of CRC progression. Scale bar, 100 μm.
Fig. 2
Fig. 2
Transcriptomic Characterization of the Engineered Model in the Context of Available CRC References. a Gene expression heatmap displaying the relative expression of 260 differentially expressed genes (DEGs) between normal intestinal epithelial stem cells (WT) and engineered CRC model cells (AKTS). b UMAP embedding of MOBER-derived transcriptomic data integrating engineered CRC models with publicly available CRC datasets. Two primary clusters were identified: Cluster 1, comprising metastatic CRC samples, primary tumors, and most CRC cell lines; and Cluster 2, which includes the engineered CRC models grouped with primary CRC tissues and a subset of metastatic samples. Insets (2A, 2B) highlight the clustering of healthy intestinal stem cells with public healthy tissue samples (2A) and the engineered CRC models with primary CRC tissues (2B). c Differential gene programs identified using ExpiMap overlaid on the clustered data from engineered CRC models and publicly available RNA-seq datasets. Gene programs were derived from GSEA collections, identifying pathways relevant to CRC progression and differentiation.
Fig. 3
Fig. 3
Application of CRC Model Cells in Drug Discovery Research and Machine Learning Methods for Analysis. a Dose–response curves showing the cytotoxic effects of standard-of-care drugs on healthy cells (WT), engineered CRC models (A, AK, AKT, AKTS), and patient-derived cultures (P1–P5). Error bars represent standard deviation, n = 3. b High-throughput screening (HTS) workflow of 4,255 compounds on AKTS cells, n = 3. Screening was performed at a fixed concentration of 1 μM. c Scatter plot showing hits from the primary screening on AKTS cells, with compounds achieving ≥ 70% inhibition selected for further validation. d Scatter plot comparing IC50 values of compound families between WT and AKTS cells. Selective responses in engineered CRC models highlight key drug target families, including mTOR, AKT and EZH2, n = 3. e Heatmap of differential compound responses (Δ AUC) across CRC models and healthy cells, revealing enrichment of inhibitors targeting key pathways, including mTOR, AKT, EZH2, and ALK. f Machine learning pipeline enhancing HTS capabilities: a U-Net-based neural network generates FITC segmentation masks from DAPI-stained images, replacing EdU assays for cell proliferation analysis. g Representative images demonstrating the machine learning model’s input (DAPI), predicted segmentation (FITC), and actual FITC results.
Fig. 4
Fig. 4
Synergistic Effects of mTORC1 and AKT Inhibition in CRC Models with KRAS Mutational Background. a Loewe synergy analysis of selected drug combinations in AKTS cells, ranked by mean Loewe synergy index, n = 3. Statistical significance is indicated by asterisks: *p < 0.05, **p < 0.01, ***p < 0.001. b Loewe synergy surface plot for the everolimus and uprosertib combination in AKTS cells, highlighting a strong synergistic interaction at clinically relevant concentrations (n = 3). The Loewe model yielded a mean synergy score of 10.5 (p = 1.32 × 10⁻3), indicating a statistically significant effect (**). c Median difference distribution of the everolimus and uprosertib combination across effective concentration ranges in engineered CRC models. The asterisk indicates the selected concentration point used for further visualizations. Generated using Python 3.10 script utilizing the Matplotlib 3.82 library. d Validation of the everolimus and uprosertib combination across evolutionary CRC models (A, AK, AKT, AKTS), patient-derived cultures (P1–5), and healthy control cells (WT). Synergistic responses were quantified using the Loewe Synergy Index (LSI), showing enhanced synergy in KRAS-mutant CRC models. Error bars represent standard deviation, n = 3. e Transcriptomic differences between responders (LSI > 20) and non-responders (LSI < 20) assessed using GSCORE-based pathway enrichment analysis. Dot size and y-axis position reflect pathway-level confidence (–ln[FDR]), while the x-axis (m/n ratio) indicates the proportion of differentially expressed genes within each enriched pathway.
Fig. 5
Fig. 5
Interruption of Feedback Loop Between AKT–mTORC1 Signaling is Detrimental for Colorectal Cancer. a Immunoblot analysis showing the effects of uprosertib (AKT inhibitor), everolimus (mTORC1 inhibitor), and their combination on AKT–mTORC1 signaling in CRC cells over various time points (0.5, 3, and 48 h). b Densitometric analysis of immunoblots. c Schematic representation of the AKT–mTORC1 signaling pathway and feedback regulation.
Fig. 6
Fig. 6
Schematic representation of the discovery platform designed to identify novel treatment strategies using patient-derived cells.

References

    1. Siegel, R. L., Miller, K. D., Fuchs, H. E. & Jemal, A. Cancer statistics. CA Cancer J. Clin/71(2021), 7–33. 10.3322/CAAC.21654 (2021). - PubMed
    1. Sung, H. et al. Global cancer statistics 2020: GLOBOCAN estimates of incidence and mortality worldwide for 36 cancers in 185 countries. CA Cancer J. Clin.71, 209–249. 10.3322/CAAC.21660 (2021). - PubMed
    1. Hong, Y., Kim, J., Choi, Y. J. & Kang, J. G. Clinical study of colorectal cancer operation: survival analysis. Korean J. Clin. Oncol.16, 3–8. 10.14216/KJCO.20002 (2020). - PMC - PubMed
    1. Vogelstein, B. et al. Cancer genome landscapes. Science340(2013), 1546–1558. 10.1126/SCIENCE.1235122/SUPPL_FILE/VOGELSTEIN.SM.COVER.PAGE.PDF (1979). - PMC - PubMed
    1. Guinney, J. et al. The consensus molecular subtypes of colorectal cancer. Nat. Med.21(11), 1350–1356. 10.1038/nm.3967 (2015). - PMC - PubMed

MeSH terms