. 2025 Jul 31;25(1):75.
doi: 10.1186/s12862-025-02416-5.

Local floral resources and edge density within the urban ecosystem promote larger and less variable body size in the great banded furrow bee, Halictus scabiosae

Affiliations

Local floral resources and edge density within the urban ecosystem promote larger and less variable body size in the great banded furrow bee, Halictus scabiosae

Lucie M Baltz et al. BMC Ecol Evol. .

Abstract

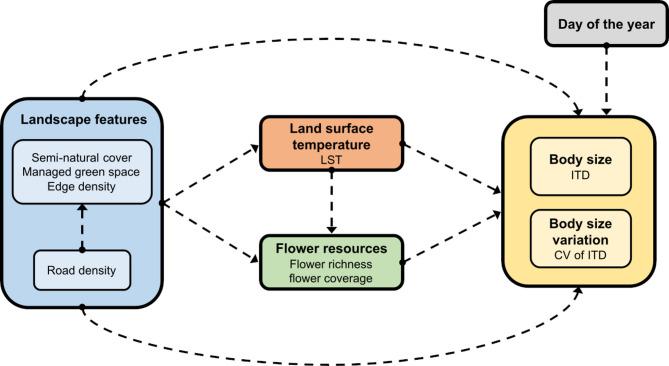
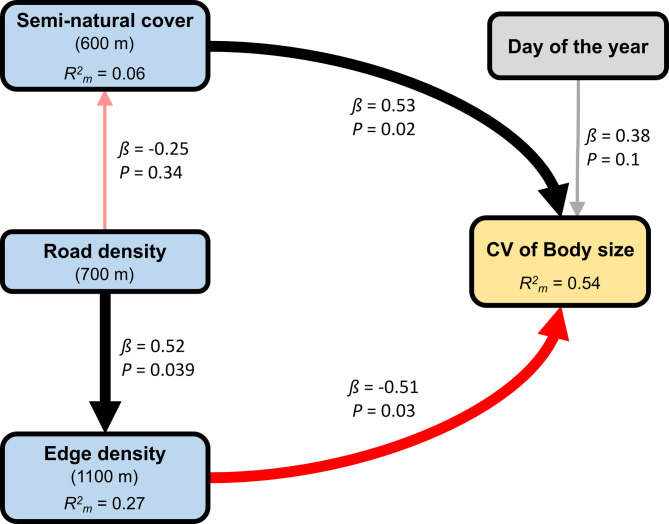
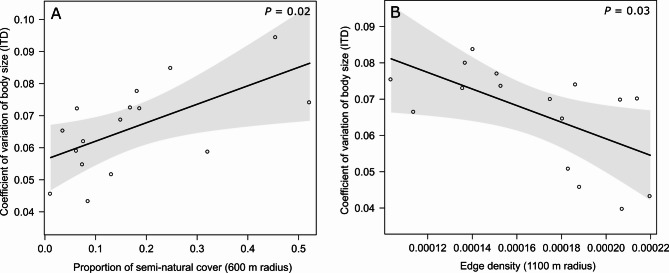
An organism’s body size is a fundamental trait linked to its metabolism, life-history and dispersal. In holometabolous insects, whose size is fixed at adult eclosion, body size can be influenced by environmental factors during development (e.g. nutrition and temperature), or by ecological filtering during adulthood. In bees, larger body size has been linked to advantages in foraging efficiency, thermoregulation, and survival, while excessive variation in body size within populations may indicate developmental instability. Shifts in adult body size have been associated with temperature changes, food resource availability and habitat fragmentation, all of which can be modulated by urbanisation. However, the relationship between urban landscapes and wild bee body size remains poorly understood. In this study we investigated how local floral (food) resources, landscape structure and temperature influence the body size of the great banded furrow bee, Halictus scabiosae. Our findings highlight that food resources, semi-natural cover and edge density are the most significant environmental factors influencing body size shifts. Specifically, H. scabiosae body size increased with the species richness of flowering host plants at the local patch level. Within sampling sites, body size variation was positively associated with semi-natural cover, suggesting that habitat structure or competition may contribute to size heterogeneity, potentially disrupting size uniformity. Conversely, it was negatively associated with edge density, indicating that a higher amount of ecotones may promote greater size uniformity within populations. Our findings reinforce the idea that enhancing floral resources and improving habitat connectivity through green corridors can support wild bee populations in urban areas.

Supplementary Information: The online version contains supplementary material available at 10.1186/s12862-025-02416-5.

Keywords: Cities; Edge density; Food resources; Host plants; Intertegular distance; Semi-natural cover; Urbanisation.


Conflict of interest statement

Declarations. Ethics approval and consent to participate: Collecting females of Halictus scabiosae does not require ethical approval. Consent for publication: All authors approved the text. Competing interests: The authors declare no competing interests.

Figures

Fig. 1
Fig. 1
Map of A Germany, where the black dot marks the city of Braunschweig, and B where the red dots mark the 16 sampling sites in the city of Braunschweig. The ochroid shading represents agricultural areas, the green shading represents semi-natural, forest, and urban green land uses, the grey shadings represent residential area and the black lines represent roads and railway tracks. The map was created with free vector map data licenced by OpenStreetMap Foundation (OSMF) under ODbL (https://opendatacommons.org/licenses/odbl/)
Fig. 2
Fig. 2
Conceptual directed acyclic graph (DAG) of all hypothesised links among road density and landscape features, temperature (land surface temperature, LST), flower resources, day of the year and body size (ITD in mm) and coefficient of variation of body size (CV of ITD). Road density is hypothesised to affect ITD and CV of ITD either directly or through effects on landscape heterogeneity, temperature and floral resources. Other landscape features (proportion of semi-natural cover, proportion of managed green spaces and edge density) are hypothesised to affect ITD and CV of ITD either directly or through effects on LST and floral resources. LST is hypothesised to affect ITD and CV of ITD either directly or through effects on flower resources. Flower resources and day of the year are hypothesised to affect ITD and CV of ITD directly
Fig. 3
Fig. 3
Directed acyclic graph (DAG) of the best piecewise SEM of the hypothesised indirect effect of road density (radius 1,000 m) on body size (ITD, mm) through semi-natural cover (radius 900 m), edge density (radius 1,300 m) and flower richness. The boxes show the measured variables. The red arrows show negative relationships, and the black arrows show positive relationships, as derived from the piecewise SEM analysis. Non-significant (P > 0.05) paths are semi-transparent. The thickness of the arrows represents the magnitude of the standardised regression coefficient. Standardised path coefficients and P-values are reported next to the arrows, and conditional (with all factors, R2c) and marginal (only fixed factors, R2m) R2 values are reported for all response variables
Fig. 4
Fig. 4
Relationships resulting from the piecewise SEM between A the proportion of semi-natural cover at the 900 m radius and road density at the 1,000 m radius, B edge density at the 1,300 m radius and road density at the 1,000 m radius, C main host flowering plant species richness of H. scabiosae and edge density at the 1,000 m radius, D H. scabiosae body size (ITD, mm) and its main host flowering plant species richness. Plotted lines show predicted relationships. Shaded areas show 95% confidence interval. P-values are given in the right, upper corner.
Fig. 5
Fig. 5
Directed acyclic graph (DAG) of the best piecewise SEM of the hypothesised indirect effects of road density (radius 700 m) on the coefficient of variance (CV) of body size through edge density (radius 1,100 m) and proportion of semi-natural cover (radius 600 m). The boxes show the measured variables. The red arrows show negative relationships, and the black arrows show positive relationships, as derived from the piecewise SEM analysis. Non-significant (P > 0.05) paths are semi-transparent. The thickness of the arrows represents the magnitude of the standardised regression coefficient. Standardised path coefficients and P-values are reported next to the arrows, and marginal R2 (only fixed factors, R2m) values are reported for all response variables
Fig. 6
Fig. 6
Relationships resulting from the piecewise SEM between A the coefficient of variation of body size (CV of ITD) of H. scabiosae and the proportion of semi-natural cover at the 600 m radius, B the coefficient of variation of body size (CV of ITD) and edge density at the 1,100 m radius. Plotted lines show predicted relationships. Shaded areas show 95% confidence interval. P-values are given in the right, upper corner

References

    1. Grimm NB, Faeth SH, Golubiewski NE, Redman CL, Wu J, Bai X, et al. Global change and the ecology of cities. Sci (80-). 2008;319:756–60. - PubMed
    1. Elmqvist T, Fragkias M, Goodness J, Güneralp B, Marcotullio PJ, McDonald RI, Parnell S, Schewenius M, Sendstad M, Seto KC, Wilkinson C. Urbanization, biodiversity and ecosystem services: challenges and opportunities: a global assessment. Springer Nature; 2013. 10.1007/978-94-007-7088-1.
    1. Theodorou P, Radzevičiūtė R, Lentendu G, Kahnt B, Husemann M, Bleidorn C, et al. Urban areas as hotspots for bees and pollination but not a panacea for all insects. Nat Commun. 2020;11:576. - PMC - PubMed
    1. Liang H, He Y, Theodorou P, Yang C. The effects of urbanization on pollinators and pollination: A meta-analysis. Ecol Lett. 2023;26:1629–42. - PubMed
    1. Huang K, Li X, Liu X, Seto KC. Projecting global urban land expansion and heat Island intensification through 2050. Environ Res Lett. 2019;14:114037.

LinkOut - more resources