

Optimal mean arterial pressure for favorable neurological outcomes in patients after cardiac arrest
- PMID: 40745346
- PMCID: PMC12315296
- DOI: 10.1186/s40560-025-00814-x
Optimal mean arterial pressure for favorable neurological outcomes in patients after cardiac arrest
Abstract
Background: Optimal mean arterial pressure (MAP) range after cardiac arrest remains uncertain. This study aimed to investigate the association between MAP and neurological outcomes during the early post-resuscitation period, with the goal of identifying optimal MAP range associated with favorable outcomes.
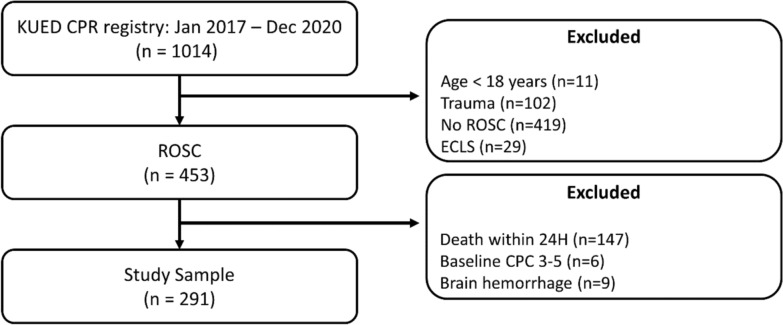
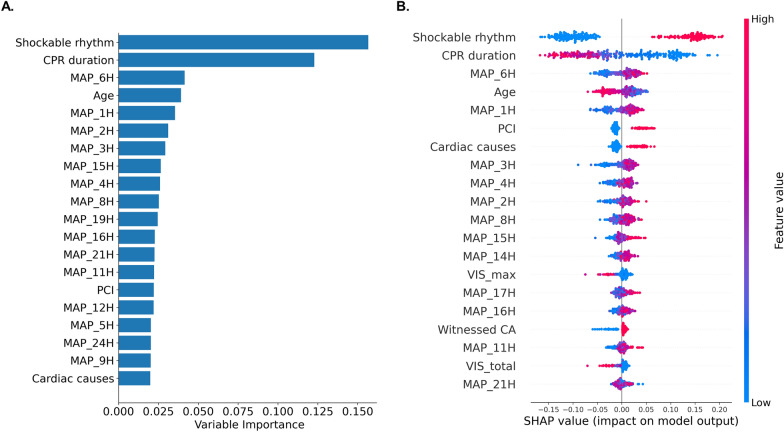
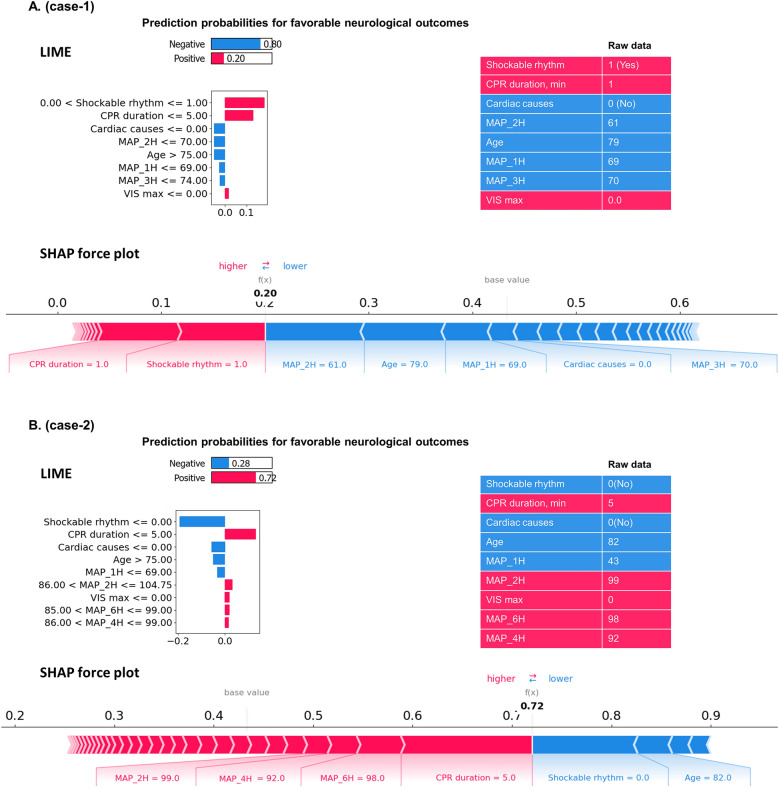
Methods: This retrospective observational study included 291 post-cardiac arrest patients treated at a tertiary care center. Five machine learning models to predict favorable neurological outcomes using hourly MAP measurements during the first 24 h after return of spontaneous circulation (ROSC) were compared and Random Forest model was selected due to its superior performance. Variable importance and Shapley Additive exPlanations (SHAP) were used to investigate the association between MAP and favorable neurological outcomes. SHAP dependence plots were used to identify optimal MAP ranges associated with favorable outcomes. In addition, individual-level predictions were interpreted using local interpretable model-agnostic explanations (LIME) and SHAP force plots.
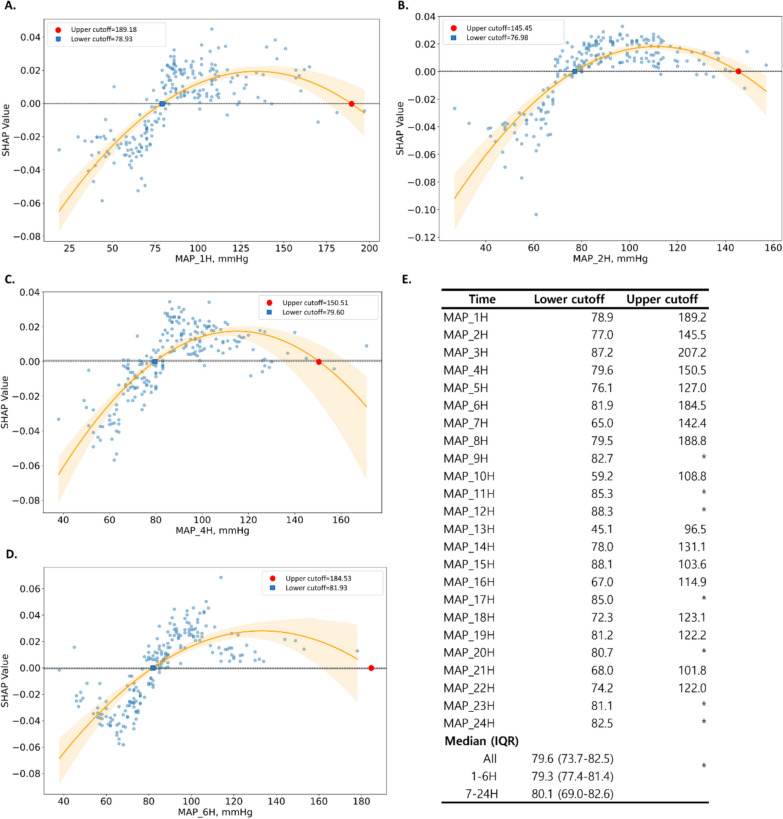
Results: Machine learning analysis showed that MAP were associated with favorable neurological outcomes, with higher variable importance during the first 6 h after ROSC. SHAP analysis revealed an inverted U-shaped relationship between MAP and favorable neurological outcomes, with an optimal threshold of 79.56 mmHg (IQR: 73.70-82.54). This threshold remained consistent across both early (1-6 h: 79.26 mmHg) and later (7-24 h: 80.09 mmHg) hours. Individual-level explanations using SHAP and LIME highlighted that maintaining higher MAP during the early post-resuscitation period contributed positively to outcome predictions.
Conclusions: Machine learning analysis identified MAP as a major predictor of favorable neurological outcomes, with higher variable importance during the first 6 h after ROSC. MAP showed an inverted U-shaped relationship with favorable neurological outcomes, with an optimal threshold of approximately 80 mmHg.
Keywords: Cardiac arrest; Explainable machine learning; Mean arterial pressure; Neurological outcomes; Post-cardiac arrest care.
© 2025. The Author(s).
Conflict of interest statement
Declarations. Ethical approval and consent to participate: The study protocol was approved by the Institutional review board of Anam Hospital (IRB No. 2023AN0104) and was conducted in accordance with the local legislation and institutional requirements. The requirement for obtaining informed consent was waived owing to the retrospective nature of the study. Consent for publication: Not applicable. Competing interests: The authors declare no competing interests.
Figures
Similar articles
-
Comparison of Two Modern Survival Prediction Tools, SORG-MLA and METSSS, in Patients With Symptomatic Long-bone Metastases Who Underwent Local Treatment With Surgery Followed by Radiotherapy and With Radiotherapy Alone.Clin Orthop Relat Res. 2024 Dec 1;482(12):2193-2208. doi: 10.1097/CORR.0000000000003185. Epub 2024 Jul 23. Clin Orthop Relat Res. 2024. PMID: 39051924
-
Does the Presence of Missing Data Affect the Performance of the SORG Machine-learning Algorithm for Patients With Spinal Metastasis? Development of an Internet Application Algorithm.Clin Orthop Relat Res. 2024 Jan 1;482(1):143-157. doi: 10.1097/CORR.0000000000002706. Epub 2023 Jun 12. Clin Orthop Relat Res. 2024. PMID: 37306629 Free PMC article.
-
Evaluating post-cardiac arrest blood pressure thresholds associated with neurologic outcome in children: Insights from the pediRES-Q database.Resuscitation. 2025 Feb;207:110468. doi: 10.1016/j.resuscitation.2024.110468. Epub 2024 Dec 18. Resuscitation. 2025. PMID: 39706470
-
Cardiac arrest centres for patients with non-traumatic cardiac arrest: A systematic review.Resuscitation. 2024 Oct;203:110387. doi: 10.1016/j.resuscitation.2024.110387. Epub 2024 Sep 4. Resuscitation. 2024. PMID: 39242018
-
Morphological, functional and neurological outcomes of craniectomy versus cranial vault remodeling for isolated nonsyndromic synostosis of the sagittal suture: a systematic review.JBI Database System Rev Implement Rep. 2015 Sep;13(9):309-68. doi: 10.11124/jbisrir-2015-2470. JBI Database System Rev Implement Rep. 2015. PMID: 26470674
References
-
- Berdowski J, Berg RA, Tijssen JG, Koster RW. Global incidences of out-of-hospital cardiac arrest and survival rates: systematic review of 67 prospective studies. Resuscitation. 2010;81:1479–87. - PubMed
-
- Lemiale V, Dumas F, Mongardon N, Giovanetti O, Charpentier J, Chiche J-D, et al. Intensive care unit mortality after cardiac arrest: the relative contribution of shock and brain injury in a large cohort. Intensive Care Med. 2013;39:1972–80. - PubMed
-
- Dragancea I, Rundgren M, Englund E, Friberg H, Cronberg T. The influence of induced hypothermia and delayed prognostication on the mode of death after cardiac arrest. Resuscitation. 2013;84:337–42. - PubMed
Grants and funding
LinkOut - more resources
Full Text Sources
Research Materials
