. 2025 Aug;16(4):e70002.
doi: 10.1002/jcsm.70002.

Exogenous Nucleotides Supplementation Attenuates Age-Related Sarcopenia

Affiliations

Exogenous Nucleotides Supplementation Attenuates Age-Related Sarcopenia

Xin Wu et al. J Cachexia Sarcopenia Muscle. 2025 Aug.

Abstract

Background: Sarcopenia, an age-related clinical syndrome characterized by reduced skeletal muscle mass and strength, often leads to a loss of physical function. Nucleotides (NTs) supplementation is a potential strategy for preventing age-related sarcopenia as evidence suggests that NTs declined in muscles with aging, and 5'-CMP, 5'-UMP can mitigate muscle atrophy in C2C12 myotubes. This study aimed to investigate the effects of NTs supplementation on sarcopenia and its possible mechanism.

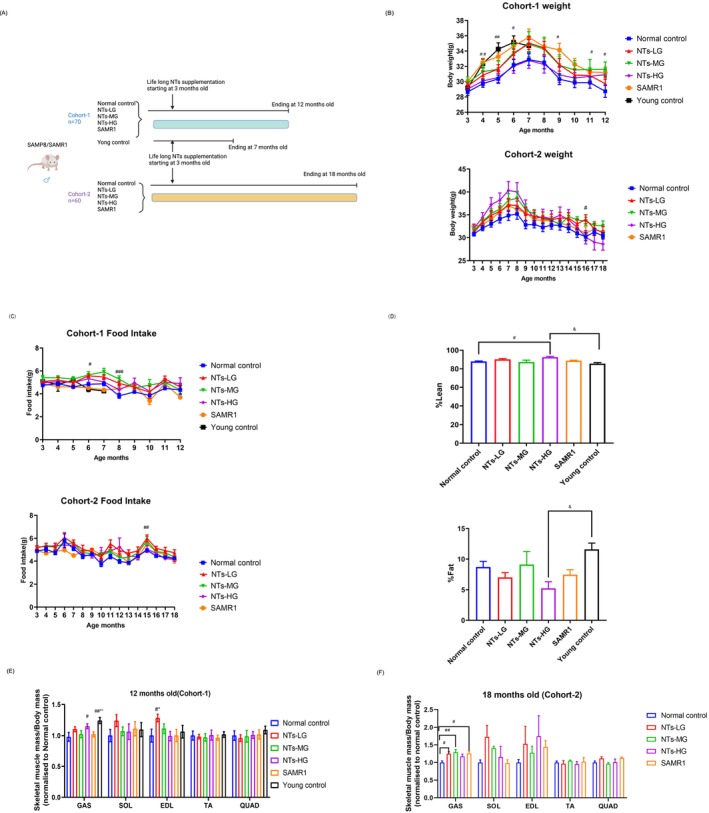
Methods: Senescence-accelerated mouse prone-8 (SAMP8) mice and C2C12 cells were used to assess the effect of NTs on sarcopenia. We fed an NTs-enriched mixture to SAMP8 mice starting from the age of 3 months for 9 months or 15 months. NTs' effects on H2O2-induced C2C12 atrophy cells were tested using nucleotide monomers and mixtures. The body composition was measured by EchoMRI analysis meter. Physical performance was tested including grip strength, wire hang, horizontal bar and gait test. The immunofluorescence staining was used to evaluate the cross-sectional area (CSA) or type of muscle fibers and the diameter of myotubes. RT-qPCR, western blot, RNA sequencing (RNA-seq) and targeted metabolomic analyses were conducted to elucidate the underlying mechanisms.

Results: The results demonstrated that NTs significantly increased lean mass/body weight (p < 0.01, η2 = 0.434), the grip strength at 7 (p < 0.0001, η2 = 0.312), 9 (p < 0.001, η2 = 0.293) and 11 (p < 0.0001, η2 = 0.507) months of age and the gait speed of mice (p < 0.0001, η2 = 0.3861). The immunofluorescence staining results indicated that NTs increased the CSA of muscle fibers (p < 0.0001, η2 = 0.1081), especially for type IIb fibres. The RNA-seq results showed that NTs significantly downregulated the expression of sarcopenia-related genes (Trim63, Dkk3 and Mt1). The downregulation of Fbxo32, Trim63, Dkk3, Mt1 and p53 genes in NTs intervention group was confirmed by RT-qPCR and/or western blot (p < 0.05). Integrated analyses of RNA-seq and metabolomic showed that NTs could cause changes in metabolites, such as ketoleucine, 3-hydroxylisovalerylcarnitine and 3-methyl-2-oxovaleric acid, which could further regulate sarcopenia-related genes and inhibit protein degradation and promote protein synthesis. In vitro studies confirmed that NTs increased myotubes diameter and decreased expression of sarcopenia-related genes.

Conclusions: Our findings reveal the protective role of NTs in improving muscle protein balance during ageing, suggesting they may serve as a conditionally essential nutrient for older individuals. Further research is needed to explore the efficacy and safety of NTs supplementation for sarcopenia in humans.

Keywords: FoxO; SAMP8 mice; ageing; muscle; sarcopenia.


Conflict of interest statement

The authors declare no conflicts of interest.

Figures

FIGURE 1
FIGURE 1
The dietary supplement of NTs delays age‐related muscle mass wasting in old and very old (geriatric) SAMP8 mice. (A) Experimental timeline. Mice were divided into two cohorts consisting of old and geriatric SAMP8 mice (n = 12, except the young control group n = 10) that were fed NTs for 9 and 15 months, respectively. (B) Body weight for mice receiving NTs intervention or control diet beginning at 3 months and ending until 12 months (Cohort 1; n = 12,except Young control group n = 10) or 18 months (Cohort 2; n = 12). (C) Food intake (g/day) of mice in the two cohorts. (D) Lean/body weight and fat/body weight in each group (n = 6). (E) Muscle mass for gastrocnemius (GAS), soleus (SOL), extensor digitorum longus (EDL), tibialis anterior (TA) and quadriceps (QUAD) was normalized to body mass and then to the normal control mice for the 12‐month‐old mice in cohort 1 (n = 6–10 mice per group). (F) Muscle mass for GAS, SOL, EDL, TA and QUAD was normalized to body mass and then to the normal control mice for the 18‐month‐old mice in cohort 2 (n = 3 mice per group). Error bars show SEM. Two‐way repeated‐measures ANOVAs with Sidak post hoc tests (B–C). One‐way ANOVAs with LSD or Dunnett's T3 (D–F). # p < 0.05, ## p < 0.01, ### p < 0.001. # p < 0.05 versus the normal control group, *p < 0.05 versus SAMR1, & p < 0.05 versus the young control group.
FIGURE 2
FIGURE 2
The dietary supplementation of NTs increases the cross‐sectional area (CSA) of myofibers. (A) Immunofluorescent staining images of muscle cross sections derived from gastrocnemius (GAS) of old mice in cohort 1. Green indicated laminin staining. Scale bars, 20 μm. (B) Percentage distribution of muscle fiber CSA (left) derived from GAS (400 < n < 500) and were based on three independent experiments, box plot representing the mean CSA (right) of muscle fibers. C‐D Effects of NTs on MyHC expression in geriatric mice from cohort 2 (n = 3). (C) Representative images and quantification of laminin (green), MyHC I (red), MyHC IIb (red) immunofluorescent staining in GAS (n = 3). (D) Percentage distribution of CSA for MyHC I and MyHC IIb muscle fibers  derived from GAS and the mean CSA of muscle fibers.
FIGURE 3
FIGURE 3
The dietary supplementation of NTs improves physical performance in old SAMP8 mice. (A) Grip strength test, (B,C) grid‐hanging capacity, (B) horizontal bar test, (C) wire hang test, (A–C, n = 10 mice per group in 11 months age), (D) movement track of 11‐month‐old mice in 5 min. (E) Mean speed (n = 10 mice per group in 11 months age). (F) mRNA expression of COL1A1, MyoD and TNF‐α (n = 6 mice per group). Expression is shown relative to that of the normal control group. Error bars show SEM. One‐way ANOVAs with LSD or Dunnett's T3. # p < 0.05, ## p < 0.01, ### p < 0.001. # p < 0.05 versus the normal control group, *p < 0.05 versus SAMR1, & p < 0.05 versus the young control group.
FIGURE 4
FIGURE 4
NTs protects age‐related muscle atrophy by inhibiting of Foxo,P53 and activating mTOR signalling pathways in SAMP8 mice. (A,B) Venn diagram of the overlap among significantly upregulated or downregulated genes in NTs‐LG, NTs‐MG, NTs‐HG, and the young control group compared with the normal control group and NTs‐LG, NTs‐MG, NTs‐HG and SAMR1 compared with the normal control group (|log2foldchange| > 1 and p < 0.05). (C) Heatmap of upregulated and downregulated Top10 genes in NTs‐LG versus the normal control group, NTs‐MG versus the normal control group, NTs‐HG versus the normal control group. (D) Volcano plot showing differentially expressed genes (DEG) in NTs‐LG, NTs‐MG and NTs‐HG, compared with the normal control group. (E) Tibialis anterior mRNA expression of genes involved in sarcopenia that were screened by RNA‐seq (n = 6 mice per group). Expression is shown relative to that of the normal control group. (F) Protein expression of genes where are in Foxo, Akt/mTOR and p53 pathways involved in sarcopenia (n = 3 mice per group). Error bars show SEM. One‐way ANOVAs with LSD or Dunnett's T3 (D‐G). # p < 0.05, ## p < 0.01, ### p < 0.001. # p < 0.05 versus the normal control group, *p < 0.05 versus SAMR1, & p < 0.05 versus the young control group.
FIGURE 5
FIGURE 5
NTs changed metabolomic profiles in the skeletal muscle of SAMP8 mice. (A) PLS‐DA score plot in NTs‐LG, NTs‐MG, NTs‐HG and the young control group versus the normal control group, respectively. PC1 and PC2 represent the scores of the first and second principal components, respectively. (B) Volcano plot showing differentially expressed metabolites in NTs‐LG, NTs‐MG, NTs‐HG and the young control group, compared with the normal control group. (C) Venn diagram of the overlap among significantly upregulated or downregulated differential metabolites in NTs‐LG, NTs‐MG, NTs‐HG and the young control group compared with the normal control group. (D) The enriched top 1–20 KEGG pathways sorted by p value based on the differential metabolites of NTs‐treated groups, the young control group versus the normal control group. The size of the point indicates the number of enriched metabolites (n = 6 mice per group).
FIGURE 6
FIGURE 6
Integrated analyses of RNA‐seq and Metabolomic in the skeletal muscle of SAMP8 mice. (A–C) Network analysis of differential metabolites and target genes in the NTs‐LG, NTs‐MG and NTs‐HG versus the normal control group, respectively. (D) Heatmap of common differential metabolites and target genes from the NTs‐LG versus normal control group and the young control group versus the normal control group and target genes. (E) Heatmap of common differential metabolites from the NTs‐MG versus the normal control group and the young control group versus the normal control group and target genes. (F) Heatmap of common differential metabolites from the NTs‐HG versus the normal control group and the young control group versus the normal control group and target genes (n = 6).
FIGURE 7
FIGURE 7
Schematic illustration summarizing the mechanisms by which NTs supplementation affects metabolites such as ketoleucine, 3‐Hydroxylisovalerylcarnitine, 3‐Methyl‐2‐oxovaleric_acid, downregulates Dkk3 and Mt1genes, further inhibits the Foxo signalling pathway, decreases Trim63 and Fbxo32 expression mainly and activates the mTOR/S6K pathway as well as inhibiting the p53 signalling pathway, thus reducing protein degradation, promoting muscle protein synthesis and improved sarcopenia.

References

    1. Cruz‐Jentoft A. J., Bahat G., Bauer J., et al., “Sarcopenia: Revised European Consensus on Definition and Diagnosis,” Age and Ageing 48 (2019): 16–31, 10.1093/ageing/afy169. - DOI - PMC - PubMed
    1. Morley J. E., von Haehling S., Anker S. D., and Vellas B., “From Sarcopenia to Frailty: A Road Less Traveled,” Journal of Cachexia, Sarcopenia and Muscle 5 (2014): 5–8, 10.1007/s13539-014-0132-3. - DOI - PMC - PubMed
    1. Robinson S. M., Reginster J. Y., Rizzoli R., et al., “Does Nutrition Play a Role in the Prevention and Management of Sarcopenia?,” Clinical Nutrition 37 (2018): 1121–1132, 10.1016/j.clnu.2017.08.016. - DOI - PMC - PubMed
    1. Damluji A. A., Alfaraidhy M., AlHajri N., et al., “Sarcopenia and Cardiovascular Diseases,” Circulation 147 (2023): 1534–1553, 10.1161/CIRCULATIONAHA.123.064071. - DOI - PMC - PubMed
    1. Sha Z., Zhao J., and Goldberg A. L., “Measuring the Overall Rate of Protein Breakdown in Cells and the Contributions of the Ubiquitin‐Proteasome and Autophagy‐Lysosomal Pathways,” Methods in Molecular Biology 1844 (2018): 261–276, 10.1007/978-1-4939-8706-1_17. - DOI - PMC - PubMed