. 2025 Jul 31;16(1):7037.
doi: 10.1038/s41467-025-62464-9.

A framework for complex signal processing via synthetic biological operational amplifiers

Affiliations

A framework for complex signal processing via synthetic biological operational amplifiers

Wenjun Cao et al. Nat Commun. .

Abstract

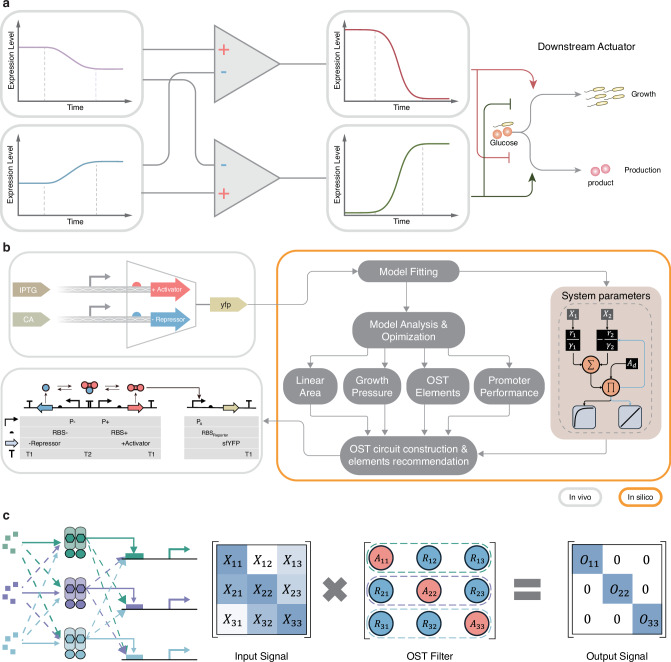
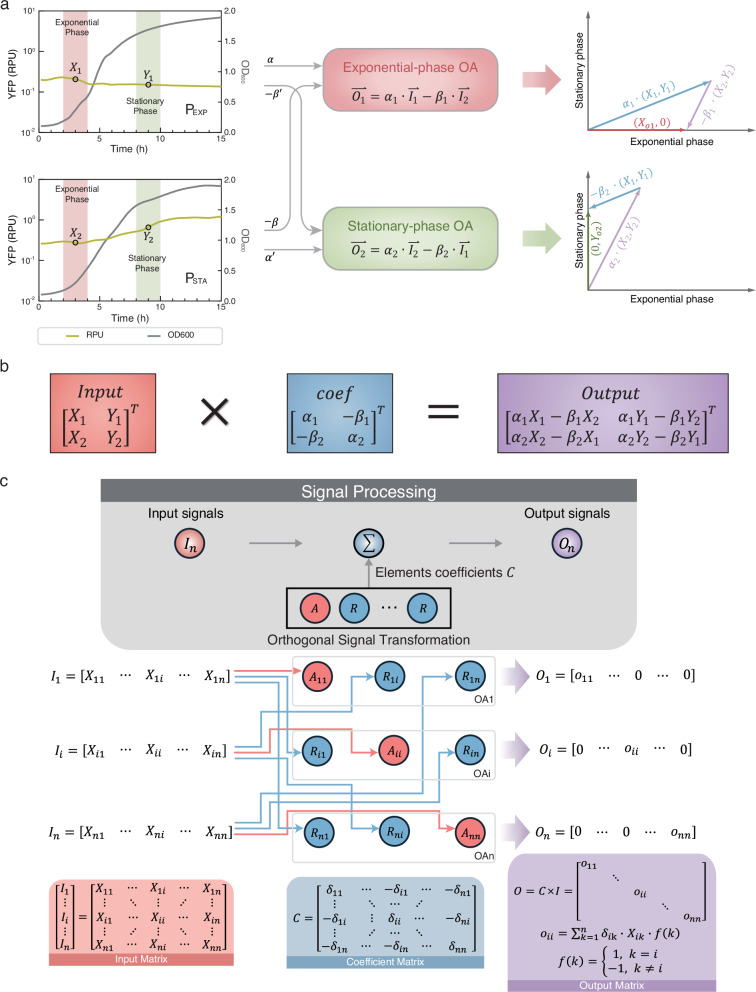
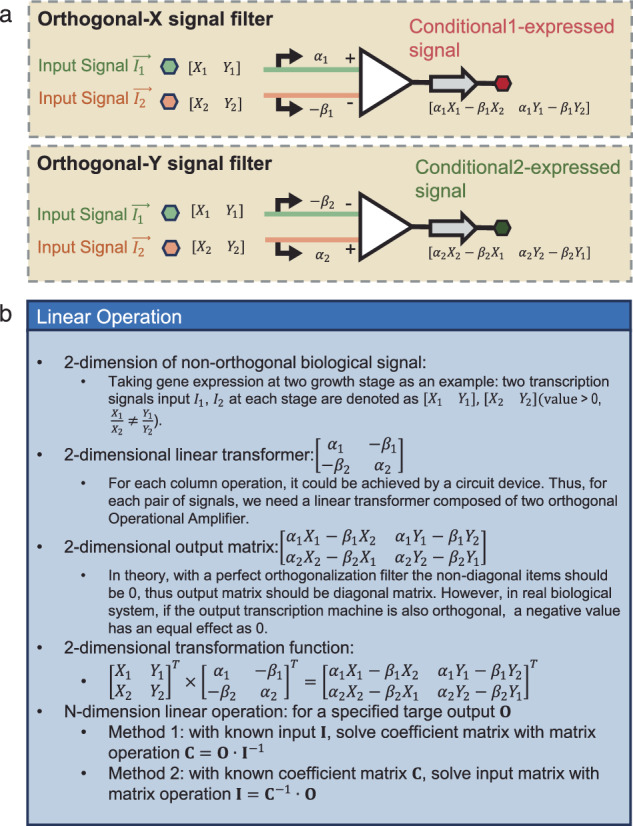
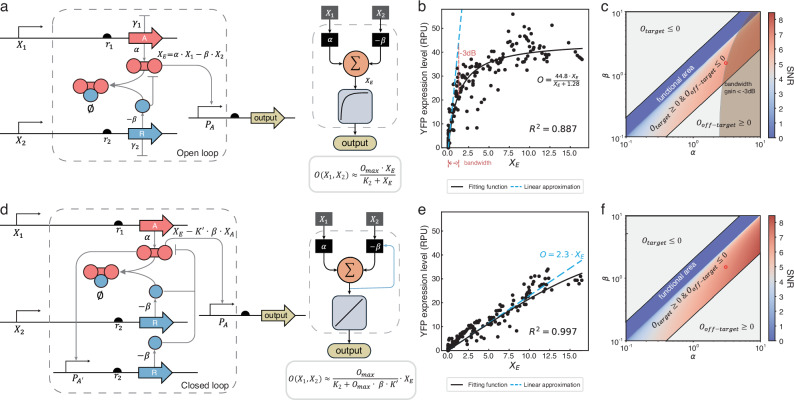
Engineering genetic circuits to process complex biological signals remains a significant challenge due to non-orthogonal signal responses that limit precise control. In this study, we introduce a framework that integrates orthogonal operational amplifiers (OAs) into standardized biological processes to enable efficient signal decomposition and amplification. By engineering σ/anti-σ pairs, varying ribosome binding site (RBS) strengths, and utilizing both open-loop and closed-loop configurations, we design scalable OAs that enhance the precision, adaptability, and signal-to-noise ratio of genetic circuits. Additionally, we present a prototype whole-cell biosensor capable of detecting transcriptional changes in response to growth conditions, enabling growth-state-responsive induction systems. These systems provide dynamic gene expression control without external inducers, offering significant advantages for metabolic engineering applications. We also apply our framework to mitigate crosstalk in multi-signal systems, ensuring independent control over each signal channel within complex biological networks. Our approach enhances synthetic biology systems by robust signal processing and precise dynamic regulation.


Conflict of interest statement

Competing interests: Y.C., L.L., and W.C. are listed as inventors on a patent application (CN202510595826.5, PCT/CN2025/093793) related to the synthetic OA circuits described in this study. The remaining authors declare no competing interests.

Figures

Fig. 1
Fig. 1. Overview of the operational amplifier-based signal processing framework.
a OA System Overview and Applications. The diagram illustrates the design and application of synthetic operational amplifiers (OAs) for biological signal processing. Each OA module processes two input signals and generates a linear output signal, which is used to control downstream actuators, such as growth regulation or production pathways. The OA circuit performs signal subtraction and amplification to produce precise, orthogonal outputs. The green and red circuits depict two distinct orthogonal outputs used for different biological processes, such as exponential-phase-specific growth and stationary-phase-specific production. b OA Design, Testing, and Optimization. Circuit Design: Each OA circuit consists of an activator (+) and a repressor (-), regulated by specific ribosome binding sites (RBSs) and controlled by IPTG or CA inducers. The outputs are linked to a reporter gene, such as YFP, for signal measurement. Modeling and Optimization: Experimental data are used to fit models, enabling the analysis and optimization of key system parameters, including linear response area, growth pressure, and promoter performance. This iterative process refines OA circuit performance and informs the selection of optimal components for orthogonal signal transformation (OST). Fine-tuning of promoter and RBS combinations further optimizes OA functionality, ensuring compatibility with input signals and enhancing output precision. c Multi-Dimensional Signal Processing via OST Circuits. Input Signal: The input signals, represented as a matrix (X), include various overlapping environmental signals or transcriptional activities. OST Filtering: The OST circuit applies a coefficient matrix to transform input signals into orthogonal components. This involves subtracting and scaling signals using OA modules configured with specific coefficients (A and R values). Output Signal: The resulting orthogonal output matrix (O) features only diagonal elements, ensuring independent, interference-free outputs suitable for precise regulation of multiple biological pathways.
Fig. 2
Fig. 2. Linear transformation of biological signal by OA.
a Orthogonal decomposition and linear transformation. The growth dynamics of an exponential-phase-specific promoter (PEXP) and a stationary-phase-specific promoter (PSTA) are shown, with RPU intensity (yellow) and OD600 (gray) plotted over time. The exponential phase (pink) and stationary phase (green) are highlighted. PEXP exhibits high expression during the exponential phase and low expression during the stationary phase, while PSTA shows the opposite trend. Promoters with these characteristics are classified as exponential-phase-specific or stationary-phase-specific promoters, respectively. The data correspond to experimental measurements of PS284 (PEXP) and PS190 (PSTA). Transformation through Exponential-phase OA maps input vectors to the X-axis (signals reflecting exclusive exponential-phase activity), while Stationary-phase OA maps input vectors to the Y-axis (signals reflecting exclusive stationary-phase activity). The curves show the mean value of 6 parallel experimental results. Source data are provided as a Source Data file. b Matrix operation format and transfer function. The OST performs linear transformations using matrix operations. Input vectors are mapped to output vectors according to coefficients α and β. For exponential-phase-specific signals, the output satisfy Xo0 and Yo0; for stationary-phase-specific signals, Xo0 and Yo0. This ensures strict condition-dependent outputs, achieving precise signal decomposition. c N-dimensional signal processing with an orthogonal OST. The OST framework extends to N-dimensional inputs, utilizing, for each input, one activator (A) and N1 repressors (R). Input signals are transformed by a coefficient matrix to produce an output matrix. When the output matrix is diagonal, the signals are orthogonal, representing independent biological responses specific to each input condition.
Fig. 3
Fig. 3. Orthogonal signal filter and generalized transformation logic.
a Illustration of orthogonal decomposition of two transcriptional input vectors under distinct physiological conditions using engineered operational amplifier (OA) filters. To isolate the transcriptional signal specific to condition 1, the Orthogonal-X filter applies a transformation using weights [α1,β1], yielding an output vector aligned along the X-axis and suppressing the Y-axis component (Y0). Conversely, the Orthogonal-Y filter with weights [α2,β2] extracts the signal corresponding to condition 2 by ensuring the X-axis output is minimized (X ≤ 0), producing a vector along the Y-axis. b Theoretical abstraction of the signal decomposition process and its generalization to N-dimensional transcriptional inputs. The OA computation is reformulated as a matrix operation that transforms a non-orthogonal input matrix into a diagonalized output. This formulation supports both forward calculation (output from known inputs and weights) and inverse computation (deriving the input or weight matrix from a desired output), enabling rational circuit design for signal decomposition in high-dimensional transcriptional spaces.
Fig. 4
Fig. 4. Performance of synthetic operational amplifier (OA) circuits.
ac Open-loop amplifier circuit. a The open-loop circuit design. Left: The genetic circuit construction. Right: The corresponding mathematical model. Input signals (X1,X2) regulate the production of activator (A) and repressor (R), respectively, each driven by specific RBSs. The effective activator concentration (XE) is computed within the OST device (gray box) and subsequently activates the output promoter (PA) to produce the final output (O). b Experimental validation of the open-loop circuit. The data points represent the measured values of X1 and X2, which are used to calculate effective activator concentration XE=3.06X11.51X2, with the corresponding output O plotted as a function of XE. The input-output relationship is fitted to the Hill function (solid black line). The first-order Taylor expansion of the Hill function (blue dashed line) approximates the linear region. The effective bandwidth (<3 dB) is indicated by gray dashed lines, confirming that the circuit operates linearly within XE (0, 1.2). c SNR heatmap for the open-loop circuit. Input signals: input1=PS284, input2=PS190. The non-functional area Otarget0 and Oofftarget0 is shown in white. Orange-shaded regions indicate suboptimal bandwidth (>3 dB). The red circle marks experimentally derived circuit parameters (3.06, 1.51). df Closed-loop amplifier circuit. d Closed-loop circuit design. An additional repressor regulated by PECF22M1 modifies the effective activator concentration to XE=XEKβXA. Left: schematic circuit design. Right: mathematical representation. e Experimental validation of the closed-loop circuit. Black data points represent measurements, fitted to the Hill function (solid black line) and first-order Taylor approximation (blue dashed line). The effective bandwidth expanded to XE (0, 36.6). f SNR heatmap for the closed-loop circuit. The functional area is significantly expanded compared to the open-loop configuration, demonstrating enhanced fidelity and robustness. The red circle indicates experimentally derived circuit parameters (3.06, 1.51). For data presented in (b, e), experiments were independently repeated on three separate days. Source data are provided as a Source Data file.
Fig. 5
Fig. 5. Functional circuit amplifier implementation.
a Analysis of native and synthetic promoters. Left: Volcano plot of native E. coli RNA-seq data. Promoters with SE ratio >1.5 (orange) or <0.67 (blue) were classified as stationary- or exponential-phase-specific, respectively. Selected promoters are labeled with their locus tag IDs. Differential expression was calculated using PyDESeq2 with a two-sided Wald test. Right: Sequence logos of stationary-phase (top) and exponential-phase (bottom) promoters highlight distinguishing motifs. b Promoter scoring for OA circuits. For each OA configuration, all possible promoter pairs were systematically evaluated as inputs to identify the pair with the highest OA score, representing the optimal performance achievable by that OA. Example: the best-performing combination for OAO(E11.2.2.PECF11) was NSP4 (a native stationary-phase promoter, A) and NEP7 (a native exponential-phase promoter, R). c Synthetic vs. native promoter performance. OA scores were simulated for all combinations of native and synthetic promoters using a fitted model. Each data point represents one promoter pair (n = 36 per group). The embedded box plots show the median (center line), the 25th and 75th percentiles (box bounds), and the minimum and maximum values excluding outliers (whiskers). d Fine-tuning of OA performance via RBS modification. The orange star represents the initial configuration of PS459 and PS394 with RBSs BCD2 and BCD2, which fell into a non-functional region (target output <0). By modifying the RBSs to BCD7 (activator) and BCD18 (repressor), shifting the OA configuration (α/β ratio) into the functional area (green star). e Functional circuits for EXP-ONs and STA-ONs. Input: Promoter activity under exponential (X) and stationary (Y) phases. Coefficient: OA parameters for signal processing. Prediction vs. Measurement: Modeled vs. experimental outputs (in RPU). STA-ON1 and STA-ON2 were constructed in both open- and closed-loop forms using configurations. All EXP-ON reporters are tagged by ssrA to capture the real time expression. f Applications in continuous culture systems. Fold changes were calculated using a minimum expression value of 0.01. The expression levels were measured in three independent biological replicates (n = 3). Source data are provided as a Source Data file.
Fig. 6
Fig. 6. Applications of functional amplifiers.
a Protein expression in BL21. Sensor: stationary-phase promoter as input1, exponential-phase promoter as input2. Controller: OAO(E22.7.21.PECF22). Actuator: protein expression module. The STA-ON circuit alternates between exponential-phase OFF and stationary-phase ON states, suppressing protein expression during the exponential phase to avoid growth inhibition and activating production during the stationary phase. b Cross-strain performance comparison of STA-ON circuits. STA-ON circuits were evaluated in two E. coli MG1655 and BL21 under M9-glucose and LB media. c Growth curve analysis of STA-ON device in BL21. The STA-ON device demonstrates growth comparable to BL21wt and the induced system. Samples with circuits induced by aTc (t = 0) exhibited significant growth inhibition, likely due to metabolic stress. Data are presented as mean values ± standard deviation (SD) from three independent biological replicates. d SDS-PAGE analysis of His-tagged protein expression. The STA-ON2 circuit was used to express His-tagged LacI (38 kDa) and T7RNAP (98 kDa) in both open-loop (OL) and closed-loop (CL) configurations with expression comparable to the induced systems, confirming effective stationary-phase-specific activation without external inducers. Experiment was independently repeated three times with similar results. Full uncropped scans are available in the Source Data file. e Dynamic regulation of SA production using the EXP-ON circuit. Sensor: exponential-phase promoter as input1, stationary-phase promoter as input2. Controller: OAO(E22.14.21.PECF22). Actuator: protein expression module. Implemented in an E. coli aroK aroL strain. During the exponential phase, the circuit expresses AroK & AroL to support growth. In the stationary phase, it switches OFF, allowing SA accumulation. f Growth and SA production dynamics. OD600 (green) increases during the growth phase and plateaus in the production phase, while SA production (black) rises sharply, reflecting efficient metabolic flux redirection. Error bars represent the standard deviation of three biological replicates. g Temporal dynamics of EXP-ON1 circuit activity and growth. The yellow line represents EXP-ON1 circuit activity, with high expression during the growth phase and a rapid OFF switch in the production phase, redirecting metabolic flux toward SA accumulation. Source data are provided as a Source Data file.
Fig. 7
Fig. 7. Eliminating crosstalk with a three-dimensional OST.
a Resolving crosstalk through signal decomposition and decoding in the QS system. The input signal matrix shows promoter responses to 3OC6-HSL, 3OC12-HSL, and 3OC14-HSL, with crosstalk arising from natural encoding by the QS system (QS matrix). Using the ideal orthogonal output matrix and Fig. 3b matrix operations, a decoding matrix was derived to resolve crosstalk. To address unattainable α/β ratios, the decoding matrix was decomposed into a promoter scaling matrix and an OA coefficient matrix via the Hadamard product. b Design of the three-dimensional OST circuit. Based on Fig. 7a calculations, ECF22 is linked to Plux with S1-weighted Plas driving anti-ECF22, ECF11 to Plas with S3-weighted Pcin driving anti-ECF11, and ECF38 to Pcin with S2-weighted Plas driving anti-ECF38. Effective outputs of ECF22, ECF11, and ECF38 drive YFP, CFP, and mCherry, respectively. c Input, predicted, and experimental output signal matrices. Heatmaps compare input signals with crosstalk, predicted orthogonal outputs, and experimental results. Red boxes in the input heatmap highlight crosstalk regions—weak signals where strong responses are expected or unintended activation. Predicted and experimental results align closely, confirming that the decoding matrix resolved crosstalk and ensured intended responses. d Comparison of predicted and measured results. The scatter plot shows predicted values on the x-axis and experimental results on the y-axis, demonstrating a strong correlation (R² = 0.855). This confirms the OA circuit’s ability to resolve crosstalk and restore orthogonal signal patterns. The expression levels were measured in three independent biological replicates (n = 3). Source data are provided as a Source Data file.

Similar articles

References

    1. Gao, Y., Wang, L. & Wang, B. Customizing cellular signal processing by synthetic multi-level regulatory circuits. Nat. Commun.14, 8415 (2023). - PMC - PubMed
    1. Babu, M. et al. Genetic interaction maps in Escherichia coli reveal functional crosstalk among cell envelope biogenesis pathways. PLoS Genet.7, e1002377 (2011). - PMC - PubMed
    1. Rajagopala, S. V. et al. The binary protein-protein interaction landscape of Escherichia coli. Nat. Biotechnol.32, 285–290 (2014). - PMC - PubMed
    1. Wan, X. et al. Cascaded amplifying circuits enable ultrasensitive cellular sensors for toxic metals. Nat. Chem. Biol.15, 540–548 (2019). - PubMed
    1. Lee, H. et al. Plug-and-play protein biosensors using aptamer-regulated in vitro transcription. Nat. Commun.15, 7973 (2024). - PMC - PubMed

MeSH terms

LinkOut - more resources