

HPV DNA screening and vaccination strategies in Tunisia
- PMID: 40745454
- PMCID: PMC12313955
- DOI: 10.1038/s41598-025-13423-3
HPV DNA screening and vaccination strategies in Tunisia
Abstract
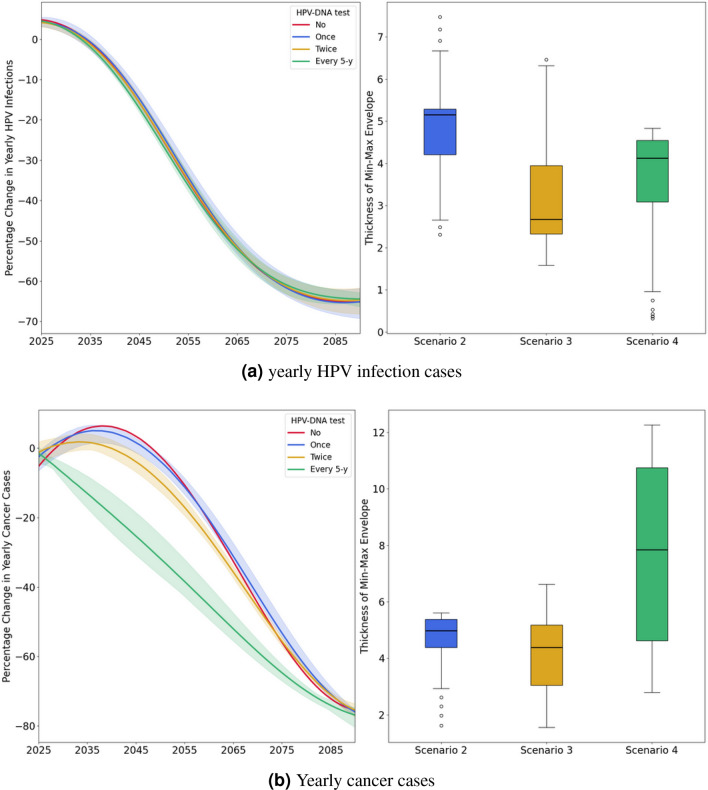
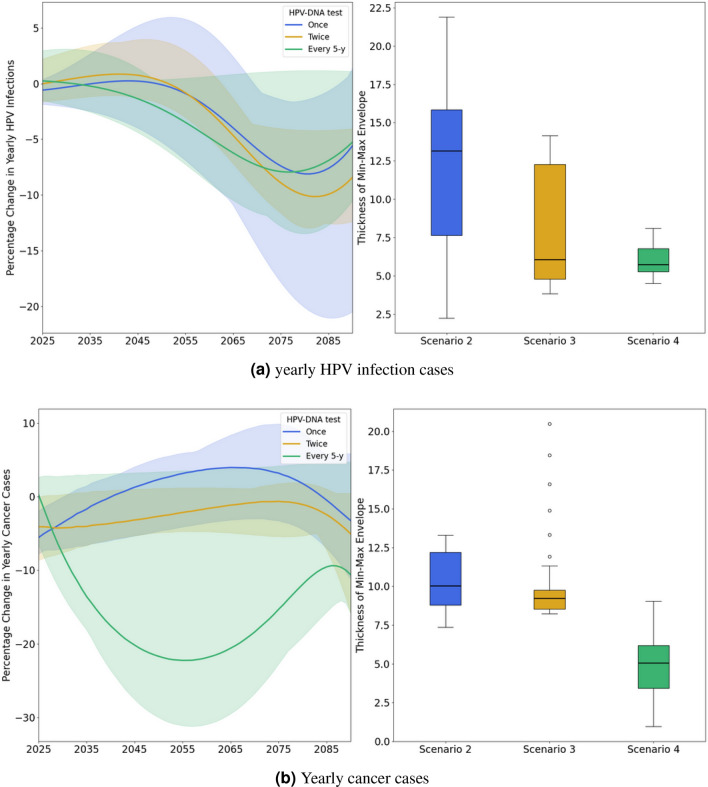
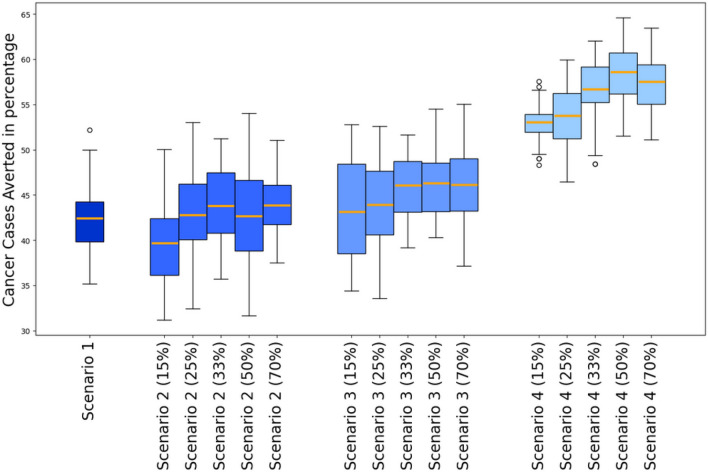
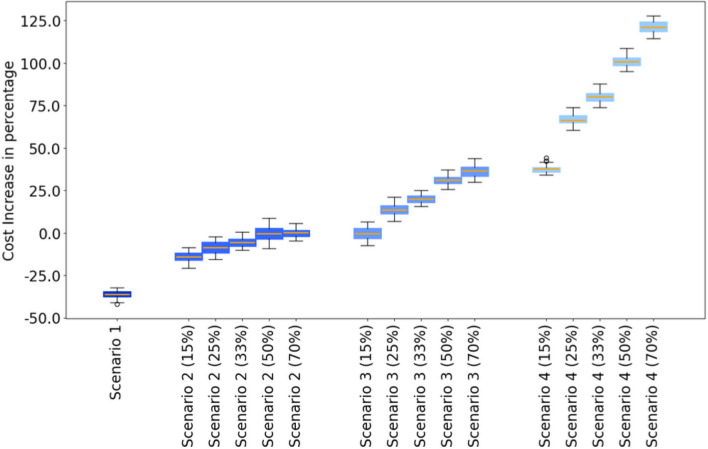
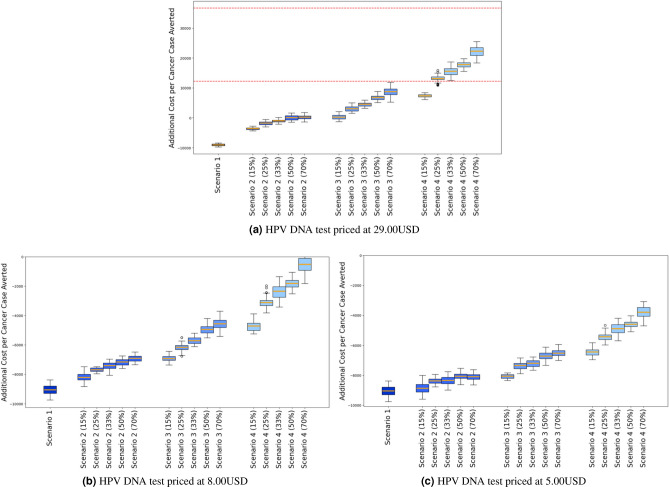
In Tunisia, cervical cancer ranks as the 14th most common cancer, largely driven by high-risk of Human Papillomavirus (HPV) types, notably HPV 16 and 18. Current screening efforts are limited, with only 17% of all women aged 35-60 undergoing Pap-smear testing. The introduction of the HPV vaccine in 2025 through the national school vaccination program, targeting girls aged 11-12, is expected to reduce the burden of cervical cancer. However, alongside vaccination, enhanced screening strategies are essential for early detection and prevention of HPV-related cancers. Aim This study aims to assess the cost-effectiveness of different HPV screening strategies in Tunisia, specifically examining the combination of varying HPV screening frequencies and a vaccination program targeting girls aged 11-12. The objective is to determine the most cost-efficient screening strategy to complement vaccination efforts in reducing cervical cancer incidence. A cost-effectiveness analysis was conducted from the perspective of the Tunisian healthcare system using the HPVsim model, a multi-agent-based simulation tool that captures HPV transmission dynamics and cervical cancer progression. Four approaches were compared: (1) maintaining the current Pap-smear screening strategy combined with vaccination; (2) introducing HPV DNA testing once between ages 35-40; (3) introducing HPV DNA testing twice between ages 35-45, with a 5-year interval; and (4) introducing HPV DNA testing every 5 years for women aged 35-60. All approaches were combined with the vaccination program. Screening coverage rates of 15%, 25%, 33%, 50%, and 70% were tested for each approach. Primary outcomes included the number of cancer cases averted, total intervention costs, and cost increase per cancer case averted. Academic literature and existing evidence were included on the demographic variables, cervical cancer incidence and mortality, treatment costs, vaccine delivery costs and other model parameters. All interventions resulted in substantial reductions in cervical cancer cases, with decreases ranging from 41% to 59% in cumulative cases between 2025 and 2090. The most intensive approach, involving HPV DNA testing every 5 years for women aged 35-60, achieved the largest reduction, with a 59% decrease in cumulative cervical cancer cases by 2090, although it also incurred the highest costs. The least costly option, which retained current Pap-smear testing alongside vaccination, reduced cervical cancer cases by 41%. Although the introduction of HPV DNA testing significantly increases costs, a high frequency of screening allows for quicker public health benefits. The scenario combining vaccination and maintaining current screening practices is found to be the most cost-effective for the Tunisian context. If the price of the HPV DNA test is reduced to $9 USD, the most frequent testing strategy would become the most cost-effective option, offering both high effectiveness and financial viability. Lowering the cost of HPV DNA testing could make more frequent screening financially sustainable, providing greater public health benefits. These findings offer valuable guidance for decision-makers in shaping future strategies for cervical cancer prevention in Tunisia.
© 2025. The Author(s).
Conflict of interest statement
Declarations. Ethical approval: This study does not involve any experimental procedures on human participants or the use of human tissue samples. The data used were sourced from publicly available databases, and no additional ethical approval was required. Competing interests: The authors declare no competing interests.
Figures
Similar articles
-
Cervical Cancer Screening, HPV Vaccination, and Cervical Cancer Elimination.JAMA Netw Open. 2025 Aug 1;8(8):e2526683. doi: 10.1001/jamanetworkopen.2025.26683. JAMA Netw Open. 2025. PMID: 40794406 Free PMC article.
-
Public health impact and cost-effectiveness of implementing gender-neutral vaccination with a 9-valent HPV vaccine in Japan: a modeling study.J Med Econ. 2025 Dec;28(1):974-985. doi: 10.1080/13696998.2025.2520703. Epub 2025 Jun 20. J Med Econ. 2025. PMID: 40528568
-
Prophylactic vaccination against human papillomaviruses to prevent cervical cancer and its precursors.Cochrane Database Syst Rev. 2018 May 9;5(5):CD009069. doi: 10.1002/14651858.CD009069.pub3. Cochrane Database Syst Rev. 2018. PMID: 29740819 Free PMC article.
-
Interventions targeted at women to encourage the uptake of cervical screening.Cochrane Database Syst Rev. 2021 Sep 6;9(9):CD002834. doi: 10.1002/14651858.CD002834.pub3. Cochrane Database Syst Rev. 2021. PMID: 34694000 Free PMC article.
-
[Health technology assessment report. Use of liquid-based cytology for cervical cancer precursors screening].Epidemiol Prev. 2012 Sep-Oct;36(5 Suppl 2):e1-e33. Epidemiol Prev. 2012. PMID: 23139163 Italian.
References
-
- Word Health Organisation (WHO). HPV in Africa. https://www.afro.who.int/health-topics/cervical-cancer
-
- Geneva: World Health Organization. Global strategy to accelerate the elimination of cervical cancer as a public health problem. WHO global strategy (2020).
-
- World Health Organization (WHO) WHO recommends DNA testing as a first-choice screening method for cervical cancer prevention. Sept 2021. https://www.who.int/europe/news/item/11-09-2021-who-recommends-dna-testi...
