

Reduced butyrate-producing bacteria and altered metabolic pathways in the gut microbiome of immunoglobulin A nephropathy patients
- PMID: 40745465
- PMCID: PMC12313972
- DOI: 10.1038/s41598-025-13629-5
Reduced butyrate-producing bacteria and altered metabolic pathways in the gut microbiome of immunoglobulin A nephropathy patients
Abstract
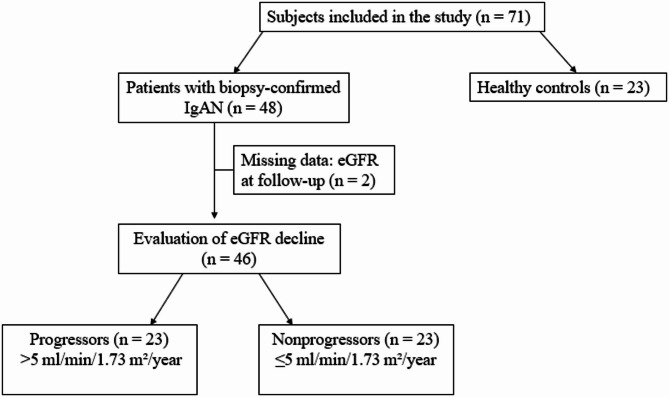
Gut-associated lymphoid tissue is central to the production of galactose-deficient IgA1 (Gd-IgA1), a key factor in immunoglobulin A nephropathy (IgAN). Although no major differences in gut microbiome diversity have been reported across IgAN cohorts, functional alterations in microbial composition may contribute to disease pathogenesis. The study was designed as a cross-sectional study with an embedded prospective cohort component. Forty-eight adults with biopsy-confirmed IgAN-categorized as progressors (eGFR decline > 5 ml/min/1.73 m²/year, n = 23) or nonprogressors (n = 23)-and 23 healthy controls (HC) were recruited. Stool samples underwent metagenomic and functional profiling. Alpha diversity did not differ significantly between IgAN patients and HC. However, butyrate-producing bacteria (Butyrococcus, Agathobacter rectalis) were less abundant in IgAN patients. The sulfoquinovose degradation I pathway, associated with these bacteria, was also reduced. Nucleotide- and nucleoside-biosynthesis pathways were elevated in IgAN. Gd-IgA1 levels correlated with variations in metabolic pathways. Progressors demonstrated enhanced activity in isopropanol biosynthesis, biotin biosynthesis II, and phospholipid biosynthesis pathways. IgAN patients show reduced butyrate-producing bacteria and distinct functional changes in the gut microbiome suggestive of immune activation and inflammation. Progressors exhibit additional metabolic shifts linked to bacterial membrane stabilization.
Keywords: Butyrate-producing bacteria; Gut microbiome; Immunoglobulin a nephropathy; Progressors.
© 2025. The Author(s).
Conflict of interest statement
Declarations. Ethics approval and consent to participate: All participants provided written informed consent. This study was approved by the Clinical Research Ethics Committee of Pauls Stradins Clinical University Hospital (No 191219–6 L) and was conducted in accordance with the Declaration of Helsinki. Competing interests: The authors declare no competing interests.
Figures


References
-
- Schena, F. P. & Nistor, I. Epidemiology of IgA nephropathy: A global perspective. Semin Nephrol.38, 435–442. 10.1016/j.semnephrol.2018.05.013 (2018). - PubMed
MeSH terms
Substances
Grants and funding
- lzp-2019/1-0139/Latvian Council of Science
- lzp-2019/1-0139/Latvian Council of Science
- lzp-2019/1-0139/Latvian Council of Science
- lzp-2019/1-0139/Latvian Council of Science
- lzp-2019/1-0139/Latvian Council of Science
- lzp-2019/1-0139/Latvian Council of Science
- lzp-2019/1-0139/Latvian Council of Science
- lzp-2019/1-0139/Latvian Council of Science
- lzp-2019/1-0139/Latvian Council of Science
- lzp-2019/1-0139/Latvian Council of Science
- lzp-2019/1-0139/Latvian Council of Science
- lzp-2019/1-0139/Latvian Council of Science
- lzp-2019/1-0139/Latvian Council of Science
- lzp-2019/1-0139/Latvian Council of Science
LinkOut - more resources
Full Text Sources
Research Materials
Miscellaneous
