

Comparative Embryology and Transcriptomics of Asellus infernus, an Isopod Crustacean From Sulfidic Groundwater
- PMID: 40746274
- PMCID: PMC12326928
- DOI: 10.1111/ede.70014
Comparative Embryology and Transcriptomics of Asellus infernus, an Isopod Crustacean From Sulfidic Groundwater
Abstract
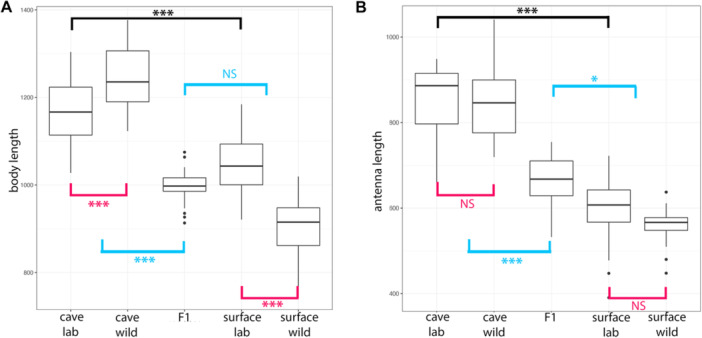
Sulfidic caves are harsh and extreme environments characterized by limited oxygen, low pH, and the presence of hydrogen sulfide. Amazingly, animals can live in sulfidic caves, one such animal being Asellus infernus, a representative of the Asellus aquaticus species complex, originating from Movile Cave and from old wells that represent windows of access to a sulfidic groundwater ecosystem located in southeast Romania. Little previous work has been done on lab-reared populations of A. infernus as they have been historically difficult to raise in the lab. Here, we develop resources for A. infernus, examining questions of timing of morphological differences in cave versus surface individuals, whether the environment (lab-bred vs. wild-caught) influenced size characteristics, and the genes and pathways showing differential expression between cave and surface samples. We found that A. infernus did not develop pigmentation embryonically, and juveniles had increased body length and longer antenna II as compared to surface individuals. Furthermore, we found that some of these measures differed between wild-caught and lab-reared juveniles for a given population, indicating that environmental differences can also influence these size characteristics. In addition, differential expression between cave and surface samples and allele-specific expression studies within F1 hybrids identified multiple genes, including those involved in sulfide metabolism and phototransduction. Strikingly, molecular convergence of genes involved in sulfide detoxification was observed between A. infernus and previous work on a fish that lives in both cave and sulfidic environments, Poecilia mexicana. In sum, we were able to develop embryonic and genomic tools for A. infernus, a model for understanding cave adaptation and adaptation to sulfidic environments.
Keywords: allele‐specific expression; cave; isopod; sulfidic water.
© 2025 The Author(s). Evolution & Development published by Wiley Periodicals LLC.
Conflict of interest statement
The authors declare no conflicts of interest.
Figures


Similar articles
-
Genetic bias in repeated evolution of pigment loss in cave populations of the Asellus aquaticus species complex.J Exp Zool B Mol Dev Evol. 2024 Sep;342(6):425-436. doi: 10.1002/jez.b.23256. Epub 2024 Jun 3. J Exp Zool B Mol Dev Evol. 2024. PMID: 38828691 Free PMC article.
-
Sexual Harassment and Prevention Training.2024 Mar 29. In: StatPearls [Internet]. Treasure Island (FL): StatPearls Publishing; 2025 Jan–. 2024 Mar 29. In: StatPearls [Internet]. Treasure Island (FL): StatPearls Publishing; 2025 Jan–. PMID: 36508513 Free Books & Documents.
-
The Black Book of Psychotropic Dosing and Monitoring.Psychopharmacol Bull. 2024 Jul 8;54(3):8-59. Psychopharmacol Bull. 2024. PMID: 38993656 Free PMC article. Review.
-
The Lived Experience of Autistic Adults in Employment: A Systematic Search and Synthesis.Autism Adulthood. 2024 Dec 2;6(4):495-509. doi: 10.1089/aut.2022.0114. eCollection 2024 Dec. Autism Adulthood. 2024. PMID: 40018061 Review.
-
Signs and symptoms to determine if a patient presenting in primary care or hospital outpatient settings has COVID-19.Cochrane Database Syst Rev. 2022 May 20;5(5):CD013665. doi: 10.1002/14651858.CD013665.pub3. Cochrane Database Syst Rev. 2022. PMID: 35593186 Free PMC article.
References
-
- Bakovic, V. , Martin Cerezo M. L., Höglund A., et al. 2021. “The Genomics of Phenotypically Differentiated Asellus aquaticus Cave, Surface Stream and Lake Ecotypes.” Molecular Ecology 30: 3530–3547. - PubMed
-
- Benjamini, Y. , and Yekutieli D.. 2001. “The Control of the False Discovery Rate in Multiple Testing Under Dependency.” Annals of Statistics 4: 1165–1188.
MeSH terms
Substances
Grants and funding
- R15 EY029499/EY/NEI NIH HHS/United States
- This work was supported by the National Eye Institute of the National Institutes of Health under Award Number R15EY029499 to M.E.P. The content is solely the responsibility of the authors and does not necessarily represent the official views of the National Institutes of Health. S.S. and L.F. are supported by the National Center for Genome Analysis Support (NSF ABI-1759906 to Indiana University; NSF ABI-1759914 to the Pittsburgh Supercomputing Center). This work used Bridges-2 through allocation request number BIO210174 from the Extreme Science and Engineering Discovery Environment (XSEDE), supported by the National Science Foundation (Grant number #1548562). This research was funded by Biodiversa+, the European Biodiversity Partnership under the 2021-2022 BiodivProtect joint call for research proposals, co-funded by the European Commission (GA no. 101052342) and with the funding organisations Ministry of Universities and Research (Italy), Agencia Estatal de Investigación-Fundación Biodiversidad (Spain), Fundo Regional para a Ciência e Tecnologia (Portugal), Suomen Akatemia-Ministry of the Environment (Finland), Belgian Science Policy Office (Belgium), Agence Nationale de la Recherche (France), Deutsche Forschungsgemeinschaft e.V. (Germany), Schweizerischer Nationalfonds (Grant no. 31BD30_209583, Switzerland), Fonds zur Förderung der Wissenschaftlichen Forschung (Austria), Ministry of Higher Education, Science and Innovation (Slovenia), and the Executive Agency for Higher Education, Research, Development and Innovation Funding (Romania).
LinkOut - more resources
Full Text Sources
Miscellaneous
