. 2025 Jul 17:16:1595706.
doi: 10.3389/fimmu.2025.1595706. eCollection 2025.

Multiple analytical perspectives of mitochondrial genes in the context of preeclampsia: potential diagnostic markers

Affiliations

Multiple analytical perspectives of mitochondrial genes in the context of preeclampsia: potential diagnostic markers

Can Li et al. Front Immunol. .

Abstract

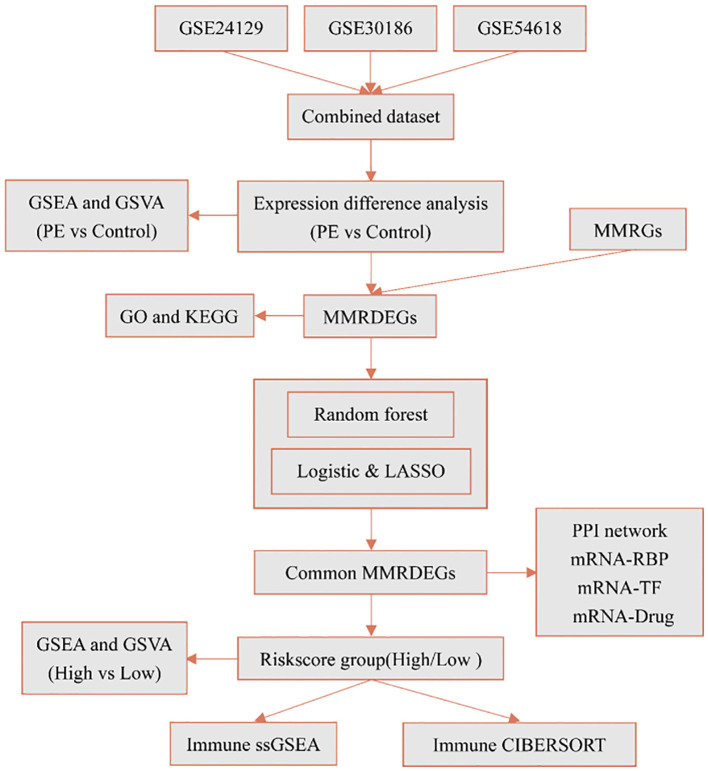
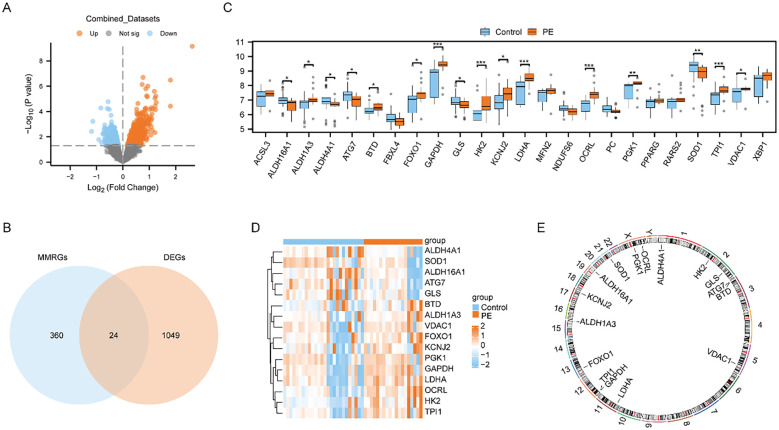
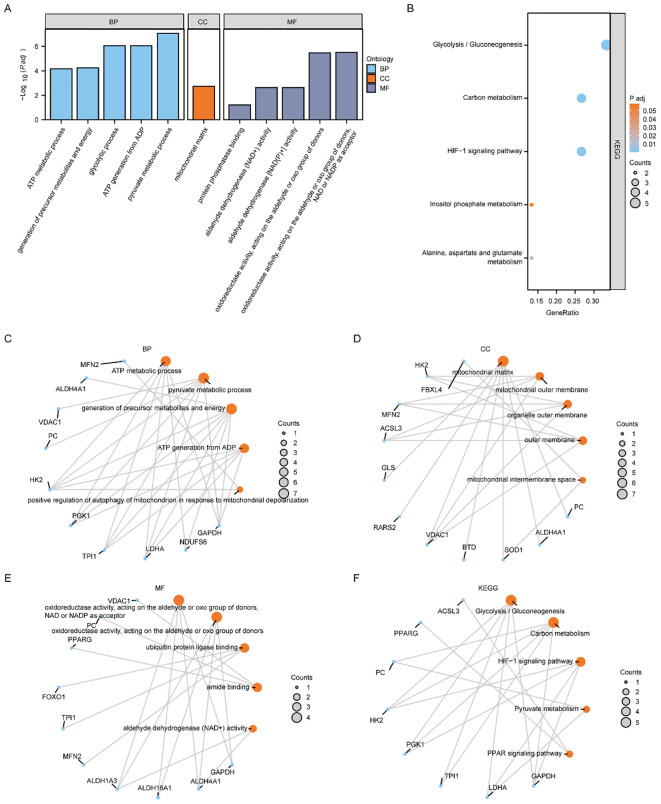
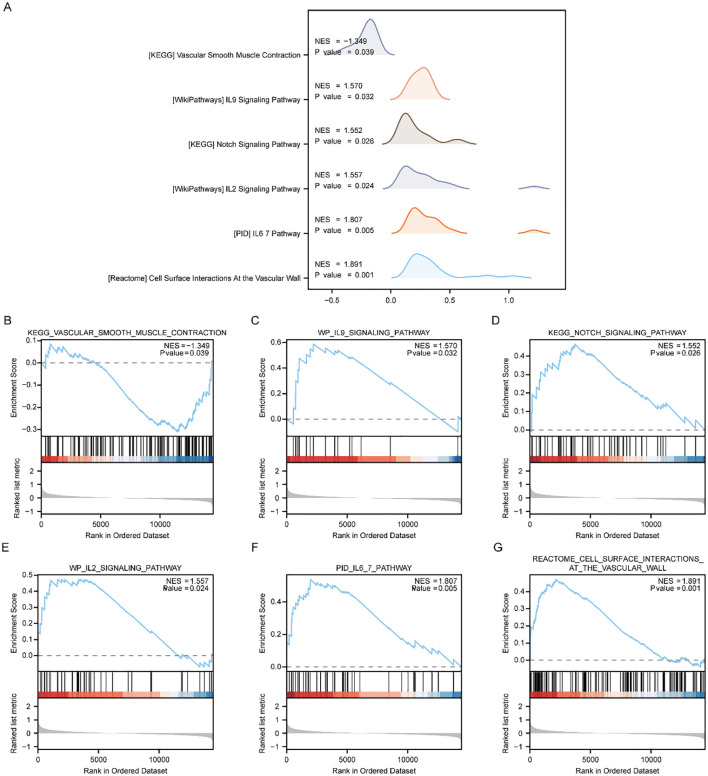
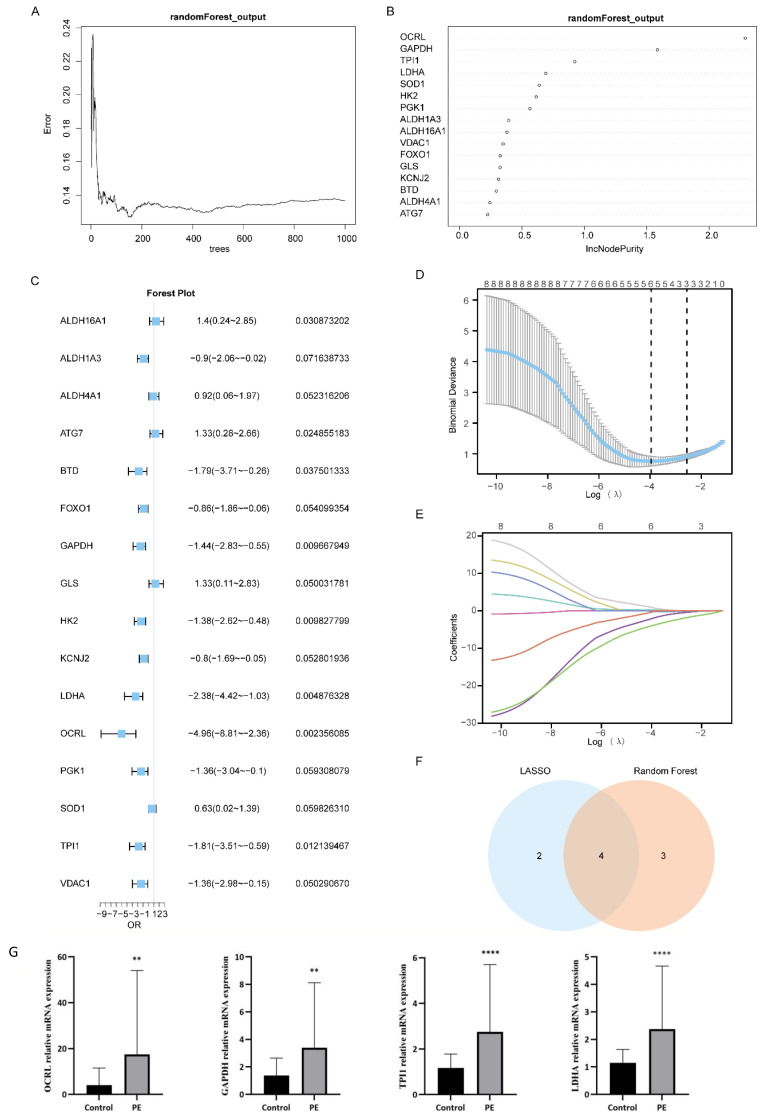
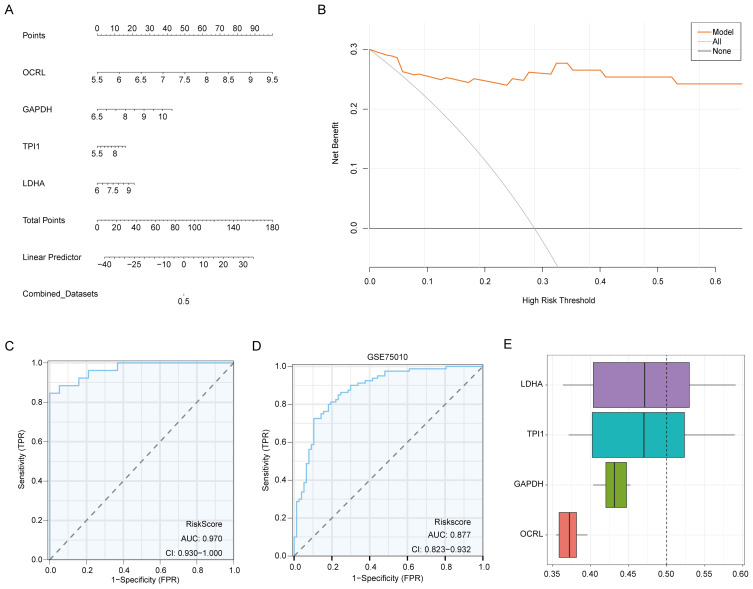
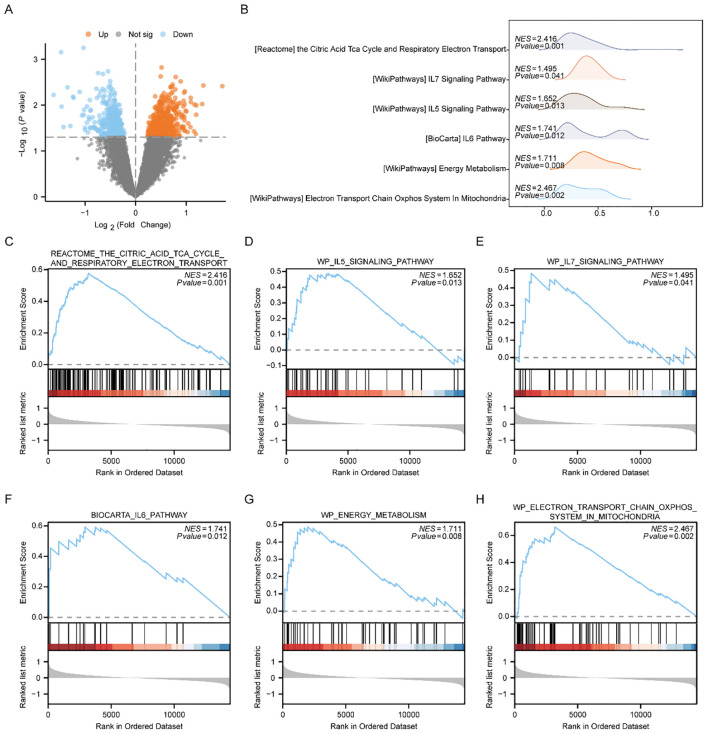
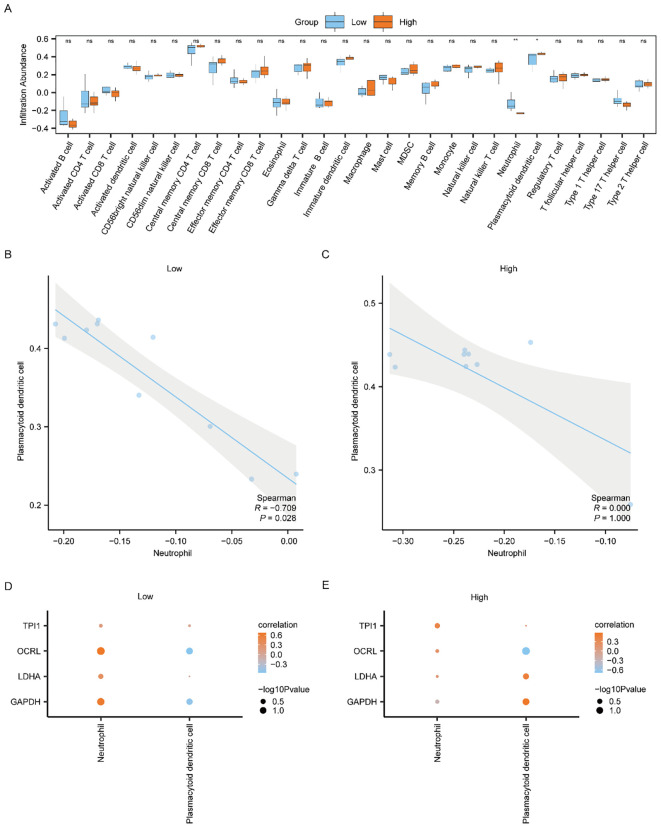
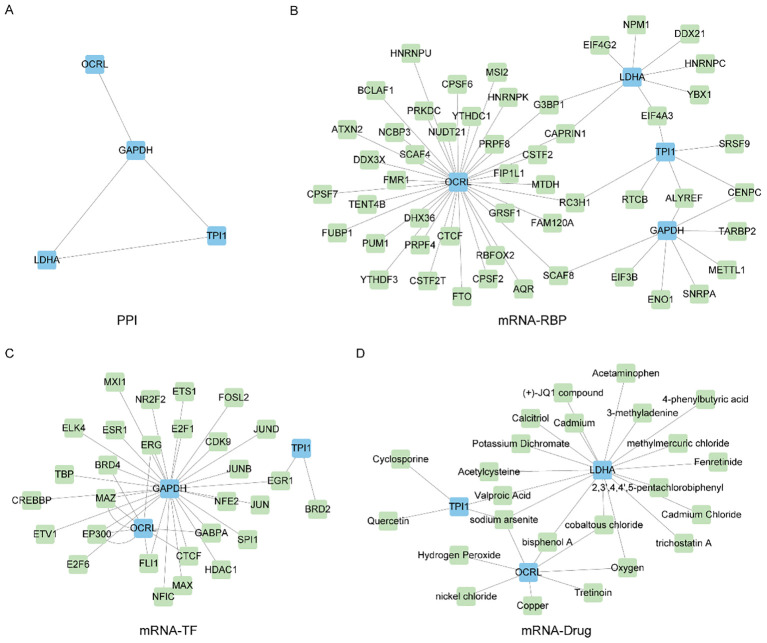
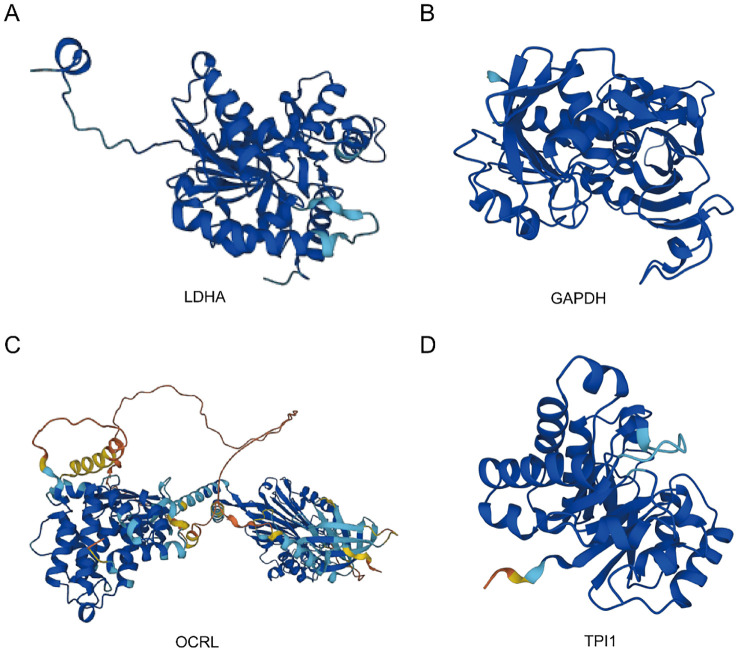
Preeclampsia(PE) is closely linked to adverse maternal and fetal outcomes. Given the pivotal roles of mitochondria in various human diseases and the limited research on their involvement in PE, this study identified biomarkers linked to mitochondrial metabolism in PE and their roles in its pathogenesis. Data from three datasets were integrated using the ComBat algorithm to mitigate batch effects. Differential expression analysis identified genes differentially expressed between PE cases and Control group. Cross-referencing these genes with mitochondrial energy metabolism-related genes (MMRGs) isolated mitochondrial energy metabolism-related differentially expressed genes (MMRDEGs). GO and KEGG analysis were performed to elucidate the functions of the MMRDEGs. A diagnostic model using Random Forest and logistic regression was validated by ROC curve analysis. mRNA expressions of OCRL, TPI1, GAPDH, and LDHA were quantified via qPCR. Immune characteristics were explored, and PPI, mRNA-miRNA, mRNA-TF and mRNA-RBP interaction networks were constructed. AlphaFold analyzed protein structures of OCRL, TPI1, GAPDH, and LDHA. A total of 1073 DEGs and 24 MMRDEGs were identified. OCRL, TPI1, GAPDH, and LDHA formed the diagnostic model, which were predominantly enriched in pyruvate metabolism, glycolysis, and ATP metabolism pathways. CIBERSORT highlighted immune cell composition variations between PE and Control groups. OCRL, TPI1, GAPDH, and LDHA exhibited increased mRNA expression levels in preeclamptic placentas. Therefore, MMRDEGs may play a critical role in the mechanism of oxidative stress and inflammatory response in PE by mediating metabolic regulation and immune modulation, potentially serving as diagnostic biomarkers associated with mitochondrial metabolism in preeclampsia.

Keywords: diagnostic model; immune cells infiltration; machine learning; mitochondria-related genes; preeclampsia.


Conflict of interest statement

The authors declare that the research was conducted in the absence of any commercial or financial relationships that could be construed as a potential conflict of interest.

Figures

Figure 1
Figure 1
Technology roadmap. PE, Preeclampsia; GSEA, Gene Set Enrichment Analysis; GSVA, Gene Set Variation Analysis; MMRGs, Mitochondrial energy metabolism-related genes; MMRDEGs, Mitochondrial energy metabolism related differentially expressed genes; GO, Gene Ontology; KEGG, Kyoto Encyclopedia of Genes and Genomes; LASSO, Least absolute shrinkage and selection operator; RBP, RNA binding protein; TF, Transcription factors; ssGSEA, single-sample gene-set enrichment analysis.
Figure 2
Figure 2
Differential expression analysis and correlation analysis of MMRDEGs. (A) Volcano plot presentation of the results of differential analysis between PE cases and Control group in Combined datasets. (B) Venn diagram of DEGs between PE cases and Control group and MMRGs in Combined datasets. (C) Group comparison plot of MMRDEGs between PE cases and Control group in Combined datasets. (D) Simplified numerical heatmap of MMRDEGs in Combined datasets. (E) Chromosomal mapping of MMRDEGs. The symbol ns was equivalent to p ≥ 0.05, which was not statistically significant. The symbol * is equivalent to p < 0.05, which is statistically significant; The symbol ** is equivalent to p < 0.01, which is highly statistically significant; The symbol *** is equivalent to p < 0.001 and highly statistically significant. PE, Preeclampsia; DEGs, differentially expressed genes; MMRGs, Mitochondrial energy metabolism related genes; MMRDEGs, Mitochondrial energy metabolism related differentially expressed genes.
Figure 3
Figure 3
Functional enrichment analysis (GO) and pathway enrichment (KEGG) analysis of MMRDEGs. (A) Bar graph showing the GO enrichment analysis results of MMRDEGs. (B) Bubble plot display of KEGG pathway enrichment analysis results of MMRDEGs. (C–F) Loop network diagram of BP pathway (C), CC pathway (D), MF pathway (E) and KEGG pathway (F) in MMRDEGs enrichment analysis results. In the bar graph (A), the abscissa is the GO terms, and the height of the bar indicates the Padj value of GO terms. In the network diagram (C–F), blue dots represent specific genes, and orange dots represent specific pathways. MMRDEGs, Mitochondrial energy metabolism related differentially expressed genes; GO, Gene Ontology; BP, biological process; CC, cellular component; MF, molecular function; KEGG, Kyoto Encyclopedia of Genes and Genomes; The screening criterion for GO/KEGG enrichment items was p < 0.05.
Figure 4
Figure 4
GSEA enrichment analysis between PE cases and Control group in Combined dataset. (A) Six main biological characteristics of GSEA enrichment analysis of genes between different groups (PE/Control) of Combined dataset. (B–G) Genes in Combined dataset were significantly enriched in KEGG vascular smooth muscle contraction (B), IL9 signaling pathway (C), KEGG NOTCH signaling pathway (D), IL2 signaling pathway (E), IL6/7 pathway (F), Cell surface interactions at the vascular wall (G). PE, Preeclampsia; GSEA, Gene Set Enrichment Analysis. The significant enrichment screening criterion for GSEA enrichment analysis was p < 0.05.
Figure 5
Figure 5
Construction of MMRDEGs diagnostic model. (A) Plot of model training error of RF algorithm. (B) IncNodePurity presentation of MMRDEGs in the RF model (in descending order of IncNodePurity). (C) Forest Plot of Logistic regression model for MMRDEGs. (D) Diagnostic model plot of LASSO regression model. (E) Variable trajectory plot of LASSO regression model. (F) Venn diagram of MMRDEGs in LASSO regression model and MMRDEGs in RF model. (G) The mRNA expressions of OCRL, GAPDH, TPI1 and LDHA of placental tissues in the PE cases and Control group. The symbol ** is equivalent to p < 0.01, which is highly statistically significant; The symbol **** is equivalent to p < 0.0001 and is highly statistically significant. PE, Preeclampsia; MMRDEGs, Mitochondrial energy metabolism related differentially expressed genes; LASSO, Least Absolute Shrinkage and Selection Operator; Common MMRDEGs, Common Mitochondrial energy metabolism related differentially expressed genes.
Figure 6
Figure 6
Validation of the MMRDEGs diagnostic model. (A) Nomogram of Common MMRDEGs in MMRDEGs Logistic regression model. (B) Decision curve in Logistic regression model of MMRDEGs. (C) ROC curve of MMRDEGs diagnostic model in Combined dataset. (D) ROC curve of MMRDEGs diagnostic model in GSE75010. (E) Functional similarity analysis results among Common MMRDEGs. ROC, receiver operating characteristic curve; AUC, Area Under the Curve, MMRDEGs, Mitochondrial energy metabolism related differentially expressed genes; Common MMRDEGs, Common Mitochondrial energy metabolism related differentially expressed genes; DCA, Decision Curve Analysis. The closer the AUC in the ROC curve is to 1, the better the diagnostic effect is. When AUC was between 0.5 and 0.7, the accuracy was low. When AUC was 0.7-0.9, it had a certain accuracy. AUC > 0.9 had high accuracy.
Figure 7
Figure 7
GSEA enrichment analysis between high and low risk-score groups of Combined dataset. (A) Volcano plot of gene difference analysis between High and Low Risk-score groups in Combined dataset. (B) Mountain plot display of six main biological characteristics of GSEA enrichment analysis results. C-H. Genes significantly enriched in the citric acid TCA cycle and respiratory electron transport between the High and Low Risk-score groups of Combined dataset (C), IL7 signaling pathway (D), IL5 signaling pathway (E), IL6 pathway (F), energy metabolism (G), electron transport chain Oxphos system in mitochondria (H). PE, Preeclampsia; GSEA, Gene Set Enrichment Analysis. The significant enrichment screening criterion for GSEA enrichment analysis was p < 0.05.
Figure 8
Figure 8
Differential analysis of ssGSEA immune characteristics between high and low risk-score groups in Combined dataset data. (A) The group comparison of ssGSEA immune infiltration analysis between the Low/High Risk-score groups of Combined dataset data. (B, C) Scatter plot of correlation between Neutrophil and Plasmacytoid dendritic cell of cell infiltration abundance in the Low Risk-score group (B) and High Risk-score group (C) of Combined dataset. (D, E) Dot plot of correlation between immune cells and Common MMRDEGs in the Low Risk-score group (D) and High Risk-score group (E) of Combined dataset. ssGSEA, single-sample gene-set enrichment Analysis; Common MMRDEGs, Common Mitochondrial energy metabolism related differentially expressed genes; PE, preeclampsia. The symbol ns is equivalent to p ≥ 0.05 and not statistically significant; The symbol * is equivalent to p < 0.05, which is statistically significant; The symbol ** is equivalent to p < 0.01, which is highly statistically significant; The absolute value of the correlation coefficient in the scatter plot of correlation was more than 0.8, indicating a strong correlation. Moderate correlation was defined as an absolute value between 0.5 and 0.8. 0.3-0.5 is weak correlation; Values below 0.3 are considered weak or uncorrelated.
Figure 9
Figure 9
Construct PPI network and mRNA-RBP, mRNA-TF, mRNA-Drug interaction network. (A) Protein interaction network of Common MMRDEGs (PPI network). (B) mRNA-RBP network of Common MMRDEGs, blue quadrangle blocks are mRNA; Green quadrilateral blocks are RBP. (C) mRNA-TF network of Common MMRDEGs, and the blue quadrangle blocks in the mRNA-TF interaction network are mRNA; Green quadrangle-shaped blocks are TFs. (D) mRNA-Drug network of Common MMRDEGs, and the blue quadrangle blocks in the mRNA-Drug interaction network are mRNA; Green quadrangular blocks are drugs. PE, Preeclampsia; RBP, RNA binding protein; TFs, Transcription factors; Common MMRDEGs, Common Mitochondrial energy metabolism related differentially expressed genes.
Figure 10
Figure 10
Protein structures of common MMRDEGs. The protein structures of LDHA (A), GAPDH (B), OCRL (C), and TPI1 (D) are shown. The AlphaFold website produced a confidence score per residue (pLDDT) between 0 and 100. Some regions below 50 pLDDT may be isolated unstructured regions, and when pLDDT < 50 (red area), the model confidence is very low; When 50 < pLDDT < 70 (yellow area), the model confidence is low; When 70 < pLDDT < 90 (light blue area), the model confidence was normal. When 90 < pLDDT (blue area), the model confidence is very high. Common MMRDEGs, Common Mitochondrial energy metabolism related differentially expressed genes.

Similar articles

References

    1. Wu Y, Li M, Ying H, Gu Y, Zhu Y, Gu Y, et al. Mitochondrial quality control alterations and placenta-related disorders. Front Physiol. (2024) 15:1344951. doi: 10.3389/fphys.2024.1344951, PMID: - DOI - PMC - PubMed
    1. Taglauer ES, Fernandez-Gonzalez A, Willis GR, Reis M, Yeung V, Liu X, et al. Antenatal mesenchymal stromal cell extracellular vesicle therapy prevents preeclamptic lung injury in mice. Am J Respir Cell Mol Biol. (2022) 66:86–95. doi: 10.1165/rcmb.2021-0307OC, PMID: - DOI - PMC - PubMed
    1. Cipolla MJ, Biller J. Persistent brain injury after preeclampsia. Neurology. (2017) 88:1216–7. doi: 10.1212/WNL.0000000000003773, PMID: - DOI - PubMed
    1. Duffy J, Cairns AE, Richards-Doran D, van 't Hooft J, Gale C, Brown M, et al. A core outcome set for pre-eclampsia research: an international consensus development study. BJOG: an Int J obstetrics gynaecology. (2020) 127:1516–26. doi: 10.1111/1471-0528.16319, PMID: - DOI - PubMed
    1. Xu X, Zhu M, Zu Y, Wang G, Li X, Yan J. Nox2 inhibition reduces trophoblast ferroptosis in preeclampsia via the STAT3/GPX4 pathway. Life Sci. (2024) 343:122555. doi: 10.1016/j.lfs.2024.122555, PMID: - DOI - PubMed

LinkOut - more resources