. 2025 Jul 17:16:1613621.
doi: 10.3389/fimmu.2025.1613621. eCollection 2025.

The insulator EACBE regulates V(D)J recombination of Tcrd gene by modulating chromatin organization

Affiliations

The insulator EACBE regulates V(D)J recombination of Tcrd gene by modulating chromatin organization

Yongchang Zhu et al. Front Immunol. .

Abstract

T cell receptor (TCR) diversity, essential for the recognition of a wide array of antigens, is generated through V(D)J recombination. The Tcra and Tcrd genes reside within a shared genomic locus, with Tcrd rearrangement occurring first in the double-negative (DN) stage during thymocyte development. Elucidating the regulatory mechanisms governing Tcrd rearrangement is therefore crucial for understanding the developmental coordination of both Tcrd and Tcra rearrangements. Chromatin architecture, orchestrated by CTCF-cohesin complexes and their binding sites, plays a fundamental role in regulating V(D)J recombination of antigen receptor genes. In this study, we report that EACBE, a CTCF binding element (CBE) located downstream of the Tcra-Tcrd locus, regulates Tcrd rearrangement. EACBE promotes the usage of proximal Vδ gene segments by facilitating spatial proximity between the Tcrd recombination centre and these Vδ elements. Notably, EACBE counteracts the insulating effects of INTs, two CBEs that demarcate the proximal V region from the Dδ-Jδ-Cδ cluster, thereby enabling effective chromatin extrusion. Furthermore, EACBE indirectly shapes the Tcra repertoire through its influence on Tcrd rearrangement. These findings reveal a novel regulatory axis involving special chromatin configuration and highlight distinct roles for specific CTCF binding sites in modulating antigen receptor gene assembly.

Keywords: CTCF binding element; T cell receptor; V(D)J recombination; chromatin activity; chromatin architecture.


Conflict of interest statement

The authors declare that the research was conducted in the absence of any commercial or financial relationships that could be construed as a potential conflict of interest.

Figures
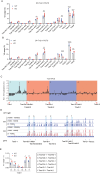
Figure 1
Figure 1
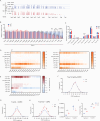
EACBE regulates Vα gene usage by modulating the rearrangement of distal Vδ segments. (A) The usage of Vδ segments was detected by LAM-HTGTS from the Trdj1 viewpoint in sorted DN thymocytes from WT (Blue circle) and EACBE-/- (Red quadrate) mice. Data represent the mean ± s.d. of four experiments. *P <0.05, ***P <0.001, ****P <0.0001 by two-side multiple Student’s T test. (B) The usage of Vδ segments was detected by LAM-HTGTS from the Trdj1 viewpoint in sorted DP thymocytes from WT (Blue circle) and EACBE-/- (Red quadrate) mice. Data represent the mean ± s.d. of two experiments. **P <0.01, ***P <0.001, ****P <0.0001 by two-side multiple Student’s T test. (C) EACBE-/- to WT subtraction of Vα usage, calculated from previous Tcra repertoire sequencing data (GEO: GSE145147). (D) Detection of Vα peaks by LAM-HTGTS with the Traj61 viewpoint in sorted DP thymocytes from WT (Blue) and EACBE-/- (Red) mice. Each experiment was repeated three times. The Y-axis represents the binding strength of the peaks that are rearranged with VP. (E) Histogram showing the usage of three Vα segments located behind the Trav15 family from panel (D). Data represent the mean ± s.d. of three experiments. *P <0.05, **P <0.01, ***P <0.001 by two side multiple Student’s T test.
Figure 2
Figure 2
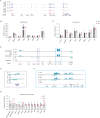
EACBE regulates the diversity of Trav14 family-related TCRs. (A) Detection of Jα peaks by LAM-HTGTS with the Trav14 viewpoint in sorted DP thymocytes from WT (Blue) and EACBE-/- (Red) mice. Each experiment was repeated three times. The Y-axis represents the binding strength of the peaks that are rearranged with VP. (B) Histogram showing relative Jα usage of from panel (A). Data represent the mean ± s.d. of three experiments. **P <0.01, ***P <0.001 by two side multiple Student’s T test. (C) Histogram showing the usage frequency of each member of the Trav14 family from panel (A). Data represent the mean ± s.d. of three experiments. **P <0.01, ***P <0.001, ****P <0.0001 by two side multiple Student’s T test. (D) Heatmap showing the Trav14-Jα combination of each Trav14 member in sorted DP thymocytes from WT and EACBE-/- mice. Each experiment was repeated three times. (E) Heatmap of EACBE-/- – WT subtraction represents the Trav14-Jα combination of the differences from panel (D). Data represent the mean of three experiments. (F) CDR3 lengths of Trav14 family repertoires in WT and EACBE-/- mice. Data represent the mean ± s.d. of three experiments. (G, H) CDR3 length of Trαv14-1 (G) and Trαv14d-1 (H) repertoires in WT and EACBE-/- mice. Data represent the mean ± s.d. of three experiments. *P <0.05, **P <0.01 by two side multiple Student’s T test. (I, J) Simpson’s index (I) and Shannon’s index (J) of Trαv14–1 and Trαv14d-1 repertoires in WT and EACBE-/- mice. Data represent the mean ± s.d. of three experiments.
Figure 3
Figure 3
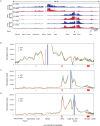
EACBE regulates chromatin activity of Tcrd gene in DN cells. (A) ATAC-seq signals on the Tcra-Tcrd locus in DN thymocytes from Rag1 −/− and EACBE−/− Rag1 −/− mice. Data were representative of two independent experiments. (B, C) Histone H3K4me3 (B) and H3K27ac (C) modification analyzed by ChIP-qPCR on the Tcra-Tcrd locus in DN thymocytes from Rag2 −/− and EACBE−/− Rag2 −/− mice. Each experiment was repeated twice. (D-F) Genome browser views depicting GT-RNA-seq data of the Tcra-Tcrd locus in DN thymocytes from Rag1 −/− and EACBE−/− Rag1 −/− mice. Positive strand transcription is shown in Ocean Blue, and negative strand transcription is shown in pale green. Coordinates (mm10): chr14: 53747480-54261865. Rectangles of the same color correspond to the same enlarged area. Data represent the one experiment. (G) Relative germline transcription in the Tcra-Tcrd locus in DN thymocytes from Rag1 −/− and EACBE−/− Rag1 −/− mice detected using reverse-transcription qPCR. Expressions were normalized to the Actb gene. Data represent the mean ± s.d. of three experiments.
Figure 4
Figure 4
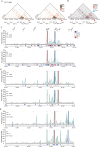
EACBE regulates the spatial organization of the Tcrα-Tcrd locus at the DN stage. (A) Genome browser views depicting 3C-HTGTS pairwise chromatin interactions from Trdv2-2, Trdd2, and Trdv5 viewpoints in the 3’ portion of the Tcra-Tcrd locus in DN thymocytes from Rag1 −/− (WT, blue) and EACBE−/− Rag1 −/− (KO, red) mice. 3C-HTGTS is representative of three replicates for each viewpoint. Gene annotations are shown below. Coordinates (mm10): chr14: 53738375-54282925. (B-D) Line plots displaying the difference of pairwise interactions between Rag1 −/− (WT, orange) and EACBE−/− Rag1 −/−(KO, green) mice at the Trdv2-2 (B), Trdd2 (C) and Trdv5 (D) viewpoints using the 4C-ker program. Analysis is based on three independent experimental replicates. Filled circles highlight significant differential interactions (P < 0.05; statistics derived using DESeq2). Gene positions are annotated by red-filled rectangles and the blue-filled bar highlights the viewpoint position.
Figure 5
Figure 5
Effect of EACBE on higher-order chromatin structure of Tcrα-Tcrd locus in DN cells. (A) Heatmap showing three-way chromatin interactions in the 3’ portion of the Tcrα-Tcrd locus from the Trdd2 viewpoint in DN thymocytes from Rag1 −/− (WT, up) and EACBE−/− Rag1 −/−(KO, down) mice. The heatmap represents mean of three experimental replicates. Gene annotations are shown middle. Resolution: 5kb; Coordinates (mm10): chr14: 53738375-54282925. (B) EACBE-/- – WT subtraction heatmap (resolution: 5kb) showing the three-way contact differences from panel (A). (C) VP-SOI plots displaying co-occurrence contacts of sequences in the 3’ portion of the Tcra-Tcrd locus in the combination of the Trdd2 viewpoint (pale blue rectangle) and the SOI containing INT2 (pale red rectangle) in DN thymocytes from Rag1 −/− and EACBE−/− Rag1 −/− mice. The green line represents the observed co-occurrence frequency, and the gray line represents the expected frequency (mean ± s.d.) of sequences across the locus. z-scores (dark blue indicating significant enrichment, dark red indicating significant lack of a given site) are shown for SOIs in rectangles below each graph. Gene annotations are at the top. (D) VP-SOI plots displaying co-occurrence contacts of sequences in the 3’ portion of the Tcra-Tcrd locus in the combination of the Trdd2 viewpoint (pale blue rectangle) and the SOI containing Trdv5 (pale red rectangle) in DN thymocytes from Rag1 −/− and EACBE−/− Rag1 −/− mice. (E) VP-SOI plots displaying co-occurrence contacts of sequences in the 3’ portion of the Tcra-Tcrd locus in the combination of the Eα viewpoint (pale blue rectangle) and the SOI containing Trdd2 (pale red rectangle) in DN thymocytes from Rag1 −/− and EACBE−/− Rag1 −/− mice.

Similar articles

References

    1. Rogers J, Bajur AT, Salaita K, Spillane KM. Mechanical control of antigen detection and discrimination by T and B cell receptors. Biophys J. (2024) 123:2234–55. doi: 10.1016/j.bpj.2024.05.020, PMID: - DOI - PMC - PubMed
    1. Proudhon C, Hao B, Raviram R, Chaumeil J, Skok JA. Long-range regulation of V(D)J recombination. Adv Immunol. (2015) 128:123–82. doi: 10.1016/bs.ai.2015.07.003, PMID: - DOI - PMC - PubMed
    1. Jung D, Giallourakis C, Mostoslavsky R, Alt FW. Mechanism and control of V(D)J recombination at the immunoglobulin heavy chain locus. Annu Rev Immunol. (2006) 24:541–70. doi: 10.1146/annurev.immunol.23.021704.115830, PMID: - DOI - PubMed
    1. Krangel MS. Mechanics of T cell receptor gene rearrangement. Curr Opin Immunol. (2009) 21:133–9. doi: 10.1016/j.coi.2009.03.009, PMID: - DOI - PMC - PubMed
    1. Hao B, Krangel MS. Long-distance regulation of fetal V(Delta) gene segment trdv4 by the tcrd enhancer. J Immunol. (2011) 187:2484–91. doi: 10.4049/jimmunol.1100468, PMID: - DOI - PMC - PubMed

LinkOut - more resources