. 2025 Jul 17:15:1585574.
doi: 10.3389/fonc.2025.1585574. eCollection 2025.

Integrating single-cell regulatory atlas and multi-omics data for differential treatment response and multimodal predictive modeling in CDK 4/6 inhibitor-treated breast cancer

Affiliations

Integrating single-cell regulatory atlas and multi-omics data for differential treatment response and multimodal predictive modeling in CDK 4/6 inhibitor-treated breast cancer

Li Yan et al. Front Oncol. .

Abstract

Introduction: CDK4/6 inhibitors are cornerstone therapies for advanced HR+/HER2- breast cancer, yet treatment response heterogeneity remains a major clinical challenge. This study integrates single-cell regulatory landscapes with multi-omics data to decode resistance mechanisms and develop predictive biomarkers for CDK4/6 inhibitor response stratification.

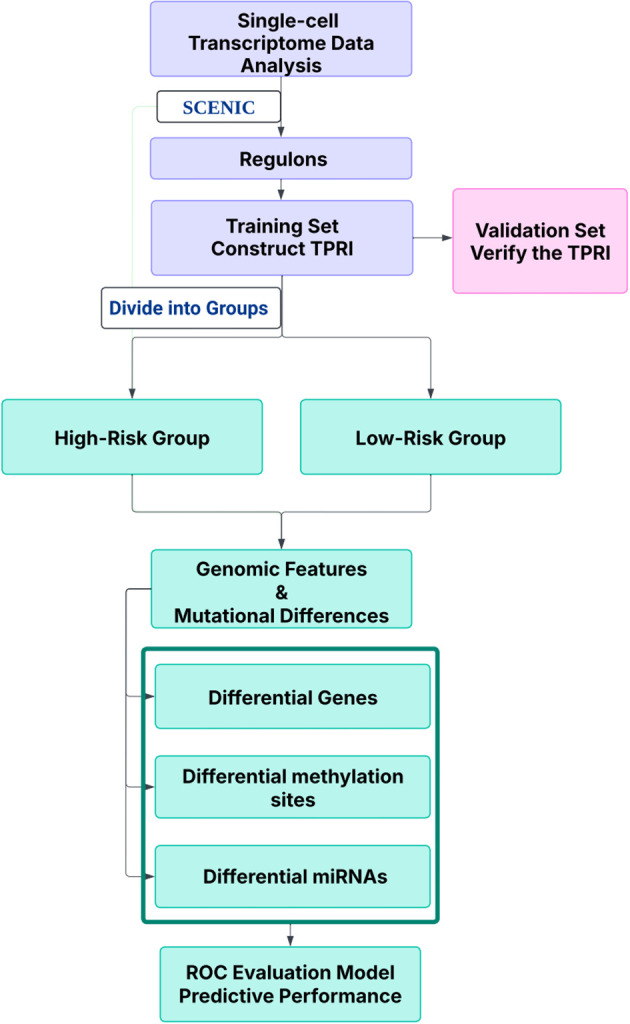
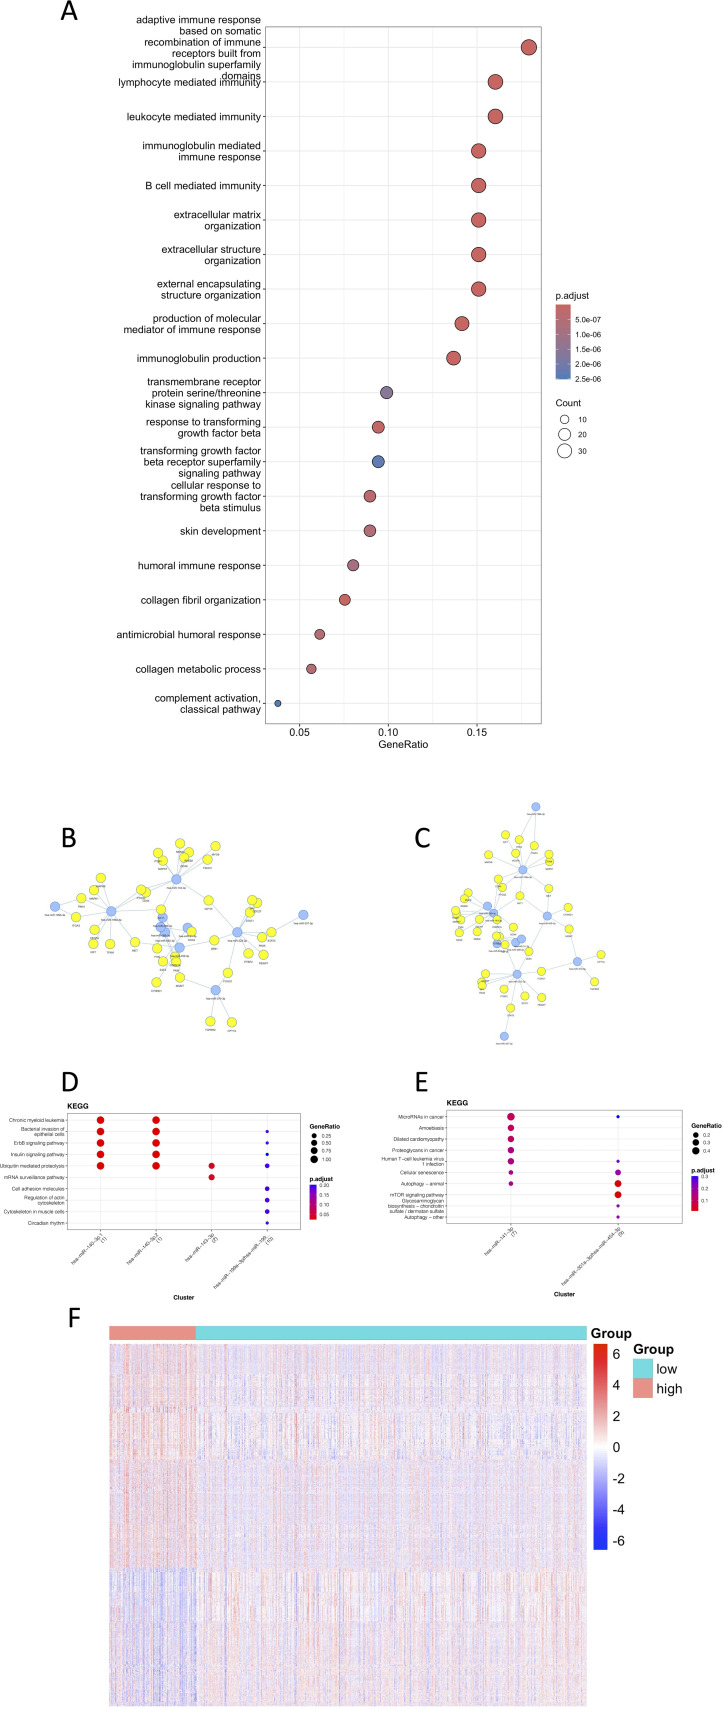
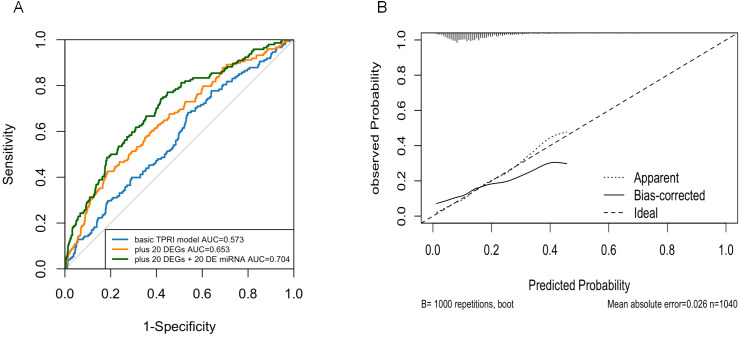
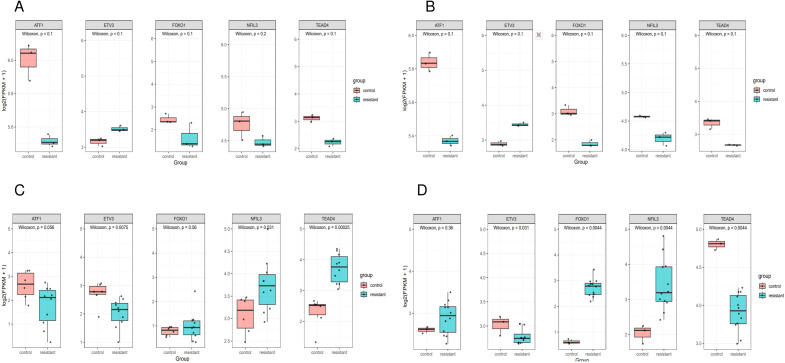
Methods: Single-cell RNA-seq data (GSE158724, n=14 samples) and bulk multi-omics profiles (TCGA-BRCA, n=1,059; GSE186901, n=90) were analyzed. Gene regulatory networks were reconstructed using SCENIC to identify resistance-specific regulons. The Tumor Prognostic Regulon Index (TPRI) was derived from five prognostic transcription factors and validated in independent cohorts. Experimental validation including qPCR of core TFs was performed in patient-derived samples. Multimodal predictive models integrating TPRI, differentially expressed genes, and miRNAs were developed using logistic regression, with performance assessed via ROC/AUC analysis.

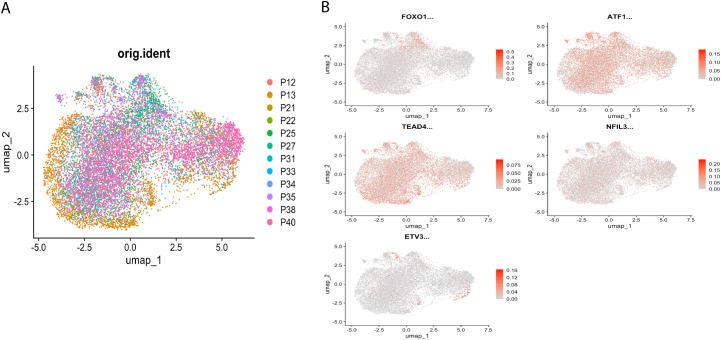
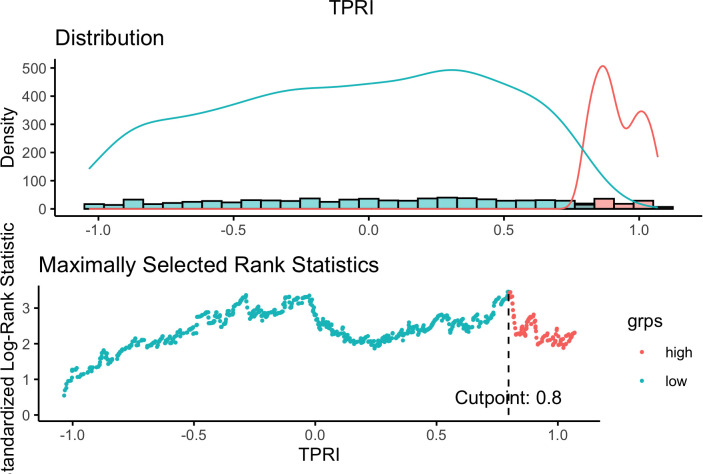
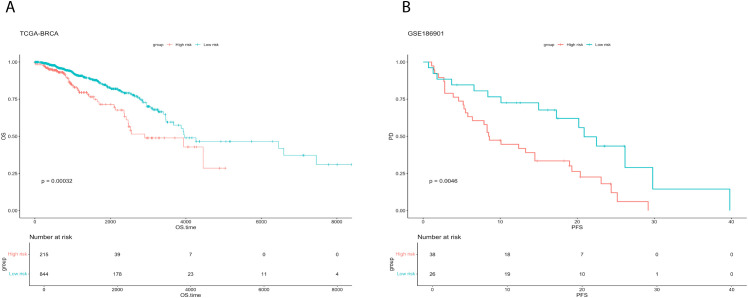
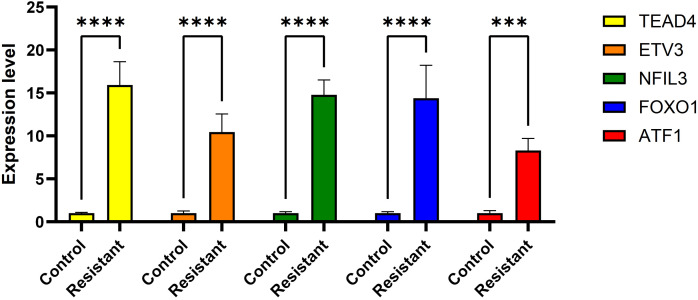
Results: We identified 86 resistance-associated regulons and established TPRI based on five prognostic TFs (ATF1, TEAD4, NFIL3, FOXO1, ETV3). TPRI significantly stratified patients into high/low-risk groups with differential overall survival and treatment response (Fisher's exact test P=0.0237). qPCR confirmed elevated expression of these TFs in resistant tumors (P<0.01). High-risk patients exhibited increased stemness indices (mRNAsi, P<2.2e-16) and mTOR pathway activation. The multimodal model (TPRI + top 30 DEGs + top 30 miRNAs) achieved superior prognostic accuracy (95%CI:0.6575-0.75).

Discussion: This study establishes TPRI as a novel biomarker for CDK4/6 inhibitor response prediction, validated through multi-omics integration and qPCR confirmation. The model provides actionable risk stratification, where high-risk patients may benefit from combinatorial mTOR-targeted therapies. Limitations include sample size constraints for methylation integration. Future studies should validate these findings in prospective clinical trials.

Keywords: CDK 4/6 inhibitors; TCGA; TPRI; breast cancer; prognostic model; single-cell sequencing; transcriptional regulation.


Conflict of interest statement

The authors declare that the research was conducted in the absence of any commercial or financial relationships that could be construed as a potential conflict of interest.

Figures

Figure 1
Figure 1
The workflow of this study.
Figure 2
Figure 2
Distribution of regulator expression activity in cells. (A) Single-cell UMAP clustering, shown according to the distribution of samples. (B) UMAP showing the distribution of regulator expression activity in cells.
Figure 3
Figure 3
Selection of optimal cutoff value.
Figure 4
Figure 4
Survival analysis for training and validation sets. (A) Comparison of survival curves between high and low risk groups of TCGA-BRCA. (B) Comparison of survival curves between high and low risk groups of GSE186901.
Figure 5
Figure 5
Visualization of genomic features associated with CDK4/6 therapeutic response. (A) Genomic mutation map of TCGA-BRCA, from top to bottom, the first part is the distribution of TMB, the second part is the mutation status, and the third part is the distribution of CNA in the genome. (B) GSE186901 according to the PD grouping, 0 is the response to the treatment, and 1 is the non-response to the treatment, the distribution of the TPRI value of both groups. (C) Genomic mutation map of patients aged 60 years or above in TCGA data. (D) Genomic mutation map of patients under 60 years old; E: high and low risk of patients over 60 years old. (F) mRNAsi distribution of high- and low-risk groups of patients under 60 years old.
Figure 6
Figure 6
Visualization of the contribution of TPRI to the characterization of different transcriptomes, epigenomes and miRNAs. (A) The first 20 GO enrichment results of differential genes. (B) Network diagram of miRNAs and their target genes enriched in the high-risk group. (C) Network diagram of miRNAs and their target genes enriched in the low-risk group. (D) KEGG pathway enrichment of miRNA targets in the low-risk group. (E) KEGG pathway enrichment of miRNA targets in the high-risk group. (F) Heat map of differentially methylated sites.
Figure 7
Figure 7
Logistic regression model. (A) ROC curves showing the predictive power of the three models. (B) Calibration plots showing the consistency of the predicted probabilities of the evaluation models with the actual frequency of observations.
Figure 8
Figure 8
Expression of genes in single cells. Box plot of prognostic gene expression in control and resistant. (A) Comparison of the expression in resistant and control MCF7 cell lines from GSE130437 dataset. (B) Comparison of the expression in resistant and control MDAMB231 cell lines from GSE130437 dataset. (C) Comparison of the expression in resistant and control MCF7 cell lines from GSE222367 dataset. (D) Comparison of the expression in resistant and control T47D cell lines from GSE222367 dataset.
Figure 9
Figure 9
Expression of genes was verified using qRT-PCR. ***P < 0.001, ****P <0.0001.

Similar articles

References

    1. Coles CE, Earl H, Anderson BO, Barrios CH, Bienz M, Bliss JM, et al. The lancet breast cancer commission. Lancet. (2024) 403:1895–950. doi: 10.1016/S0140-6736(24)00747-5, PMID: - DOI - PubMed
    1. Spring LM, Wander SA, Andre F, Moy B, Turner NC, Bardia A. Cyclin-dependent kinase 4 and 6 inhibitors for hormone receptor-positive breast cancer: past, present, and future. Lancet. (2020) 395:817–27. doi: 10.1016/S0140-6736(20)30165-3, PMID: - DOI - PubMed
    1. Cejalvo Andújar JM, Ayala de la Peña F, Margeli Vila M, Pascual J, Tolosa P, Pages C, et al. Optimizing therapeutic approaches for HR+/HER2- advanced breast cancer: clinical perspectives on biomarkers and treatment strategies post-CDK4/6 inhibitor progression. Cancer Drug Resist. (2025) 8:5. doi: 10.20517/cdr.2024.169, PMID: - DOI - PMC - PubMed
    1. Pernas S, Tolaney SM, Winer EP, Goel S. CDK4/6 inhibition in breast cancer: current practice and future directions. Ther Adv Med Oncol. (2018) 10:1758835918786451. doi: 10.1177/1758835918786451, PMID: - DOI - PMC - PubMed
    1. Shanabag A, Armand J, Son E, Yang HW. Targeting CDK4/6 in breast cancer. Exp Mol Med. (2025) 57:312–22. doi: 10.1038/s12276-025-01395-3, PMID: - DOI - PMC - PubMed

LinkOut - more resources