

Associations between pulmonary function and depression: evidence from the CHARLS cohort 2015-2018
- PMID: 40746696
- PMCID: PMC12310457
- DOI: 10.3389/fpubh.2025.1551356
Associations between pulmonary function and depression: evidence from the CHARLS cohort 2015-2018
Abstract
Background: The relationship between lung function and depression in middle-aged and older adults remains poorly understood. To address this knowledge gap, we conducted cross-sectional and longitudinal analyses using data from the nationally representative China Health and Retirement Longitudinal Study (CHARLS) to examine the association between peak expiratory flow (PEF) status and depression among middle-aged and older Chinese adults.
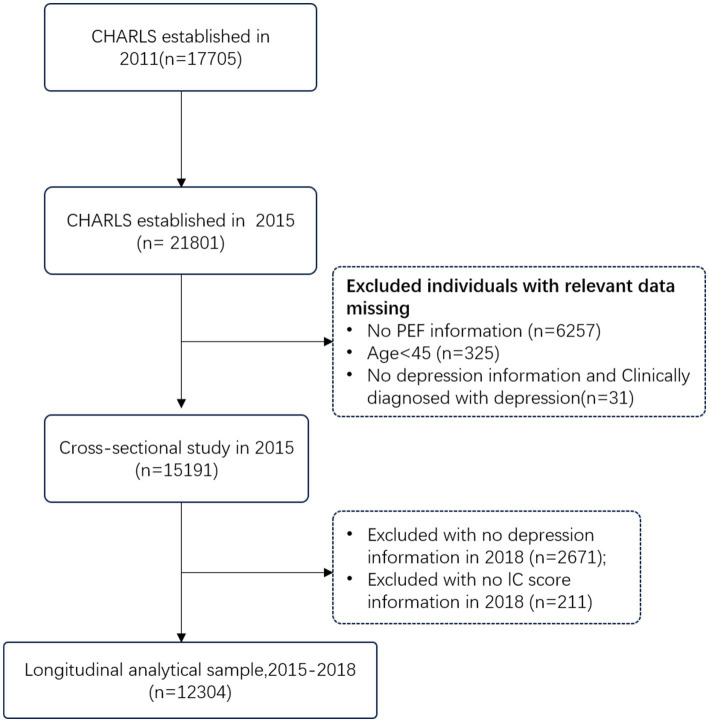
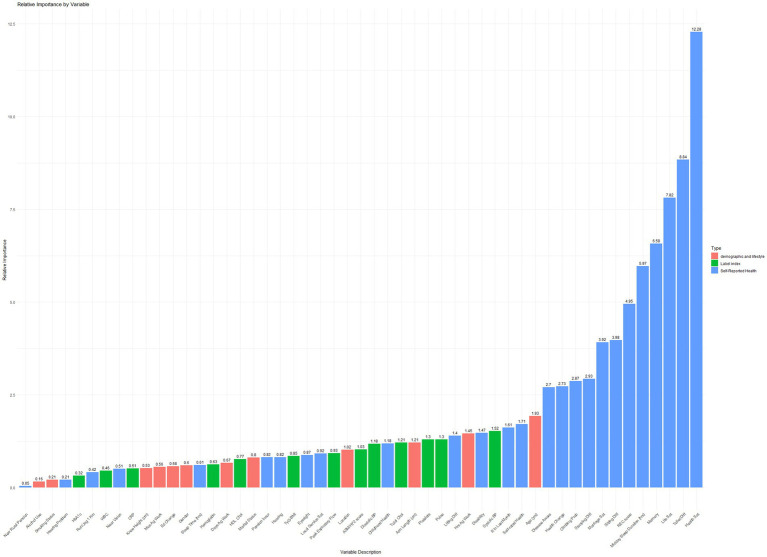
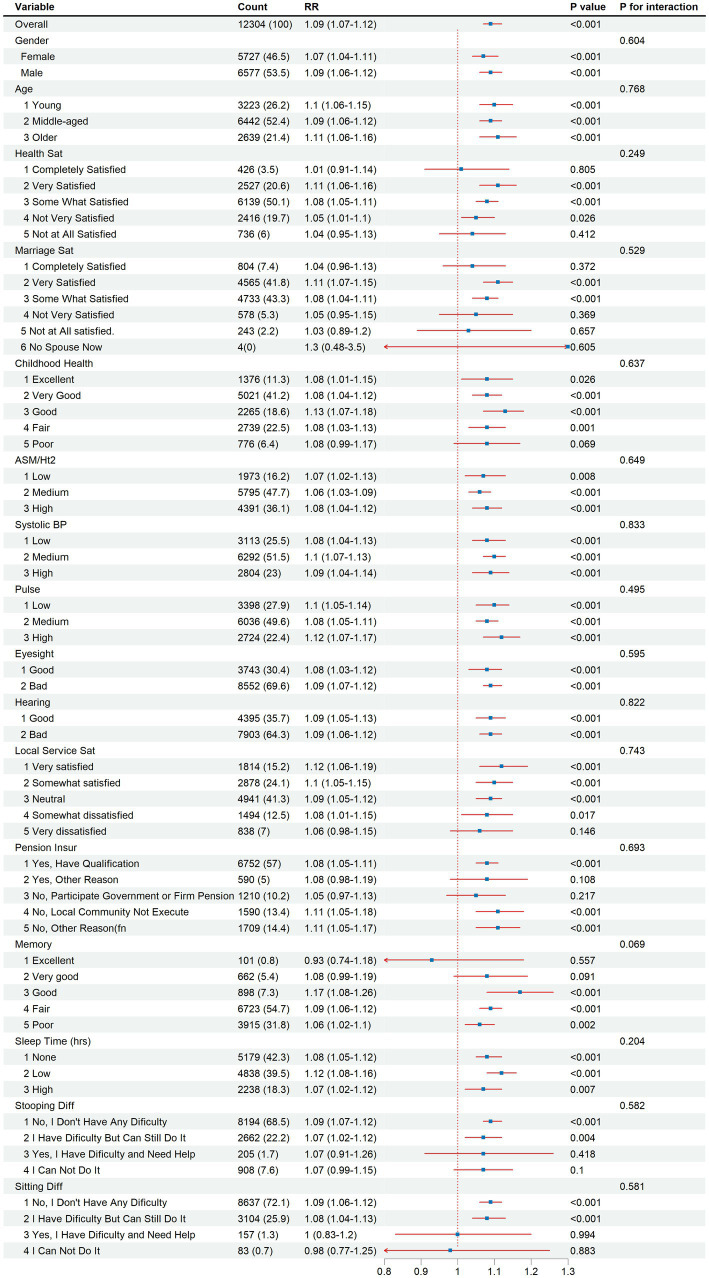
Methods: A total of 15,137 participants aged 45 years and older were included from the 2015 China Health and Retirement Longitudinal Study (CHARLS). Participants were categorized into three PEF status groups based on their percentage of predicted PEF: severe impairment (<80%), average lung function (80-100%), and good lung function (≥100%). A total of 12,304 participants were included in the longitudinal analysis from 2015 to 2018. To address potential confounding, propensity score matching was employed using a gradient-boosting model to balance covariates between participants with and without depression. Logistic regression analyses as well as restricted cubic spline (RCS) regression analyses were performed to examine the association between (PEF) status and depression incidence.
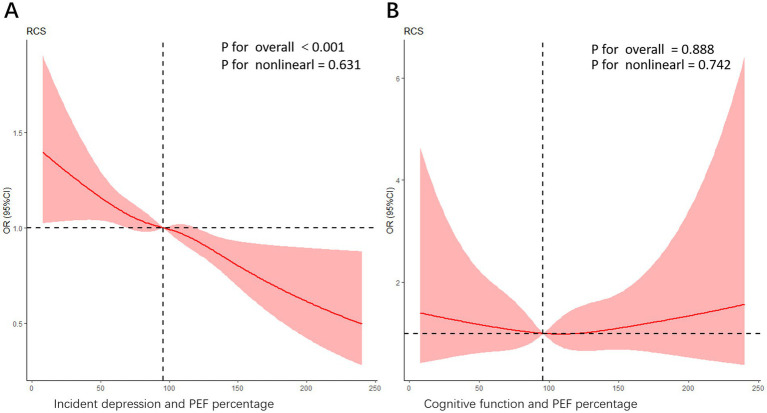
Findings: The prevalence of depression was 9.53% (n = 1,044) in the cross-sectional sample, with higher rates observed in participants with poorer lung function (9.53, 7.11, and 5.03% for good, moderately good, and poorer lung function, respectively). During a 3.6-year follow-up, 6.73% (n = 130) of participants developed depression. Fully adjusted logistic regression analysis demonstrated a significant inverse linear association between PEF percentage and depression risk (OR: 0.898, 95% CI: 0.862-0.935, per 1 SD increase). These findings were corroborated by restricted cubic spline (RCS) regression analysis, which revealed a linear relationship without evidence of nonlinearity (P for nonlinearity = 0.631).
Conclusion: Our study revealed a noteworthy correlation between PEF percentage and depression among the middle-aged and older population. The PEF percentage emerges as a valuable tool that may enhance the primary prevention and treatment of depression.
Keywords: CHARLS; cognitive; depression; peak expiratory flow; prospective cohort study.
Copyright © 2025 Yang, Cao, Huang, Xie, Zhou, Wang and Wen.
Conflict of interest statement
The authors declare that the research was conducted in the absence of any commercial or financial relationships that could be construed as a potential conflict of interest.
Figures
References
-
- GBD 2019 Mental Disorders Collaborators . Global, regional, and national burden of 12 mental disorders in 204 countries and territories, 1990-2019: a systematic analysis for the global burden of disease study 2019. Lancet Psychiatry. (2022) 9:137–50. doi: 10.1016/S2215-0366(21)00395-3, PMID: - DOI - PMC - PubMed
MeSH terms
LinkOut - more resources
Full Text Sources
Medical
Miscellaneous