

Epidemiological characteristics of acute viral and mycoplasma respiratory infections in Yongzhou, China: a retrospective descriptive study
- PMID: 40746698
- PMCID: PMC12310726
- DOI: 10.3389/fpubh.2025.1614985
Epidemiological characteristics of acute viral and mycoplasma respiratory infections in Yongzhou, China: a retrospective descriptive study
Abstract
Background: Acute respiratory infections (ARIs) are major global public health concerns. Understanding the epidemiological characteristics and evolution patterns of respiratory pathogens before and after the coronavirus disease 2019 (COVID-19) pandemic is crucial for disease control and prevention. This study identified the epidemiological characteristics and pathogen distribution in hospitalized patients with ARIs in Yongzhou, China.
Methods: A retrospective analysis was conducted on 10,728 hospitalized patients with ARIs at a tertiary hospital in Yongzhou, China, from January 2019 to June 2024. Respiratory specimens were tested using standardized protocols including multiplex real-time PCR for detecting common respiratory pathogens (FluA and FluB, RSV, ADV, HRV, and MP) and next-generation sequencing for additional pathogen identification when clinically indicated. Statistical analyses included descriptive statistics for demographic and clinical characteristics, and chi-square tests for comparing categorical variables across different age groups, seasons, and time periods.
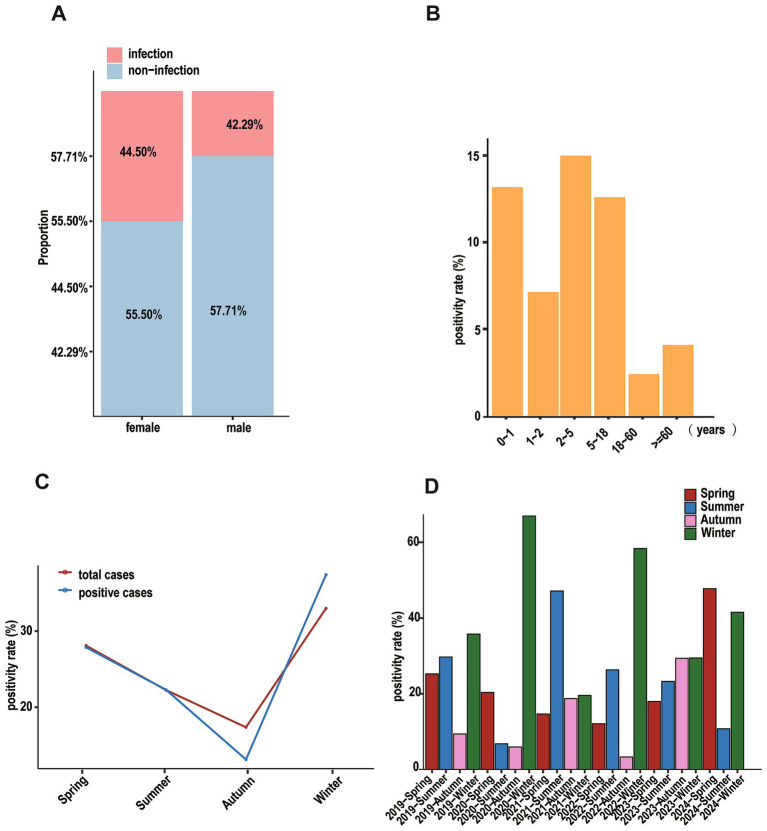
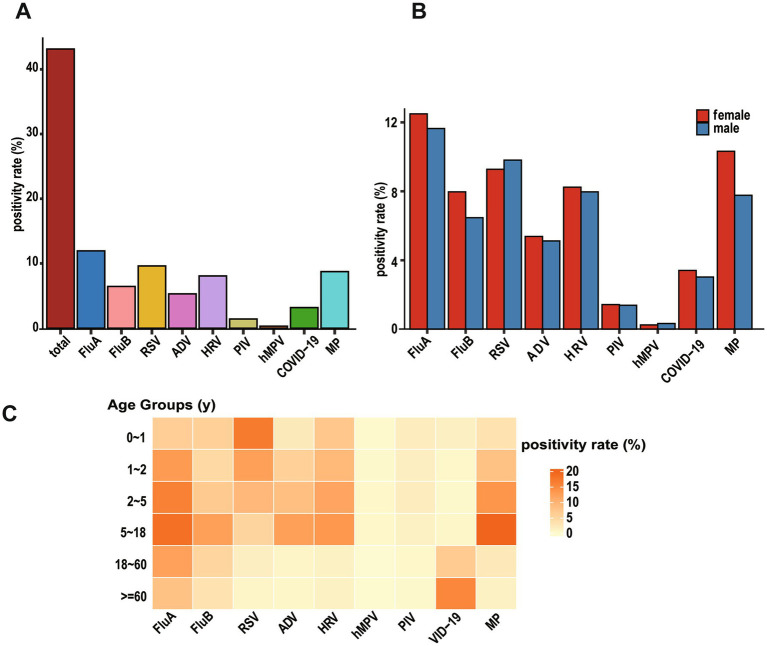
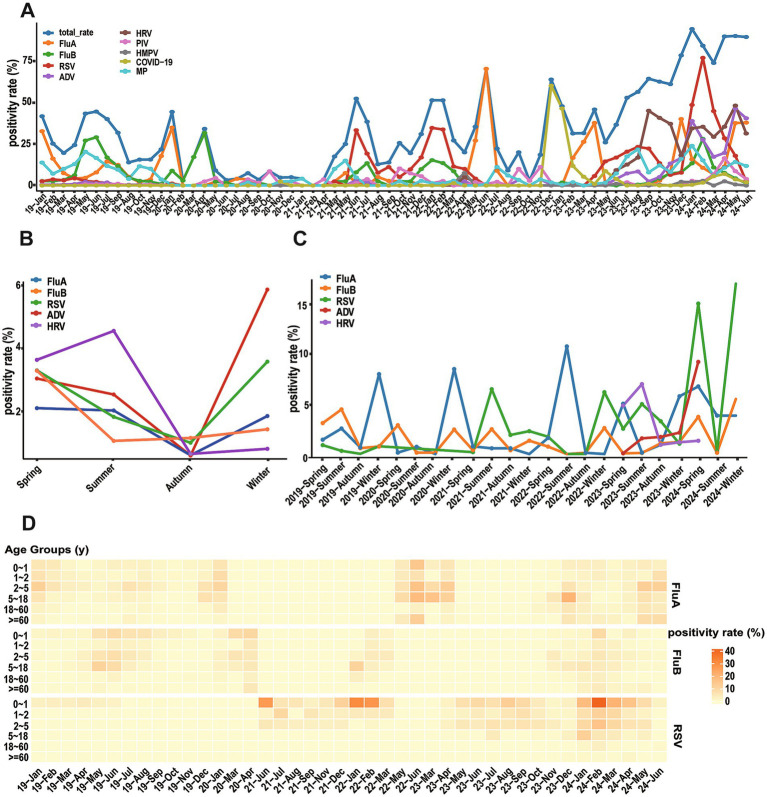
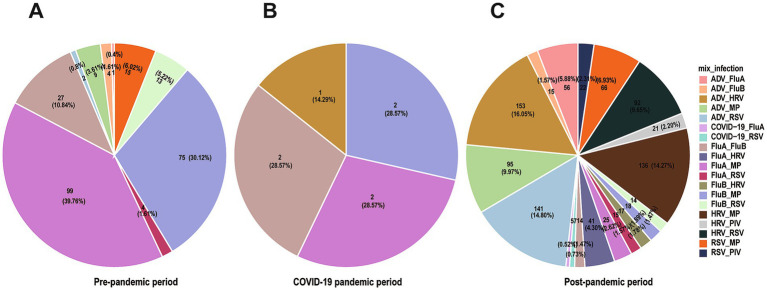
Results: Overall, 43.12% (4,626/10,728) of samples were positive for at least one pathogen. The most frequently detected pathogens were FluA (11.95%), RSV (9.61%), and MP (8.73%). RSV primarily affected children under 5 years (38.63% of RSV cases), while SARS-CoV-2 showed higher detection rates in older adult populations (64.81% of COVID-19 cases). Co-infections were found in 23.76% (1,099/4,626) of positive samples, with preschool children (2-5 years) showing the highest rate at 32.58%. MP (n = 398, 36.21% of all co-infections) with HRV (n = 338, 30.76% of all co-infections) were the most frequently detected pathogens in co-infections. Significant seasonal variations were observed, with winter showing the highest pathogen detection rates (49.04%, p < 0.001), and seasonal patterns changed notably during the COVID-19 pandemic. The frequency and patterns of co-infections showed marked differences across pre-pandemic, pandemic, and post-pandemic (January 2023-June 2024) periods. Co-infections occurred in 1,209 cases, with significant differences across study periods: 20.6% in pre-pandemic, 0.6% during pandemic, and 78.8% in post-pandemic periods (p < 0.001).
Conclusion: This study revealed distinct age-dependent and seasonal distribution patterns of respiratory pathogens in Yongzhou, China. The significant changes in pathogen circulation dynamics before, during, and after the COVID-19 pandemic highlight the importance of continuous surveillance of respiratory viruses. These findings provide valuable insights for optimizing local ARI prevention and treatment services.
Keywords: COVID-19; acute respiratory infections; co-infections; epidemic characteristics; respiratory pathogens.
Copyright © 2025 Jiang, Lu, Tan, Wan, Tang, Li, Zhou and Tang.
Conflict of interest statement
The authors declare that the research was conducted in the absence of any commercial or financial relationships that could be construed as a potential conflict of interest.
Figures
Similar articles
-
Epidemiological characteristics of six common respiratory pathogen infections in children.Microbiol Spectr. 2025 Jul;13(7):e0007925. doi: 10.1128/spectrum.00079-25. Epub 2025 May 22. Microbiol Spectr. 2025. PMID: 40401960 Free PMC article.
-
Changes in the epidemic patterns of respiratory pathogens of children in guangzhou, China during the COVID-19 pandemic.BMC Infect Dis. 2025 Jul 1;25(1):833. doi: 10.1186/s12879-025-11215-8. BMC Infect Dis. 2025. PMID: 40597730 Free PMC article.
-
Epidemiological association of the COVID-19 pandemic on Mycoplasma pneumoniae infections in children in Tianjin, China: a single-centre retrospective study (2017-2024).BMJ Open. 2025 Jun 17;15(6):e101045. doi: 10.1136/bmjopen-2025-101045. BMJ Open. 2025. PMID: 40527576 Free PMC article.
-
Physical interventions to interrupt or reduce the spread of respiratory viruses.Cochrane Database Syst Rev. 2023 Jan 30;1(1):CD006207. doi: 10.1002/14651858.CD006207.pub6. Cochrane Database Syst Rev. 2023. PMID: 36715243 Free PMC article.
-
Antibody tests for identification of current and past infection with SARS-CoV-2.Cochrane Database Syst Rev. 2022 Nov 17;11(11):CD013652. doi: 10.1002/14651858.CD013652.pub2. Cochrane Database Syst Rev. 2022. PMID: 36394900 Free PMC article.
References
-
- van Doorn HR, Yu H. Viral respiratory infections In: Hunter's tropical medicine and emerging infectious diseases: Elsevier; (2020). 284–8. doi: 10.1016/B978-0-323-55512-8.00033-8 - DOI
MeSH terms
LinkOut - more resources
Full Text Sources
Medical
Miscellaneous