. 2025 Jul 17:16:1640192.
doi: 10.3389/fphar.2025.1640192. eCollection 2025.

Machine learning-enhanced discovery of tsRNA-mRNA regulatory networks: identifying novel diagnostic biomarkers and therapeutic targets in breast cancer

Affiliations

Machine learning-enhanced discovery of tsRNA-mRNA regulatory networks: identifying novel diagnostic biomarkers and therapeutic targets in breast cancer

Zhongling Ma et al. Front Pharmacol. .

Abstract

Background: Transfer RNA-derived small RNAs (tsRNAs) represent an emerging class of regulatory molecules with potential as cancer biomarkers. However, their diagnostic utility and regulatory mechanisms in breast cancer remain poorly characterized. This study integrates machine learning algorithms with traditional molecular biology approaches to identify tsRNA-based diagnostic signatures and their downstream targets.

Methods: We analyzed miRNA-seq data from 103 matched tumor-normal pairs from TCGA-BRCA as the discovery cohort and GSE117452 as validation. tsRNA profiles were extracted using a custom bioinformatics pipeline. Random forest algorithm was employed to develop a diagnostic model. Correlation analysis and RNAhybrid were used to identify tsRNA-mRNA regulatory relationships. Comprehensive multi-omics analyses including survival, immune infiltration, drug sensitivity, and pathway enrichment were performed for identified targets. Functional validation was conducted in breast cancer cell lines.

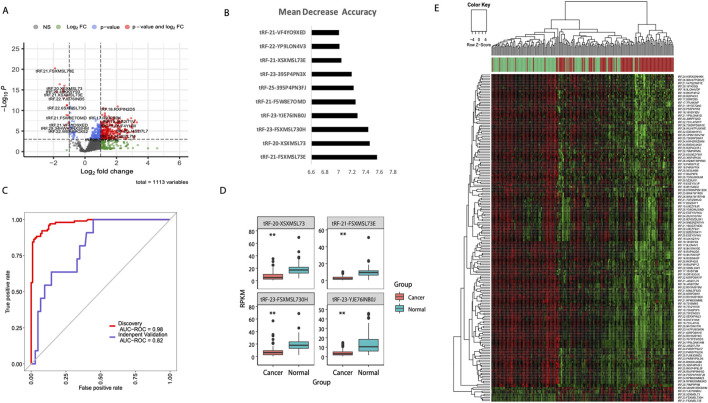
Results: We identified 297 differentially expressed tsRNAs and developed a four-tsRNA signature (tRF-21-FSXMSL73E, tRF-20-XSXMSL73, tRF-23-FSXMSL730H, tRF-23-YJE76INB0J) achieving AUC of 0.98 in discovery and 0.82 in validation cohorts. tRF-21-FSXMSL73E showed strong correlation with FAM155B expression. Pan-cancer analysis revealed FAM155B overexpression in multiple malignancies with prognostic significance. FAM155B correlated with immune infiltration, drug resistance, and activation of oncogenic pathways. Functional studies confirmed FAM155B promotes breast cancer proliferation and migration.

Conclusion: Our machine learning approach successfully identified a robust tsRNA diagnostic signature and uncovered the tsRNA-FAM155B regulatory axis as a novel therapeutic target. This integrated methodology provides a framework for accelerating biomarker discovery by combining computational prediction with traditional validation, advancing precision medicine in breast cancer.

Keywords: FAM155B; biomarker discovery; breast cancer; machine learning; tsRNA.


Conflict of interest statement

The authors declare that the research was conducted in the absence of any commercial or financial relationships that could be construed as a potential conflict of interest.

Figures

FIGURE 1
FIGURE 1
Machine learning-based identification of diagnostic tsRNA signatures in breast cancer. (A) Volcano plot showing differential expression of 1,113 tsRNAs between breast tumor (n = 103) and adjacent normal tissues (n = 103) from TCGA-BRCA cohort. Red dots indicate significantly upregulated tsRNAs and blue dots indicate downregulated tsRNAs (adjusted p < 0.05, |log2FC| > 1). (B) Random forest feature importance ranking of the top 10 tsRNAs based on mean decrease accuracy. (C) Receiver operating characteristic (ROC) curves demonstrating diagnostic performance of the four-tsRNA signature in the TCGA discovery cohort (AUC = 0.98) and independent validation cohort GSE117452 (AUC = 0.82). (D) Box plots showing expression levels of the four signature tsRNAs (tRF-21-FSXMSL73E, tRF-20-XSXMSL73, tRF-23-FSXMSL730H, and tRF-23-YJE76INB0J) in cancer versus normal tissues. **P < 0.01; ***P < 0.001. (E) Heatmap with hierarchical clustering of differentially expressed tsRNAs clearly separating tumor (red) and normal (green) samples. Color scale represents z-score normalized expression values.
FIGURE 2
FIGURE 2
Pan-cancer expression analysis of FAM155B. (A) FAM155B mRNA expression levels across 33 cancer types in TCGA dataset. Tumor samples are shown in yellow and normal tissues in blue. (B) Comparison of FAM155B expression between tumor and normal tissues integrating TCGA and GTEx databases. (C) FAM155B expression levels across 30 different cancer cell line types from the CCLE database, grouped by tissue of origin. *P < 0.05, **P < 0.01, ***P < 0.001.
FIGURE 3
FIGURE 3
Association of FAM155B expression with pathological stages across multiple cancer types. Box plots showing FAM155B expression levels across different pathological stages in multiple cancer types. From left to right, the first row includes ACC, BLCA, BRCA, CHOL, and COAD; the second row includes ESCA, HNSC, KICH, KIRC, and KIRP; the third row includes LIHC, LUAD, LUSC, MESO, and PAAD; and the fourth row includes READ, SKCM, STAD, TGCT, and UVM. Statistical significance was determined using the Kruskal–Wallis test followed by Dunn’s post hoc test.
FIGURE 4
FIGURE 4
Association of FAM155B expression with overall survival in pan-cancer analysis. (A) Forest plot showing hazard ratios for the relationship between FAM155B expression and overall survival across 33 cancer types. (B–G) Kaplan-Meier survival curves comparing overall survival between FAM155B high and low expression groups in selected cancer types. P-values were calculated using log-rank test.
FIGURE 5
FIGURE 5
Association of FAM155B expression with progression-free interval in pan-cancer analysis. (A) Forest plot showing hazard ratios for the relationship between FAM155B expression and progression-free interval across 33 cancer types. (B–G) Kaplan-Meier curves comparing progression-free interval between FAM155B high and low expression groups in selected cancer types. P-values were calculated using log-rank test.
FIGURE 6
FIGURE 6
FAM155B expression correlates with tumor microenvironment features. (A) Heatmap showing correlations between FAM155B expression and 15 tumor microenvironment processes across multiple cancer types. (B) Box plots comparing tumor microenvironment scores between FAM155B high and low expression groups in breast cancer. *P < 0.05; **P < 0.01; ***P < 0.001; ns, not significant.
FIGURE 7
FIGURE 7
FAM155B expression is associated with immune cell infiltration patterns. (A) Heatmap showing correlations between FAM155B expression and infiltration of 22 immune cell types across pan-cancer analysis. (B) Box plots showing differences in immune cell proportions between FAM155B high and low expression groups in breast cancer. *P < 0.05; **P < 0.01; ***P < 0.001; ns, not significant.
FIGURE 8
FIGURE 8
Correlation of FAM155B expression with immune regulatory genes. Heatmaps showing correlations between FAM155B expression and (A) chemokine genes, (B) immune checkpoint genes, (C) immunoinhibitor genes, (D) immunostimulator genes, (E) MHC genes, and (F) receptor genes across multiple cancer types. *P < 0.05; **P < 0.01; ***P < 0.001.
FIGURE 9
FIGURE 9
FAM155B expression correlates with TMB, MSI, and drug sensitivity. (A) Correlation between FAM155B expression and tumor mutational burden (TMB) across cancer types. (B) Correlation between FAM155B expression and microsatellite instability (MSI). (C) Correlation between FAM155B expression and neoantigen load (NEO). (D) Drug sensitivity analysis showing correlations between FAM155B expression and IC50 values of selected anticancer drugs. *P < 0.05; **P < 0.01; ***P < 0.001.
FIGURE 10
FIGURE 10
Pathway enrichment analysis of FAM155B in breast cancer. (A) GSVA analysis showing correlation between FAM155B expression and hallmark pathway activities. (B) GSEA plots showing enrichment of selected pathways in FAM155B high expression group.
FIGURE 11
FIGURE 11
WGCNA identifies FAM155B-associated gene modules in breast cancer. (A) Module-trait relationship heatmap showing correlation between gene modules and FAM155B expression. (B) GO biological process enrichment analysis of genes in the brown module. (C) KEGG pathway enrichment analysis of genes in the brown module.
FIGURE 12
FIGURE 12
Prognostic nomogram integrating FAM155B expression with clinical parameters. (A) Nomogram for predicting 3- and 5-year overall survival in breast cancer patients based on FAM155B expression, age, stage, and gender. (B) Calibration curves showing agreement between predicted and observed 3- and 5-year survival probabilities.
FIGURE 13
FIGURE 13
FAM155B knockdown inhibits breast cancer cell proliferation and colony formation. (A) qRT-PCR and (B) Western blot analysis confirming FAM155B knockdown efficiency in MDA-MB-231 and MDA-MB-453 cells. (C) qRT-PCR confirming FAM155B overexpression. (D) Colony formation assay showing reduced colony numbers following FAM155B knockdown. (E) Colony formation assay showing increased colony numbers following FAM155B overexpression. **P < 0.01.
FIGURE 14
FIGURE 14
FAM155B promotes breast cancer cell migration and tumor growth. (A) Wound healing assay demonstrating reduced migration in FAM155B knockdown cells. (B) Wound healing assay showing enhanced migration in FAM155B overexpressing cells. (C) Representative images of xenograft tumors from mice injected with control or FAM155B knockdown cells. (D) Tumor growth curves and final tumor weights showing reduced tumor growth following FAM155B knockdown. *P < 0.05; **P < 0.01.

Similar articles

References

    1. Botticelli A., Scagnoli S., Roberto M., Lionetto L., Cerbelli B., Simmaco M., et al. (2020). 5-Fluorouracil degradation rate as a predictive biomarker of toxicity in breast cancer patients treated with capecitabine. J. Oncol. Pharm. Pract. 26 (8), 1836–1842. 10.1177/1078155220904999 - DOI - PubMed
    1. Duan H., Zhang Y., Qiu H., Fu X., Liu C., Zang X., et al. (2024). Machine learning-based prediction model for distant metastasis of breast cancer. Comput. Biol. Med. 169, 107943. 10.1016/j.compbiomed.2024.107943 - DOI - PubMed
    1. Fu X., Ma W., Zuo Q., Qi Y., Zhang S., Zhao Y. (2024). Application of machine learning for high-throughput tumor marker screening. Life Sci. 348, 122634. 10.1016/j.lfs.2024.122634 - DOI - PubMed
    1. Grešová K., Alexiou P., Giassa I. C. (2022). Small RNA targets: advances in prediction tools and high-throughput profiling. Biology 11 (12), 1798. 10.3390/biology11121798 - DOI - PMC - PubMed
    1. Gu X., Zhang Y., Qin X., Huang Y., Ju S. (2022). Transfer RNA-derived small RNA: an emerging small non-coding RNA with key roles in cancer. Exp. Hematol. and Oncol. 11 (1), 35. 10.1186/s40164-022-00290-1 - DOI - PMC - PubMed

LinkOut - more resources