Clinical Trial
. 2025 May 11;2(3):100110.
doi: 10.1016/j.bneo.2025.100110. eCollection 2025 Aug.

Dose escalation study of the HLA-A2-WT1 CD3 bispecific antibody RO7283420 in relapsed/refractory acute myeloid leukemia

Affiliations
Clinical Trial

Dose escalation study of the HLA-A2-WT1 CD3 bispecific antibody RO7283420 in relapsed/refractory acute myeloid leukemia

Martin Hutchings et al. Blood Neoplasia. .

Abstract

A novel T-cell bispecific antibody (TCB), RO7283420, engaging CD3 and the HLA-A2-Wilms tumor protein 1 complex, was evaluated in this phase 1 study to characterize safety and tolerability, determine the maximum tolerated dose (MTD), and recommend a phase 2 dose for patients with relapsed/refractory acute myeloid leukemia in 2 groups: hematologic (group I, n = 57) and molecular (group 2, n = 5) relapse. In group I, 51 received RO7283420 intravenously (IV) and 6 subcutaneously. The IV doses ranged from 0.15-4 mg (flat; n = 13), 3-18 mg (step-up; n = 34) every 3 weeks, or 9 mg weekly (step-up; n = 4). The MTD was 1/3/12 mg every 3 weeks. The most frequent adverse event in the overall population was cytokine release syndrome (61.3%) with grade ≥3 recorded in 9.7% of patients. Twelve dose-limiting toxicities were reported in 11 patients and 12 (19.4%) grade 5 adverse events, including 1 hemophagocytic lymphohistiocytosis case related to RO7283420. Among the 42 efficacy-evaluable IV patients in group I, 4.8% achieved complete remission (CR), and 2.4% achieved CR with incomplete hematologic recovery. RO7283420 induced pharmacodynamic changes in peripheral blood (PB) at doses ≥1 mg, including significant T-cell activation and expansion in the PB and bone marrow (BM). Significant associations were found between blast reduction and baseline immunophenotype, including lower regulatory T cells and higher non-exhausted CD8+ T cells in BM. Although dose escalation was discontinued because of limited efficacy and lack of an exposure-BM response relationship, the observed pharmacodynamics underscore the promising potential of this class of TCBs targeting intracellular antigens. This trial was registered at www.clinicaltrials.gov as #NCT04580121.


Conflict of interest statement

Conflict-of-interest disclosure: M.H. reports receiving research support for the institution from AbbVie, AstraZeneca, Bristol Myers Squibb (BMS)/Celgene, Genentech, Genmab, Incyte, Johnson & Johnson, Merck, Novartis, Roche, and Takeda; and receiving personal honoraria from AbbVie, AstraZeneca, Genmab, Johnson & Johnson, Merck, Roche, and Takeda. K.K. reports being an employee of and owning shares in F. Hoffmann-La Roche. P.M. reports receiving research support from AbbVie, Astellas, BMS, Daiichi Sankyo, Janssen, Novartis, Pfizer, and Teva; serving a consultancy role for Astellas, BMS, Daiichi Sankyo, and Glycomimetics; participating in speakers’ bureaus for AbbVie, Astellas, BMS, Daiichi Sankyo, Incyte, Janssen, Novartis, Pfizer, Sanofi, Servier, and Teva; and serving on advisory boards for AbbVie, Astellas, BMS, Daiichi Sankyo, Incyte, Janssen, Novartis, Pfizer, Sanofi, Servier, Syndax, and Teva. A.S. reports serving on advisory boards for Bayer, BMS, Eisai, Gilead, Merck Sharp & Dohme (MSD), Pfizer, and Servier; serving in a consultancy role for Incyte and Sanofi; and participating in speakers’ bureaus for AbbVie, Amgen, ArQule, AstraZeneca, Bayer, BeiGene, BMS/Celgene, Eisai, Gilead, Eli Lilly, MSD, Novartis, Pfizer, Roche, Sandoz, Servier, and Takeda. H.-A.H reports receiving a honorarium, travel support, and consultancy fees from Roche. S. Vives reports receiving travel support, accommodation, and expenses from AbbVie, Astellas, Jazz Pharmaceuticals, Pfizer, and Servier; receiving research funding from Astellas; and serving as a consultant or in an advisory role (without honoraria) for AbbVie, Astellas, Jazz Pharmaceuticals, Pfizer, and Servier. T.-Y.C. reports serving in a consultancy role for AbbVie, Amgen, BMS/Celgene, Janssen, and Sanofi. S. Garciaz reports serving in a consultancy or advisory role for AbbVie, Astellas, BMS/Celgene, Jazz Pharmaceuticals, and Servier; and receiving travel grants from Gilead. O.S.G. reports receiving honoraria from AbbVie, BMS, and Jazz Pharmaceuticals; serving in a consultancy role for AbbVie, BMS, and Astellas; serving on advisory boards for BMS and Novartis; and receiving travel support from Jazz Pharmaceuticals and Servier. S.-P.Y. received advisory board and/or lecture fees from AbbVie, Amgen, Astellas, Astex Pharmaceuticals, AstraZeneca, BeiGene, BMS, Janssen Pharmaceuticals, Novartis, Sanofi, and Takeda. K.Y. reports serving in a consultancy role for BMS/Celgene, F. Hoffmann-La Roche, GlaxoSmithKline (GSK), Jazz Pharmaceuticals, Novartis, Pfizer, Shattuck Labs, Taiho Oncology, and Takeda; receiving research funding from Astex Pharmaceuticals, F. Hoffmann-La Roche/Genentech, Forma Therapeutics, Geron Corporation, Gilead Sciences, Janssen, Jazz Pharmaceuticals, Novartis, and Treadwell Therapeutics; and receiving honoraria from AbbVie, Novartis, and Taiho. J.E. reports receiving research support from AbbVie, Jazz Pharmaceuticals, and Novartis; and providing scientific advice to AbbVie, Amgen, Astellas, BMS, Jazz Pharmaceuticals, Novartis, and Pfizer. A.B. reports receiving honoraria from AbbVie, Amgen, Astellas, Novartis, Pfizer, and Takeda; serving in an advisory role for Senti Bio and Shoreline; and participating in speakers’ bureaus for Amgen and BMS. S.F. reports serving in a consultancy role for Gilead; receiving research funding from Amgen; receiving honoraria from Amgen, BMS, Gilead, Novartis, Pfizer, and Servier; participating in speakers’ bureaus for Amgen, BMS, Gilead, Novartis, Pfizer, and Servier; and serving on the board of directors or advisory committees for Amgen, BMS, Gilead, Novartis, Pfizer, and Servier. A.C.B. reports being an employee of Roche Diagnostic GmbH and owning shares in F. Hoffmann-La Roche. J.A. reports being an employee of and owning shares in F. Hoffmann-La Roche and biotechnology funds, which may indirectly include pharmaceutical company shares. M. Sun, Y.M.M., G.S., H.Y., H.H., T.B., S.S., and S.N. report being employees of and owning shares in F. Hoffmann-La Roche. T.R. and S. Vauleon report being employees of F. Hoffmann-La Roche. C.K. reports being an employee of F. Hoffmann-La Roche at the time of the study and owning shares in F. Hoffmann-La Roche; and receiving patents/royalties from F. Hoffmann-La Roche. M.R. reports being an employee of F. Hoffmann-La Roche at the time of the study and owning shares in F. Hoffmann-La Roche. N.K. reports being an employee of and owning shares in F. Hoffmann-La Roche; and reports owning shares in Jazz Pharmaceuticals. M. Subklewe reports receiving research support from Amgen, BMS/Celgene, Gilead/Kite, Janssen, Miltenyi Biotec, Molecular Partners, Novartis, Roche, Seagen, Takeda; participating in speakers’ bureaus for AstraZeneca, BMS, Gilead/Kite, GSK, Janssen, Novartis, Pfizer, Roche, Springer Healthcare; serving in a consultancy role or on an advisory board for AbbVie, Amgen, Autolus, AvenCell, BMS, CanCell Therapeutics, Genmab US, Gilead, Ichnos Sciences, Incyte Biosciences, Interius BioTherapeutics, Janssen, Miltenyi Biomedicine, Molecular Partners, Nektar Therapeutics, Novartis, Orbital Therapeutics, Pfizer, Roche, Sanofi, Scare, Takeda; and receiving travel support from Gilead, Pfizer, and Roche. The remaining authors declare no competing financial interests.

Figures

None
Graphical abstract
Figure 1.
Figure 1.
Patient consort flow diagram. AML, acute myeloid leukemia; DSU, double step-up; IV, intravenous; Q3W, every 3 weeks; QW, every week; R/R, relapsed or refractory; SC, subcutaneous; SSU, single step-up.
Figure 2.
Figure 2.
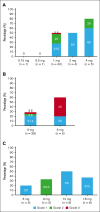
Incidence of maximum CRS grade by RO7283420 IV dose in group I patients. (A) At cycle 1 day 1. (B) At cycle 1 day 8 in patients who received previous 1 mg step-up dosing. (C) At cycle 1 day 15 in patients who received previous 1/3 mg DSU dosing. CRS, cytokine release syndrome; DSU, double step-up; IV, intravenous.
Figure 3.
Figure 3.
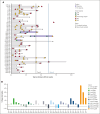
Duration of response and maximum blast count reduction in group I patients who received IV RO7283420. (A) Treatment follow-up and duration of response. (B) Maximum reduction from baseline in blast count in bone marrow. CR, complete remission; BL, baseline; CRi, complete remission with incomplete hematologic recovery; EOT, end of treatment; IV, intravenous; PD, progressive disease; SD, stable disease.
Figure 4.
Figure 4.
Pharmacokinetic profiles of RO7283420 in group I patients during cycle 1 following different dosing regimens. (A) Fixed IV dosing. (B) SSU dosing. (C) DSU IV dosing. (D) DSU SC dosing. DSU, double step-up; IV, intravenous; Q3W, every 3 weeks; QW, every week; SC, subcutaneous; SSU, single step-up.
Figure 5.
Figure 5.
Exposure-response analysis for blast count reduction in PB and BM for group I patients who received IV RO7283420. (A) Total blast count reduction. (B) Percentage blast count reduction. The dashed line represents a linear regression of the data, and the shaded area shows the corresponding 95% confidence interval. The patient marked with an asterisk (∗) has been retrospectively corrected from CR to NE. AUC, area under the curve; CR, complete remission; IV, intravenous; SD, stable disease; PD, progressive disease; NA, not available; NE, not evaluable.
Figure 6.
Figure 6.
On-treatment pharmacodynamics in PB and BM aspirates support the expected MoA of a TCB. (A) Cytokine dynamics with estimated mean change from baseline across all patients with valid data at a given time point. The error bars indicate the 95% confidence interval, and dashed lines indicate RO7283420 administration. (B) Scatter plots showing the cumAUC vs log2-transformed change from baseline of soluble CD25 (IL2SR) and CXCL10 plasma levels at the end of cycle 1 (FDR-adjusted P value <.1; Brownian distance covariance test). Dose scheme group with flat, SSU, and DSU indicated. (C,E) Heatmap of immunophenotype on-treatment changes in PB (C) and BM aspirates (E) of absolute cell counts per μL shown as the log2-transformed fold change (log2[FC]) from baseline. Significantly changed immunophenotypes are labelled with an x (unadjusted P value <.05; linear mixed-effects model [C]; paired t test for C3D1 vs baseline comparison [E]). Baseline value (cells/μL) for each marker is indicated by the color gradient, and immune cell subtypes are indicated by the color coding. Grey cells indicate data that are not available. All time points are samples drawn before the dose administration of the indicated cycle. (D,F) Volcano plots of immunophenotype on-treatment vs baseline changes of absolute cell counts/μL in PB (D) and BM (F) shown as effect size vs –log10 transformed P values (–log[pval]). Effect size is the estimated mean fold change from baseline (D) and Cohen’s D statistic at C3D1 vs baseline (F). Significantly expanded CD4+ and CD8+ T-cell populations are highlighted (unadjusted P value <.05 indicated by dashed horizontal line; linear mixed-effects model [D]; paired t test [F]). Cell subtypes are indicated by color coding. cumAUC, cumulative area under the curve; CxDx, Cycle x Day x; CM, central memory; CXCL10, C-X-C motif chemokine ligand 10; EM, effector memory; EMRA, terminally differentiated effector memory cells re-expressing CD45RA; FC, fold change; FDR, false discovery rate; IFNG, interferon gamma; INTLK, interleukin; MoA, mechanism of action; NK, natural killer; pre, pre-dose; post, post-dose 2 hours end of infusion; TCB, T-cell bispecific antibody; TNF, tumor necrosis factor; Treg, regulatory T cell.
Figure 7.
Figure 7.
Baseline biomarkers associated with blast reduction in BM and PB. (A) BM blast reduction-associated immunophenotype clusters identified in BM after UMAP dimensionality reduction and FlowSOM clustering of high-dimensional cellular immunophenotyping data at baseline (P value < .05; t test; n = 13). Cluster frequencies of significant CD4+ cluster 4 (CD4_C4) and CD8+ cluster 1 (CD8_C1) are shown (as % of parent) on logit-scaled axes; the mean is indicated by the line. Cluster composition based on manually gated immune cell subsets is shown within the plot as a colored stacked bar chart. (B) PB blast reduction–associated immunophenotype clusters identified in PB after UMAP dimensionality reduction and FlowSOM clustering of high-dimensional cellular immunophenotyping data at baseline (P value < .05; t test; n = 43). Cluster frequencies of significant CD8+ clusters 16, 6, and 1 (CD8_C16, CD8_C6, CD8_C1) are shown (as % of parent) on logit-scaled axes; the mean is indicated by the line. Cluster composition based on manually gated immune cell subsets is shown within the plot as a colored stacked bar chart. (C) Significantly expressed immune cell markers in each significant cluster from BM (panel A) and PB (panel B). The median marker intensity was tested for the respective cluster vs all other clusters (adjusted P value < .05; Wilcoxon rank sum test) and arrows indicate significant higher ↑ or lower ↓ intensity. Markers are ranked by significance; exhaustion markers are indicated in bold. (D) Baseline CD8 T-cell states in BM measured by scRNA-seq of BMMC samples (n = 14). Enrichment scores were calculated per cell and averaged per sample using previously described gene sets. (E) WT1 messenger RNA target expression in PB shown as (normalized copy number) NCN measured by quantitative reverse transcription polymerase chain reaction; the line indicates the median (n = 30). Samples with WT1 below the level of quantification (BLQ) are shown in red. The dashed line indicates the value above which WT1 is considered to be overexpressed in normal PB (NCN = 50). (F) Intracellular WT1 and cell surface HLA-A2 protein expression measured by flow cytometry in PB (left, n = 40) and BM (right, n = 27). Levels are shown as frequency (%) of blasts in PB or BM; the mean is indicated by the line and P values were determined after FDR adjustment (t test on logit-transformed values). (G) On-treatment dynamics of WT1+ (left) and HLA-A2+ (right) percentage of AML cells in BM measured by scRNA-seq of BMMC samples (n = 10). WT1+ / HLA-A+ cells defined by unique molecular identifier (UMI) >0; the color code indicates the clinical response at the time of sampling. (H) Distribution of %WT1+ cells within different AML subpopulations in BM at baseline as evaluated by scRNA-seq of BMMC samples (n = 14). WT1+ cells were defined by a UMI >0. (I) Change in AML subpopulations in BM at the time of progression as evaluated by scRNA-seq of BMMC samples (n = 9). Expansion defined as >5% increase relative to baseline; shrinkage defined as >5% decrease relative to baseline. (J) Percentage of WT1+/PSMB9+, WT1+/PSMB9−, and WT1− cells in expanding mono-like AML subpopulation at screening and the time point of disease progression as evaluated by scRNA-seq of BMMC samples (n = 9). WT1+ / PSMB9+ cells defined by a unique molecular identifier (UMI) >0. AML, acute myeloid leukemia; BMMC, bone marrow mononuclear cells; C, cluster; cDC, conventional dendritic cell; CM, central memory; CR, complete remission; CxDx, Cycle x Day x; EM, effector memory; FDR, false discovery rate; GMP, granulocyte-monocyte progenitors; hem., hematologic; LSPC, leukemia stem and progenitor cells; Mono, monocyte; NCN, normalized copy number; ProMono, pro-monocyte; PD, progressive disease; PSMB9, Proteasome 20S Subunit Beta 9; SCRN, screening; scRNA-seq, single-cell RNA sequencing; SD, stable disease; TEMRA, terminally differentiated effector memory cells re-expressing CD45RA; UMAP, Uniform Manifold Approximation and Projection; WT1, Wilms Tumor Protein 1.

References

    1. Döhner H, Wei AH, Appelbaum F, et al. Diagnosis and management of AML in adults: 2022 recommendations from an international expert panel on behalf of the ELN. Blood. 2022;140(12):1345–1377. - PubMed
    1. Stubbins R, Francis A, Kuchenbauer F, Sanford D. Management of acute myeloid leukemia: a review for general practitioners in oncology. Curr Oncol. 2022;29(9):6245–6259. - PMC - PubMed
    1. National Cancer Institute Surveillance, Epidemiology, and End Results Program Cancer stat facts: leukemia - acute myeloid leukemia (AML) https://seer.cancer.gov/statfacts/html/amyl.html
    1. Percival M-E, Estey E. Emerging treatments in acute myeloid leukemia: current standards and unmet challenges. Clin Adv Hematol Oncol. 2017;15(8):632–642. - PubMed
    1. Morris V, Ghazi H, Fletcher D, Guinn B. A direct comparison, and prioritisation, of the immunotherapeutic targets expressed by adult and paediatric acute myeloid leukaemia cells: a systematic review and meta-analysis. Int J Mol Sci. 2023;24(11):9667. - PMC - PubMed

Publication types

Associated data

LinkOut - more resources