

Identification of biomarkers between coronary artery disease and non-alcoholic steatohepatitis: a combination of bioinformatics and machine learning
- PMID: 40747105
- PMCID: PMC12310482
- DOI: 10.3389/fgene.2025.1573621
Identification of biomarkers between coronary artery disease and non-alcoholic steatohepatitis: a combination of bioinformatics and machine learning
Abstract
Background: Non-alcoholic steatohepatitis (NASH) commonly complicates coronary artery disease (CAD), yet the interaction mechanism remains unclear. Our research seeks to investigate the common mechanisms and key signature genes between CAD and NASH.
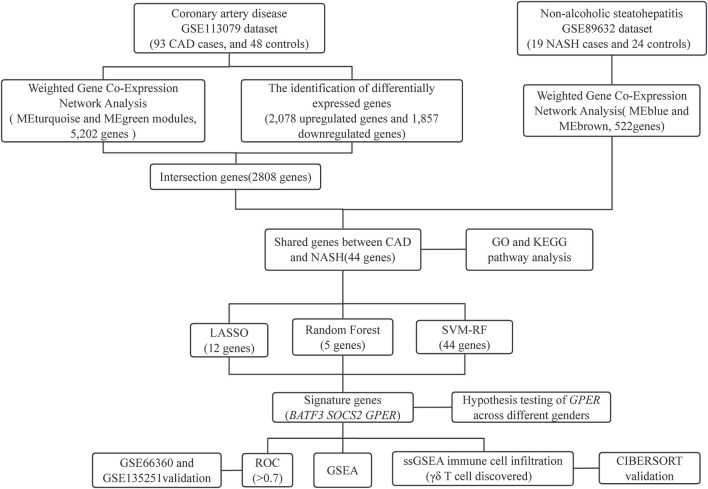
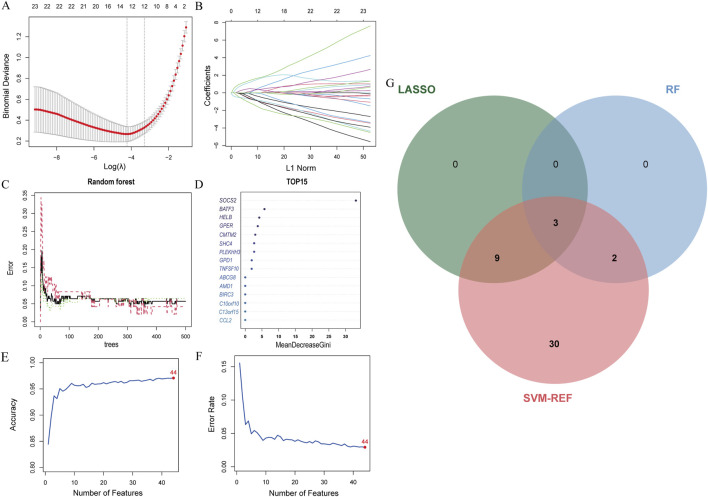
Methods: RNA sequence information for CAD and NASH was screened from the GEO database. Weighted gene co-expression network analysis (WGCNA) and differentially expressed gene analysis identified key genes, followed by functional enrichment analysis of these shared genes. Three machine learning methods-LASSO, random forest, and SVM-RFE-were used to identify signature genes. Gene set enrichment analysis (GSEA) was then performed to explore potential mechanisms associated with the signature genes. In addition, single-sample gene set enrichment analysis (ssGSEA) evaluated immune infiltration in CAD and NASH and its correlation with the signature genes.
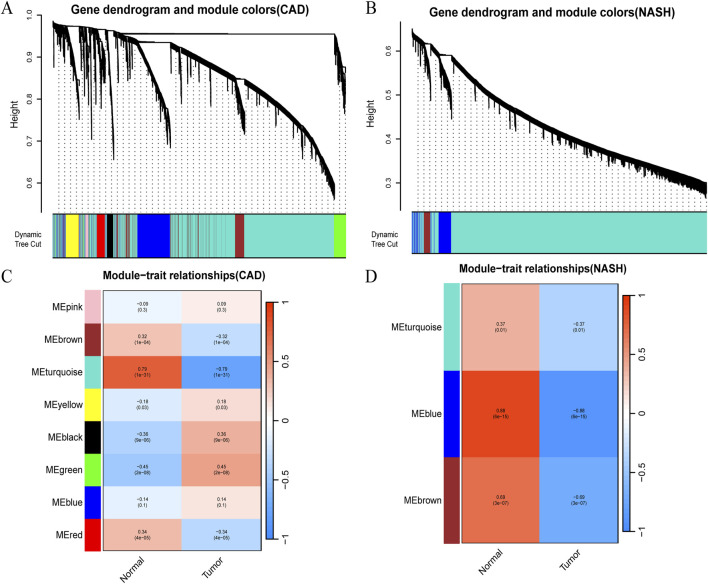
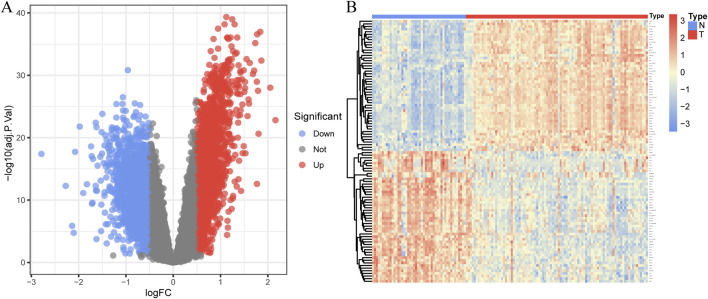
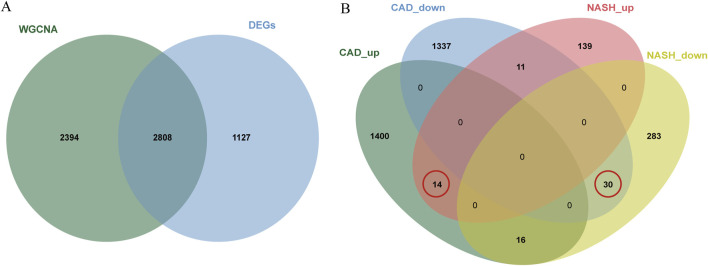
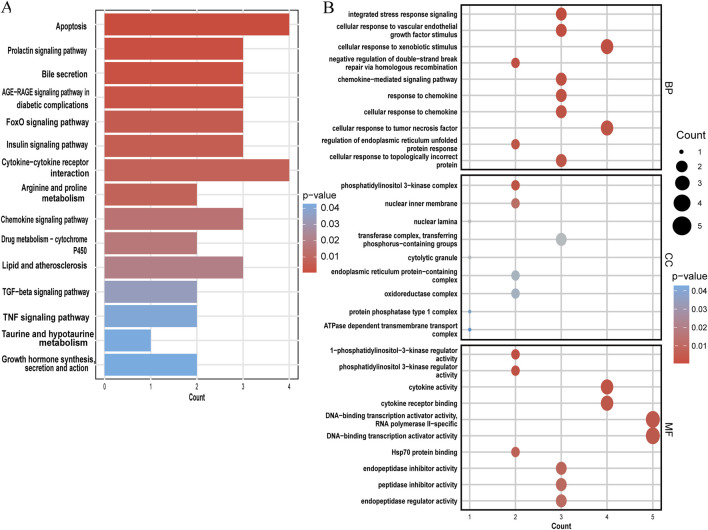
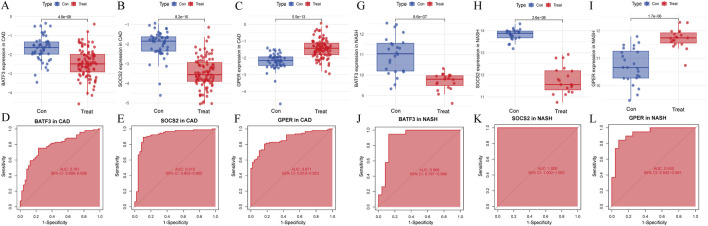
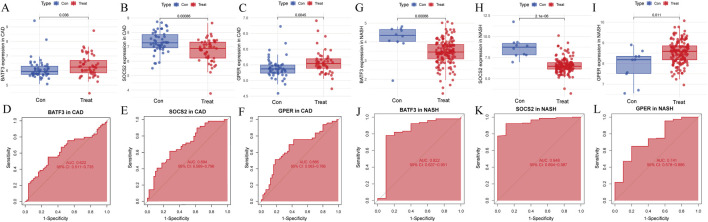
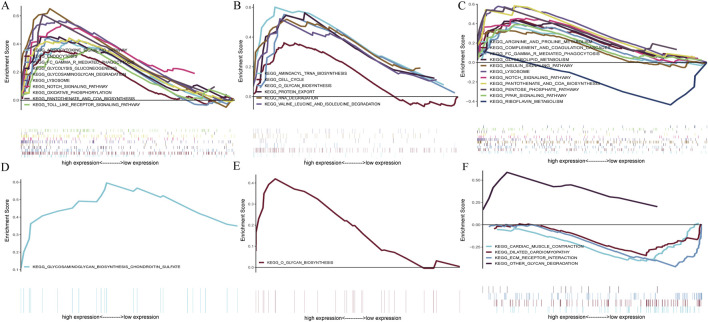
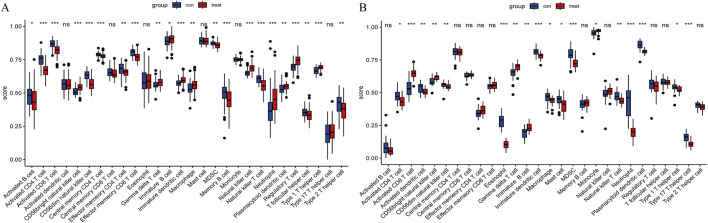
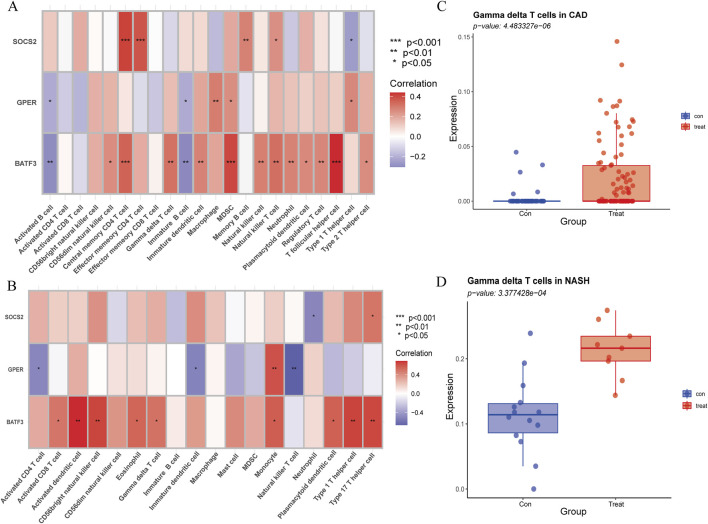
Results: WGCNA has revealed two key modules for CAD and NASH. The intersection of the CAD modules and their differential genes narrowed the key genes down to 2,808 shared genes. Finally, 44 shared genes were selected for both CAD and NASH. Kyoto Encyclopedia of Genes and Genomes analysis showed that these genes were primarily enriched in insulin resistance and inflammation pathways. Machine learning identified the signature genes BATF3, SOCS2, and GPER, all with ROC values above 0.7, validated in external datasets. GSEA revealed that these genes act through common mechanisms in CAD and NASH, regulating metabolic, inflammatory, and cardiovascular pathways. In addition, ssGSEA suggested their involvement in immune cell infiltration.
Conclusion: BATF3, SOCS2, and GPER have emerged as promising gene candidates that may serve as biomarkers or potential therapeutic targets for CAD combined with NASH, linked to the regulation of metabolic, inflammatory, and cardiovascular pathways. We also identified insulin resistance and inflammation pathways as common mechanisms underlying both diseases.
Keywords: WGCNA; bioinformatics; coronary artery disease; machine learning; non-alcoholic steatohepatitis.
Copyright © 2025 Lin, Song and Li.
Conflict of interest statement
The authors declare that the research was conducted in the absence of any commercial or financial relationships that could be construed as a potential conflict of interest.
Figures
Similar articles
-
Identification of biomarkers associated with coronary artery disease and non-alcoholic fatty liver disease by bioinformatics analysis and machine learning.Sci Rep. 2025 Jan 28;15(1):3557. doi: 10.1038/s41598-025-87923-7. Sci Rep. 2025. PMID: 39875572 Free PMC article.
-
Deciphering Shared Gene Signatures and Immune Infiltration Characteristics Between Gestational Diabetes Mellitus and Preeclampsia by Integrated Bioinformatics Analysis and Machine Learning.Reprod Sci. 2025 Jun;32(6):1886-1904. doi: 10.1007/s43032-025-01847-1. Epub 2025 May 15. Reprod Sci. 2025. PMID: 40374866
-
Identification of hub genes in myocardial infarction by bioinformatics and machine learning: insights into inflammation and immune regulation.Front Mol Biosci. 2025 Jun 24;12:1607096. doi: 10.3389/fmolb.2025.1607096. eCollection 2025. Front Mol Biosci. 2025. PMID: 40630623 Free PMC article.
-
Statins for non-alcoholic fatty liver disease and non-alcoholic steatohepatitis.Cochrane Database Syst Rev. 2013 Dec 27;2013(12):CD008623. doi: 10.1002/14651858.CD008623.pub2. Cochrane Database Syst Rev. 2013. PMID: 24374462 Free PMC article.
-
Systemic pharmacological treatments for chronic plaque psoriasis: a network meta-analysis.Cochrane Database Syst Rev. 2017 Dec 22;12(12):CD011535. doi: 10.1002/14651858.CD011535.pub2. Cochrane Database Syst Rev. 2017. Update in: Cochrane Database Syst Rev. 2020 Jan 9;1:CD011535. doi: 10.1002/14651858.CD011535.pub3. PMID: 29271481 Free PMC article. Updated.
References
-
- Cabrera-Galván J. J., Araujo E., de Mirecki-Garrido M., Pérez-Rodríguez D., Guerra B., Aranda-Tavío H., et al. (2023). SOCS2 protects against chemical-induced hepatocellular carcinoma progression by modulating inflammation and cell proliferation in the liver. Biomed. and Pharmacother. 157, 114060. 10.1016/j.biopha.2022.114060 - DOI - PubMed
LinkOut - more resources
Full Text Sources
Miscellaneous